


1. Introduction
The marine-based West Antarctic ice sheet is drained by a series of fast-moving ice streams. In order to predict likely ice-sheet responses to future changes in climate, it is essential to understand the controls on ice-stream motion. Conditions at the bed of the ice stream are clearly important, and seismic studies indicate the presence of a water-saturated till beneath the very active Ice Stream B (Reference Blankenship, Bentley, Rooney and AlleyBlankenship and others 1986). Reference Alley, Blankenship, Bentley and RooneyAlley and others (1986) and Reference Lingle, Brown, Veen van der and OerlemansLingle and Brown (1987) have discussed the effects of such a layer on ice-stream motion. Earlier, Reference CraryCrary (1966), Reference BuddBudd (1966), and Reference ThomasThomas (1973) had pointed out that drag between an ice shelf and its sides and/or grounded-ice rises can have a major effect on ice streams flowing into the ice shelf. The linkage between ice-shelf drag and ice-stream motion acquires increased importance with the recent discovery of a partially grounded “ice plain” some 100 km long in the mouth of Ice Stream B (Reference Bindschadler, Stephenson, MacAyeal and ShabtaieBindschadler and others 1987a, Reference Shabtaie and BentleyShabtaie and Bentley 1987).
The formation of such an ice plain may explain why the adjacent Ice Stream C is now virtually inactive, with ice velocities two orders of magnitude less than those on Ice Stream B (Reference Bindschadler, MacAyeal, Stephenson, Veen van der and OerlemansBindschadler and others 1987b, Reference Whillans, Bolzan and ShabtaieWhillans and others 1987). In the first part of this paper, we present evidence of significant changes in thickness where Ice Stream C flows into Ross Ice Shelf, and an associated retreat of the grounding line between the ice stream and the ice shelf. This evidence is based on measurements made by each of the authors, whereas sections 4, 5, and 6 are the work only of the first author, who uses results from the first part of the paper, together with measurements indicating a reduction in the speed of nearby Ice Stream B (Reference Stepehenson and BindschadlerStephenson and Bindschadler, in press), to speculate about cyclic changes that these ice streams may undergo, associated with the sequential grounding and flotation of large “ice plains” in the mouths of the ice streams. (This speculative half of the paper was written as an invited contribution to this Symposium, and it was linked to the rest of the paper for the convenience of both the reader and the first author, who is quite content to take credit for the speculations. However, we distinguish between authorship of the two halves of the paper solely to satisfy a reviewer's recommendations.)

Fig. 1. The Siple Coast, showing ice streams A, B, C, D, and E, the location of H-5, and the positions of ice-thickness profiles, P to P′ and H-5 to Q, shown in Figure 6. The arrow shows the direction of ice motion at H-5. The cross-hatched regions are areas of almost level grounded and partially grounded ice shelf that are either active (in the mouth of Ice Stream B) or residual ice plains.
2. Observations
The Siple Coast region of West Antarctica is shown in Figure 1. The coast consists of a series of domes and ridges separating four major ice streams (B, C, D, and E) which drain approximately half of West Antarctica. Ice streams B and E, and probably D, are moving at several hundred metres per year, and their floating extensions together form more than half of Ross Ice Shelf (Reference Thomas, MacAyeal, Eilers, Gaylord, Bentley and HayesThomas and others 1984). Measurements of ice thickness (Reference Shabtaie, Whillans and BentleyShabtaie and others 1987) indicate that Ice Stream C has a configuration similar to that of its neighbours, with a width of approximately 100 km and with evidence for marginal crevassing. However, velocity measurements on the nearby ice shelf (Reference ThomasThomas 1976) indicated that its speed is at most just a few tens of metres per year, and aerial reconnaissance failed to reveal surface manifestation of the marginal crevasses that were inferred from surface back-scatter in airborne radio-echo-sounding data (Reference Shabtaie and BentleyShabtaie and Bentley 1987). More detailed measurements showed that the back-scatter is from buried features, most probably old crevasses, This supports the suggestion of Reference RoseRose (1979) that Ice Stream C was once a very active ice stream, but that now it is virtually stagnant. The measurements of thinning and grounding-line retreat that we present here were made in the mouth of this ice stream, approximately 20 km from its northern margin (Fig. 1).
In January 1974, as part of the Ross Ice Shelf Geophysical and Glaciological Survey (RIGGS), Station H-5 was established at a point 4 km seaward of a grounding line that was well defined by strand cracks and by a sharp rise in surface elevation inland. Because of the station's proximity to this grounding line, an 8 km stake line was also established, linking grounded ice with the floating ice shelf (Fig. 2). The position of the central stake (0) at H-5 was determined by a satellite doppler position-fixing system, and the relative positions of all other stakes were fixed both horizontally and vertically using conventional survey techniques. In addition, ground-based and airborne radio echo-sounding provided estimates of ice thickness along the entire stake network. Figure 3 shows the ice shelf in section, based on the levelling measurements, ice-thickness observations, and seismic sounding to seabed at H-5.

Fig. 2. A plan view of the stake network at H-5 is shown at the top of the figure; “0” is the central stake where the doppler position fixes were obtained and seismic measurements were made to seabed. The optical levelling was done along the continuous line linking B2 to A4. A selection of strain-rate tensors is included in the plan view, and longitudinal and vertical strain-rates are plotted against distance along the network. The bottom plot shows snow accumulation along the network, based on comparison of exposed stake lengths over the 11 year period. Solid circles represent stakes on the level line, and open circles represent those offset from the line.
The site was re-occupied both in December 1974 and in December 1976. The stakes were resurveyed and the position of the central stake at H-5 was again determined by using the doppler positioning equipment. Although total movement over the entire 3 year period was less than the errors in the estimated positions, a velocity of 9 m year−1 in a direction 296° east of true north was assigned to H-5, based on the strain-rates measured along the stake line and the down-hill direction on the grounded ice. The surface-elevation profile showed no significant change over the 1 year interval between levelling surveys.

Fig. 3. A section of the ice shelf and inland ice sheet taken along the stake network. Surface elevations were obtained by optical levelling, ice thicknesses from airborne radio echo-sounding, and the seabed depth at 0 from seismic sounding.
A more recent, extensive programme of glaciological research along the Siple Coast (Reference Bindschadler, MacAyeal, Stephenson, Veen van der and OerlemansBindschadler and others 1987b) provided another opportunity to visit the H-5 site. Moreover, estimates of total snow accumulation based on the earlier work indicated that most of the stakes should still be visible. They were all found and resurveyed, and a precise position was again obtained for H-5. Comparison of this position with the earlier estimates indicated that the average ice velocity at H-5 was 6 ± 2 m year−1 in a direction 321 ± 15 east of true north, just 5 west of the traverse direction. Comparison of the vertical positions of H-5 showed no significant difference when compared to the combined errors of the two “doppler” positions (approximately ±5 m in the vertical). Relative surface elevations were obtained by optical levelling, and horizontal positions were obtained by using standard survey techniques. Measured and calculated distances between stakes are accurate to a few centimetres, leading to errors of less than 10−5 year−1 in strain-rates derived for the 11 year period. Relative surface elevations also are accurate to a few centimetres, but additional errors due to tidal motion must be considered when comparing elevation profiles.
3. Interpretation
Results from the various measurements are summarized in Figures 2, 3, and 4. Figure 2 shows a plan view of the stake network with plots of longitudinal and vertical strain-rate, obtained from the two sets of survey results, and of snow-accumulation rate, obtained by measuring exposed lengths of the stakes. Surface-elevation and ice-thickness profiles are shown in Figure 3, where three distinctive regions are identified. The inland ice consists of a slab of ice of almost uniform thickness resting on an inclined bed. Heat-flow calculations indicate that, if the ice sheet was in a steady-state condition with a geothermal heat flow of 0.06 W m−2, the temperature of the basal ice would be approximately −12°C (personal communication from E. Roberts, July 1987). In fact, this part of the ice sheet is probably not in steady state and radio-echo-sounding data indicate the presence at the bed of a water-soaked layer at least several centimetres thick (Shabtaie and others 1987). Nevertheless, the ice locally appears to be anchored to the bed because ice at the inland end of the profile is moving at only 2 m year−1.
The “hinge region”, where the ice begins to float, is a zone where the ice thins significantly over a short distance and is marked at the surface by a valley close to the grounding line, followed by a ridge to seaward (Fig. 4). These features are similar to those formed where an elastic plate moves down-hill from a firm foundation on to an elastic one (Reference HetenyiHetenyi 1946). The grounding-line valley and adjacent ridge are not balanced by corresponding features in the base of the ice shelf, and locally the ice shelf is not in hydrostatic equilibrium. The actual line of flotation is marked by a set of near-parellel strand cracks — narrow fissures in the ice shelf which open and close in unison with tidal motion. These were located slightly inland of the grounding-line valley, as shown in Figure 4. Note that this type of surface profile is not typical of nearby grounding lines where fast-moving ice begins to float. Under these conditions, surface slopes on the grounded ice are low (of the order of 10−3), with only a small change in surface elevation (a few metres) at flotation, which generally occurs within a zone of partial grounding rather than at a discrete grounding line (Reference Bindschadler, MacAyeal, Stephenson, Vornberger and RobertsBindschadler and others, in press).

Fig. 4. Surface-elevation profiles along the stake network, obtained by optical levelling in January 1974 and December 1984. “S.C.” are strand cracks — narrow cracks that open and close as the ice shelf rises and falls with the tide.
To seaward of the hinge region, the ice shelf becomes flatter, and the relationship between surface elevation and ice thickness indicates that the ice is in hydrostatic equilibrium; strain-rates here are approximately constant. The snow-accumulation rate on the ice shelf shows a steady increase towards the grounding line, where there is a sharp decrease to a constant value on the inland ice. Strain-rates rapidly increase within the hinge region towards a maximum on the inland ice. Measurements of ice thickness suggest that the ice shelf becomes slightly thicker to seaward, but the total change is only 4 m within a distance of 3 km, and this lies within the measurement errors. Moreover, RIGGS measurements indicate that the ice shelf 50 km farther seaward is about 80 m thinner than at H-5 (Reference Bentley, Clough, Jezek and ShabtaieBentley and others 1979).
3.1 Ice thinning and grounding-line retreat
The most interesting feature in Figure 4 is the significant offset between the two profiles, far larger than could be caused by tidal motion. It is evident that the grounding-line valley and much of the inland slope retreated, during the 11 years between surveys, by a distance of 310 ± 50 m. This corresponds to an average retreat rate of 28 ± 5 m year−1. In addition, the inland ice became steeper and thinner, with the thinning rate decreasing away from the grounding line (Fig. 5). This is precisely what we would expect if the grounding line is retreating simply because the ice shelf locally is thinning, with ice “feeling” the effects of retreat for some distance inland. On the floating ice shelf, the major elevation changes are associated with migration of the grounding-line valley and adjacent ridge. In addition, there is a slight drop in surface elevation, but this could simply result from our choice of datum for the two profiles (the surface at B2 is set at 87 m elevation for both profiles). However, our choice appears to have been fortuitous because continuity considerations, discussed below, indicate ice-shelf thinning rates consistent with the observations.

Fig. 5. Observed changes in surface elevation (ΔE) between January 1974 and December 1984, with estimates of total thinning (ΔH) based on volume conservation.
Because we have no absolute elevation control against which to compare the two surface profiles, we cannot measure directly the thinning rates on either the ice shelf or the inland ice. However, ice-shelf surface elevations change by only 11% of the total thinning, and the elevation changes obtained by subtracting the two profiles in Figure 4 give a good indication of the actual change in thickness where the ice is grounded. The observed changes in elevation, shown in Figure 5, are substantial — up to five times larger than the total snow accumulation during the 11 years between surveys. Consequently, it is important to seek independent confirmation of these estimates from volume-continuity considerations. These require that
(Reference PatersonPaterson 1981), where ∂H/∂t is the thinning rate, A′ is the surface accumulation rate and B′ is the basal freezing rate (both expressed as equivalent ice thickness per unit time), V s and V b are ice velocities at the upper and lower surfaces respectively, α and β are surface and basal slopes (positive for downwards in the direction of motion), H is the ice thickness, and
is the depth-averaged vertical strain-rate.
On the grounded ice, V b is equal to, or very close to, zero. The basal freezing rate (B′) is almost certainly very small, and we shall assume it is negligible. Assuming that the depth-averaged value of the vertical strain-rate is identical with the value inferred from surface observations, estimates of the ice-thinning rate ∂H/∂t on the grounded ice were calculated and converted to the estimates of total thinning (ΔH) over the 11 year period which are included in Figure 5.
On floating ice shelf,Equation (equ.1) becomes:
where ∂H/∂x is the thickness gradient in the direction of motion. Equation (equ.2) was solved with B′ = 0 to give the estimates of ΔH, shown in Figure 5, over the ice-shelf part of the profile. These were reduced to equivalent elevation decreases (ΔE), assuming hydrostatic equilibrium. Close to the grounding line, these are very different from the observations, which are dominated by migration of the hinge-line valley and adjacent ridge.
Farther seaward, the calculated decrease in elevation shows a general agreement with observation. However, the actual changes in elevation could be uniformly greater or less than those shown in Figure 5, depending on whether the datum surface (at B2) was falling or rising. Moreover, the calculated values of ΔE would also be altered if there was basal freezing or melting. Nevertheless, the agreement between the observed and calculated values of ΔE on the freely floating ice shelf does indicate that we have made assumptions in a consistent manner.
On the inland ice, there are major differences between calculated and observed changes in surface elevation. Within 1 km of the grounding line, calculated thinning is approximately 60% of the observed values, whereas farther inland it increases to more than double the observed thinning. We suggest that this is associated with variations in strain-rate within the ice. If, as we have assumed, movement of the grounded ice is by internal shear with no basal sliding, then close to the grounding line there must be a transition from deformation flow (velocity decreasing with depth) to slab flow (velocity independent of depth). Within this transition region, longitudinal strain-rates at the surface represent a minimum. Indeed, if the transition takes place over a short distance, strain-rates near the bed may be several times larger than those at the surface. Calculated values of thinning, using surface measurements to estimate
The results described above indicate that the grounding line near H-5, in the mouth of Ice Stream C, is retreating about 28 m year−1. The cause of this retreat appears to be the thinning of adjacent ice shelf by 0.2 − 0.3 m year−1, but we cannot estimate ice-shelf thinning rates accurately because these are affected by basal melting or freezing, which have not been measured. However, we do have indirect evidence that basal melting is more likely than freezing. Within the hinge region, the ice thins some 30 m over a distance of 2 km. Taking account of ice motion and grounding-line retreat, the time taken for ice to pass through this thinning zone is approximately 65 years, implying an average thinning rate of 0.45 m year−1. This is significantly greater than the average value (less than 0.3 m year−1) calculated by assuming zero basal melting (Fig. 5). The difference could be due to:
recent increases in ice velocities or grounding-line retreat rates, so that actual residence time in the 2 km thinning zone was greater than 65 years;
an increase in creep rates with depth (as appears to be occurring inland of the grounding line), which would imply that actual thinning rates are greater than the calculated values shown in Figure 5; and/or bottom melting, which could increase the calculated thinning rates above 0.3 m year−1.
Conditions close to the grounding line may be favourable for basal melting because tidal mixing could bring warm, sub-ice-shelf water into contact with the ice (Reference MacAyealMacAyeal 1984). Consequently, we conclude that melting is more probable than freezing and that the ice shelf is thinning by at least 0.2 m year−1, causing the grounding line to retreat.
Inland of the transition zone, the observed thinning decreases with increasing distance, suggesting that it trends towards zero at a point approximately 2 km farther inland. The ice velocity at this point must also be close to zero, based on its value at A4 and the longitudinal strain-rate between A3 and A4. Ice farther inland is probably inactive, with very low strain-rates, and thickening by snow accumulation at approximately 0.1 m year−1.
3.2 The ice plain
The present-day inactivity of Ice Stream C, and the presence of buried crevasses along its margins (Rose 1979), indicate that the now stagnant ice stream was active comparatively recently. Shabtaie and Bentley (1987) measured the depth of radar clutter associated with the buried crevasses as 35 m at a point some 250 km up-stream from the present grounding line. This corresponds to about 250 years of snow accumulation. However, we should note that it represents a minimum estimate because crevasse systems similar to those currently observable along ice streams B and E would remain open for perhaps a few decades after becoming inactive. Here we shall assume that Ice Stream C slowed to approximately its present condition 300 years ago.
When the ice stream was active, it probably extended for a considerable distance into the ice shelf, just as Ice Stream B does today (Fig. 1), to form a promontory or “ice plain”, lightly grounded on a bed that offered little resistance to its forward motion. Indeed, although such ice is grounded, it behaves in much the same way as floating ice shelf. However, because it is grounded, its surface lies above that corresponding to hydrostatic equilibrium by as much as 20 or 30 m, with surface slopes less than 10−3 (Reference Bindschadler, Stephenson, MacAyeal and ShabtaieBindschadler and others 1987a, Shabtaie and Bentley 1987). We suggest that the ice-shelf embayment in the mouth of Ice Stream C was once such an ice plain. Indeed, large areas of grounded and partially grounded ice still exist both to the west and to the north of H-5 (Fig. 1). Moreover, radio echo-sounding indicates that, 10 km inland from H-5, the surface rises to about 50 m above the ice shelf before levelling to what is probably a relict ice plain with an almost constant elevation and a length of perhaps 50 km (Fig. 6). This ice plain could once have extended some tens of kilometres down-stream of H-5, as shown in Figure 7.
If such an ice plain did exist, the rate of grounding-line retreat once Ice Stream C had become inactive would be proportional, approximately, to the thinning rate divided by the surface slope up-stream of the grounding line. At present, the surface slope here is approximately 2 × 10⁻², compared to 10−s or less on the ice plain. So, for a given thinning rate, initial retreat rates would have been at least 20 times faster than today. Consequently, total retreat during 300 years could have been far greater than suggested by the present slow retreat of about 30 m year−1. (It is interesting to note that this conclusion broadly parallels that of Reference HughesHughes (1973), who, using very few data, estimated an average retreat rate for Ice Stream C over the last 880 years of 300 m year−1.) Assuming that the ice-shelf thinning rate has remained constant at 0.25 m year−1, the ice shelf 300 years ago was 75 m thicker than today and would have been grounded wherever the sea-water layer beneath the ice shelf is currently less than 65 m thick — for a distance of more than 150 km seaward of H-5 (Fig. 6). Thus the ice plain could have filled the entire area between the promontories of grounded and partially grounded ice to the west and north of H-5 (Fig. 1).

Fig. 6. Ice-thickness observations based on airborne radio-echo-sounding measurements made along P to P′ and H-5 to Q, shown in Figure 1. Note the difference in horizontal scale in the two sections. The section H-5 to Q was taken along the same route as the detailed profiles shown in Figures 3 and 4.
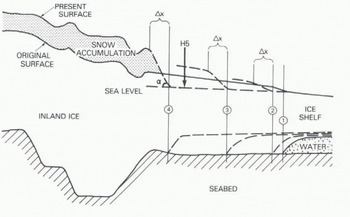
Fig. 7. A schematic diagram showing a possible retreat sequence (1–4) of the ice plain in the mouth of Ice Stream C. At each stage, the surface slope at the grounding line (α) becomes steeper and the retreat rate becomes slower.
4. An Oscillating Ice Stream
Development of such a large ice plain could explain why Ice Stream C has become inactive. Moreover, the seabed in the mouth of Ice Stream C is so close to the base of the ice shelf that formation of the ice plain is probably inevitable whenever the ice stream is moving fast. For then the ice shelf thickens both by increased advection of thicker ice from up-stream and because creep thinning is inhibited by compression from the ice stream. Indeed, sequential periods of inactivity and stagnation may represent normal conditions for this ice stream. A typical cycle might comprise:
Flow of Ice Stream C over a layer of deformable, water-saturated till (Blankenship and others 1986). Movement is probably by a combination of shear within (Alley and others 1986) and gliding over the till layer (Lingle and Brown 1987).
The speed of the ice stream increases if friction at its bed is reduced because the almost impervious till is unable to conduct away water melted by heat generated in the basal ice and underlying till (Weertman 1969).
Continued heat generation raises cold basal ice to the melting point and increases the area where basal sliding can occur. This also would decrease bed friction and extend farther into the catchment basin the fast-moving part of the ice stream with its low surface slopes (Reference Hughes, Denton and HughesHughes 1981).
During this phase, the ice stream discharges more ice than is accumulated from snow-fall.
Sustained thickening of the ice shelf in the mouth of the ice stream, caused by increased advection and strong compressive forces imposed by the rapidly moving ice stream (Reference ThomasThomas 1973).
Progressive grounding of the thickening ice shelf, to produce an ice plain which must be pushed seaward by the ice stream.
Progressive increase in the compressive force between the ice stream and the combined ice-plain / ice-shelf system.
The speed of the ice stream starts to decrease when the rate of increase in compressive force is greater than the rate of decrease in basal friction.
The ice shelf continues to thicken until ice-stream speed has slowed sufficiently to allow thinning, by ice-shelf spreading, to balance thickening by ice advection and snow accumulation. Thus the ice plain continues to grow in size after the ice stream has started to slow down.
During this phase, continued growth of the ice plain and a decrease in melting at the ice stream bed, associated with basal heat generation, both reduce the speed of the ice stream.
When ice-stream discharge has decreased sufficiently, ice within its catchment basin starts to increase in volume by excessive snow accumulation.
Reduction in compressive forces within the ice shelf allows strain-rates to increase and the ice shelf to thin. This in turn forces retreat of the grounding line between the ice plain and the ice shelf (Reference Thomas and BentleyThomas and Bentley 1978).
Continued reduction in size of the ice plain, together with ice thickening within the catchment basin, ultimately initiates a new active phase for the ice stream.
During the inactive phase, water within the till will probably slowly freeze on to the bed of the ice stream. Indeed, if the geothermal heat flux is 0.06 W m−J, at least 1.5 m of ice should have frozen on to the base of the ice plain near H-5 during the past 300 years. However, a doubling of the geothermal heat flux would reduce freezing to zero, and the presence of wet areas beneath Siple Dome to the north of Ice Stream C suggests that geothermal heat flux along the Siple Coast may be higher than normal (Shabtaie and others 1987). At any event, if flotation of the ice plain is sufficiently rapid, acceleration of the ice stream will be facilitated by the presence of a remanent layer of saturated basal till, and the interval between periods of activity may be comparatively short — a few hundred years. By contrast, if the ice stream remains inactive for a long enough period to allow freezing of all basal melt water, then the ice stream would have to thicken sufficiently to initiate significant heating by internal deformation (Reference FastookFastook 1987), followed by progressively more intense basal melting and finally another phase of very rapid motion. This entire sequence could take several thousand years.
5. Future Behaviour
We can attempt to predict the future behaviour of the grounding line of Ice Stream C by calculating how much thinner the ice shelf must become to reach an equilibrium thickness such that thinning by creep is exactly compensated for by snow accumulation. First, we calculate the compressive force within the ice shelf that is compatible with the observed strain-rates at H-5. Then, assuming that this force remains constant and that there is no basal freezing or melting, we can estimate the equilibrium thickness. The relationship between ice thickness (H), compressive force (F) per unit width of ice shelf in the direction of motion, and longitudinal strain-rate in the direction of motion (ε′) was derived by Thomas (1973):

where θ = (lateral strain-rate / longitudinal strain-rate), C is the length of the equivalent column of air within the ice shelf (∼15 m on Ross Ice Shelf), ρi and ρw are the densities of ice and water, g is the acceleration due to gravity, and B is the depth-averaged value of the hardness parameter in the ice-flow law (Reference Thomas and MacAyealThomas and MacAyeal (1982) estimate this to be about 1.65 × 10⁸ N−2 s1/3 near H-5). At H-5, our observations indicate that
is 5.8 × 10⁻⁴ year−1, θp is −0.13 and H p is 652 m, where the subscript P denotes present-day values. Solution of Equation (equ.3) then gives F p = 150 MN m−1. Assuming zero basal flux, we also know that ice at H-5 is thinning by creep 0.22 m year−1 more rapidly than it is being thickened by snow accumulation. Consequently we can write:
where H e and
are the ice thickness and strain-rate that exactly balance snow accumulation. Assuming that θ, B, and F do not change with time, we can now solve Equations (3) and (4) for using the value of F found above; we find H e to be 621 m, some 30 m less than today. This estimate of 30 m residual thinning for the ice shelf to achieve equilibrium with snow-accumulation rates is insensitive to errors in H p,
Figure 6 shows the results from two radio-echo-sounding flights passing over H-5: one was along the stake-line direction and one was parallel to the centre line (and the presumed past flow direction) of Ice Stream C. They indicate that, although bedrock elevations rise a few metres immediately up-stream of the present grounding line, the bed of the ice sheet is deeper than 540 m below sea-level for a distance of more than 100 km inland from H-5. This suggests that, under present conditions, the grounding line will continue to retreat this entire distance. Initially, retreat rates will be similar to present-day values (28 m year−1), and it will take about 100 years for the grounding line to reach the nearby bedrock rise. Thereafter the grounding line will retreat more rapidly over the deeper bedrock east of H-5. In that direction, ice thickness at the point of flotation will increase, causing an increase in creep thinning rates and a more rapid retreat. Assuming that F, B, and θ remain constant, solution of Equation (equ.3) for a range of values for H gives an indication of the dependence of the creep thinning rate on ice thickness at the grounding line (Fig. 8). Retreat rates will increase approximately proportionally to the increase in thinning, to reach a maximum of about 150 m year−1 over the deepest bedrock.
The available ice-thickness measurements indicate that the bedrock profile up-stream of H-5 is representative of Ice Stream C, and the retreat sequence proposed above is probably appropriate for the entire lower reaches of the ice stream. However, we should note that, once the grounding line retreats beyond the nearby bedrock rise, changes in the basal conditions encountered by the retreating grounding line or in the forces acting on the ice shelf could significantly affect retreat reates.

Fig. 8. The rate of ice-shelf thinning by creep as a function of ice thickness, assuming that the restraining force on the ice shelf and the depth-averaged creep properties remain constant at the values they have today at H-5.
Shabtaie and others (1987) show evidence from radio-echo-sounding data that indicates the presence of a water layer beneath much of the ice up-stream of H-5. They also detect an ice ridge running across the ice stream, close to the grounding line, and overlying the bedrock rise near H-5 (Fig. 6). This ridge, and similar ones farther up-stream, are probably relics from the period when the ice stream was still pushing the ice plain seaward over a lubricated bed; the ice would tend to compress and thicken up-stream of bedrock sills. Today, this ridge of ice near the grounding line is blocking seaward motion of the sluggish ice farther up-stream. When the grounding line retreats over the sill, however, the ice ridge will no longer exist, and up-stream ice will be able to spread seaward hindered only by ice-shelf restraining forces and basal friction. If there is sufficient water trapped beneath the ice, then seaward spreading could be very fast, fuelled by surface elevations well above those required for hydrostatic equilibrium (Hughes 1973).
The estimates of thinning rate shown in Figure 8 were derived by assuming that ice-shelf restraining forces (F) remain constant with time. If they decrease, then thinning rates and retreat rates would increase. For instance, a 10% decrease in F would result in a doubling of the creep thinning rate at H-5. At present, the restraining forces are largely controlled by the behaviour of Ice Stream B. Much of the discharge from this ice stream flows north of Crary Ice Rise and spreads laterally into the mouth of Ice Stream C. Comparison of recently measured ice velocities up-stream of Crary Ice Rise with those measured during the RIGGS indicate that the ice has slowed by about 20% over a ten year period, from an average speed of 500 m year−1 (Stephenson and Bindschadler, in press). If this is sustained, then Ice Stream B may be entering a phase of stagnation similar to that of Ice Stream C. The supply of thick ice into the area down-stream of Ice Stream C will then diminish, and F may decrease sufficiently to initiate a new phase of activity in Ice Stream C.
At present, available data suggest that ice discharge from Ice Stream B exceeds total snow accumulation within the catchment basin, perhaps by as much as 40% (Reference Whillans and BindschadlerWhillans and Bindschadler 1988, this volume). Moreover, a large area of ice shelf around Crary Ice Rise, down-stream of Ice Stream B, is estimated to be thickening by more than 0.4 m year−1 (Reference MacAyeal, Bindschadler, Shabtaie, Stephenson and BentleyMacAyeal and others 1987). This indicates that the ice plain in the mouth of Ice Stream B probably is still growing despite the apparent reduction in ice-stream velocity, which is consistent with the suggestion in section 4 that the ice shelf will continue to thicken until the speed of the ice stream has decreased to some critical value. The observations of decreasing speed on Ice Stream B suggest that conditions are changing very rapidly. Although this may represent some natural variation that will be reversed equally rapidly, there is a strong likelihood that the speed will continue to decrease rapidly, particularly if the ice plain continues to grow in size.
Three conditions are necessary for an ice stream to oscillate comparatively frequently between periods of rapid motion and almost complete inactivity:
-
The ice stream must flow over a bed that remains at the ice melting temperature throughout periods of inactivity. This will occur if the bed is of porous, till-like material or is in an area of high geothermal heat flux. A sufficiently thick layer of till can store enough residual water to survive gradual freezing during periods of inactivity when negligible heat is induced by motion. If the ice stream flows over rock, residual water is pumped seaward along the ice/rock interface, and a high geothermal heat flux is needed to prevent freezing of the basal ice to bedrock.
-
The ice stream must flow into an ice shelf that is in some way constrained, so that its seaward motion is resisted by side drag and/or by grounded areas within the ice shelf. Compressive forces induced by the ice stream entering the ice shelf then increase as the speed of the ice stream increases.
-
Seabed in the mouth of the ice stream must be close to the base of the ice shelf. This ensures that an ice plain will form when the ice shelf thickens.
All of these conditions are fulfilled by Ice Stream B and probably by Ice Stream C. However, a large ice plain is unlikely to form in the mouth of Ice Stream A, which flows into comparatively deep water. More information is needed in the mouths of ice streams D and E, but it appears unlikely that conditions there are as favourable for ice-plain formation as in the mouths of ice streams B and C.
6. Recommendations
If ice streams B and C do oscillate as we have suggested, it becomes extremely difficult to determine the long-term mass balance of their catchment basins. Because rapid flow of one of these ice streams will increase ice-shelf back pressure on the other, they probably oscillate out of phase with each other. Certainly, they are out of phase now, with Ice Stream B apparently exceeding balance velocities and Ice Stream C entirely dormant. Comparison of ice discharge with total snow accumulation can only give us a snapshot view of their changing behaviour. The pattern of thickening and thinning over large areas would provide a better indication of overall trends, and this could be obtained from sequential, accurate measurements of surface elevation from satellites or aircraft. However, detection of long-term trends in ice-surface elevation will require analysis of ice cores taken from strategic locations on the ridges and domes separating the ice streams. One of these ice cores should be taken from Siple Dome, and the core hole used to determine whether there is liquid water at the bed, to investigate the characteristics of the underlying material, and to measure the geothermal heat flux. Similar measurements should be made in a hole reaching the bed in the lower reaches of Ice Stream C.
Additional measurements will also be required in order to detect whether the ice streams are likely to oscillate:
-
Monitor the speeds of ice streams B and C at the four major stations (“Upstream” B and C, “Downstream” B and C) recently established by the Siple Coast Project. Similar stations should also be established at least in the mouths of ice streams D and E.
-
Monitor the grounding-line position at H-5. As in the case of (1), this could be done on an opportunity basis, but accurate measurements should be made at least every 5 years, and the stations should be large enough to be visible after at least 10 years' snow accumulation.
-
Detailed, accurately navigated radio echo-sounding should be completed in the mouths of all the ice streams, to detect grounding lines, to reveal their surface and bed characteristics, and to identify areas overlying deeper bedrock that may be vulnerable to rapid retreat. Careful analysis of Landsat and Spot imagery could contribute to this work.
-
Measurements of the burial depth of crevasses at several locations along the margins of Ice Stream C, to reconstruct a detailed chronology of the ice stream's decline.
-
Seismic work to investigate seabed topography in the mouths of ice streams D and E, and to determine whether all the Siple Coast ice streams are underlain by wet till.
Acknowledgements
We thank all those who assisted with the field measurements used in this paper, E. Roberts for providing results from his calculations of temperature profiles in Ice Stream C, and the division of Polar Programs at the U.S. National Science Foundation for funding the field work.


