1. Introduction
Studies on the chemical constituents of ice cores obtained from polar ice sheets have provided information on the past atmospheric environment (see reviews: Reference Clausen, jr, Oeschger and LangwayClausen and Langway, 1989 Reference DelmasDelmas, 1992Seasonal variations in concentration levels of chemical constituents recorded in snow deposits and ice cores have been used to identify annual layers of snow or ice and to investigate sources of constituentsReference Herron and CurrieHerron, 1982 Reference Legrand and andDelmasLegrand and Delmas, 1984) Studies on fallen and drifting-snow samples are essential to understand the chemical stratigraphy of seasonal variations at the concentration levels of constituents in deposited snow. However, reports on the chemistry of fallen and drifting-snow samples are very limited for (1) the number of samples measured Reference Maupetit and andDelmasMaupetit and Delmas, 1992 and (2) the period of samplingReference Kamiyama, Ageta and Fujii(Kamiyama and others, 1989)
Even under clear-sky conditions, drifting- or blowing snow phenomena are observed at Mizuho Station due to strong katabatic winds. Drifting-snow particles originate from the snow surface by wind erosion. Under precipitating conditions, newly fallen snow particles arc mixed with the drifting-snow particles. These mixed snow particles, as well as aged drifting-snow particles, again deposit on to the snow surface. In other words, deposited snow in a katabatic-wind region consists of a mixture of newly fallen and aged drifting-snow particles. Since such settled snow is called “snowdrift”, in the same manner, snow trapped in a sampling bottle in a small pit is defined as “snowdrift trapped” in this paper.
The purpose of this study is to extend the preliminary chemical dataReference Osada, Ohmae, Nishio, Higuchi and Kanamori(Osada and others, 1989) of trapped snowdrift samples obtained from east Dronning Maud Land, East Antarctica, and to investigate the detailed seasonal and short-term (time-scale of a few hours to a day: variation of major soluble constituents (Cl, NO3, SO4 2-, Na+) of the trapped snowdrift samples.
2. Sampling and analysis
Samples of drifting snow were taken at Mizuho Station (70°42' S, 44°20' E, 2230 m a.s.1) from February to SeptemberReference Nishio, Ohmae and andIshikawa1986and along oversnow traverse routes in east Dronning Maud Land (1800-3000 m a.s.1) from OctoberReference Nishio, Ohmae and andIshikawa1986to JanuaryReference Ohmae, Osada and Nishio1987.Figure 1 is a location map of Mizuho Station and the traverse routes. InFigure 1, thick lines indicate the traverse routes where snow-trap sampling was made. The observed area in this study is categorized as a cold katabatic regionReference Dalrymple and Rubin(Dalrymple, 1966)where drifting and blowing snow conditions are frequently observed (see details for drifting-snow conditions at Mizuho Station inReference KobayashiKobayashi (1978) andReference Savoie, Prospero, Larsen and andSaltzmanTakahashi (1985))
Snow-trap sampling was carried out with special care to avoid contamination from snow vehicles, station and human activities, wearing clean clothing, dean mask and powder-free clean PVC gloves. Since the direction of katabatic winds is stable at a given location, all sampling pits were set in a position at least 100 m upwind of station and field-camp activities. Sampling personnel were always kept in their position downwind of the prevailing katabatic wind direction against the sampling bottles and equipment
Polypropylene (PP) sampling bottles (11) were pre-cleaned as reported byReference KanarnoriKanamori and others (1987)About 100-300 g of snow sample drifting just above the snow surface was directly trapped into the wide-mouth 11 PP bottle. The weight of trapped snow depends on type of drifting-snow particles: a lighter weight for mixed drifting snow with newly fallen snow particles and a heavier weight for aged drifting-snow particles. The sampling duration is typically between 1 h and a few hours until a full sampling-bottle set was obtained in a small pit which is as deep as the height of the bottleReference Osada, Ohmae, Nishio, Higuchi and Kanamori(Osada and others, 1989)Then they were sealed in double PE bags and kept frozen until analysis in the laboratory in Japan
Polyethylene (PE) sampling bottles (250 ml) were pre-cleaned only by deionized water without the use of acids. Some duplicate snow samples using both the PP and the PE bottles were made for comparison of bottle-cleaning procedures
As described in a previous paperReference Osada, Ohmae, Nishio, Higuchi and Kanamori(Osada and others, 1989)snow samples were melted at room temperature in the laboratory and immediately filtered through a membrane filter (Nudepore filter with a 0.22μm pore size). In this study, concentrations of Na+, Cl, NO3-and SO4 2- in non-filtered meltwater samples from both the 11 PP and the 250 ml PE bottles were measured by an ion chromatograph (Dionex 2000i/SP) in the laboratory of the National Institute of Polar Research in Tokyo. Comparison of duplicate samples for bottle-cleaning procedures and filtered/non-filtered samples show an insignificant difference for ions measured, within an error of ion-chromatographic measurements (typically <10%)
The isotopic composition of the meltwater was obtained by analyses with a MAT 250 mass spectrometer at the Water Research Institute, Nagoya, on CO2 equilibrated with the meltwater of the samples. The analytical error was less than 0.2%0 in δ18O.

Fig. 1. Map of traverse routes in east Dronning Maud Land, Antarctica. Trap sampling of drifting snow was conducted along the routes shown by the thick lines. G2 and G6: glaciological observation sites, Y: Yamato Mountains, B: Belgicafjella and SR: Sȷr-Rondane mountains.
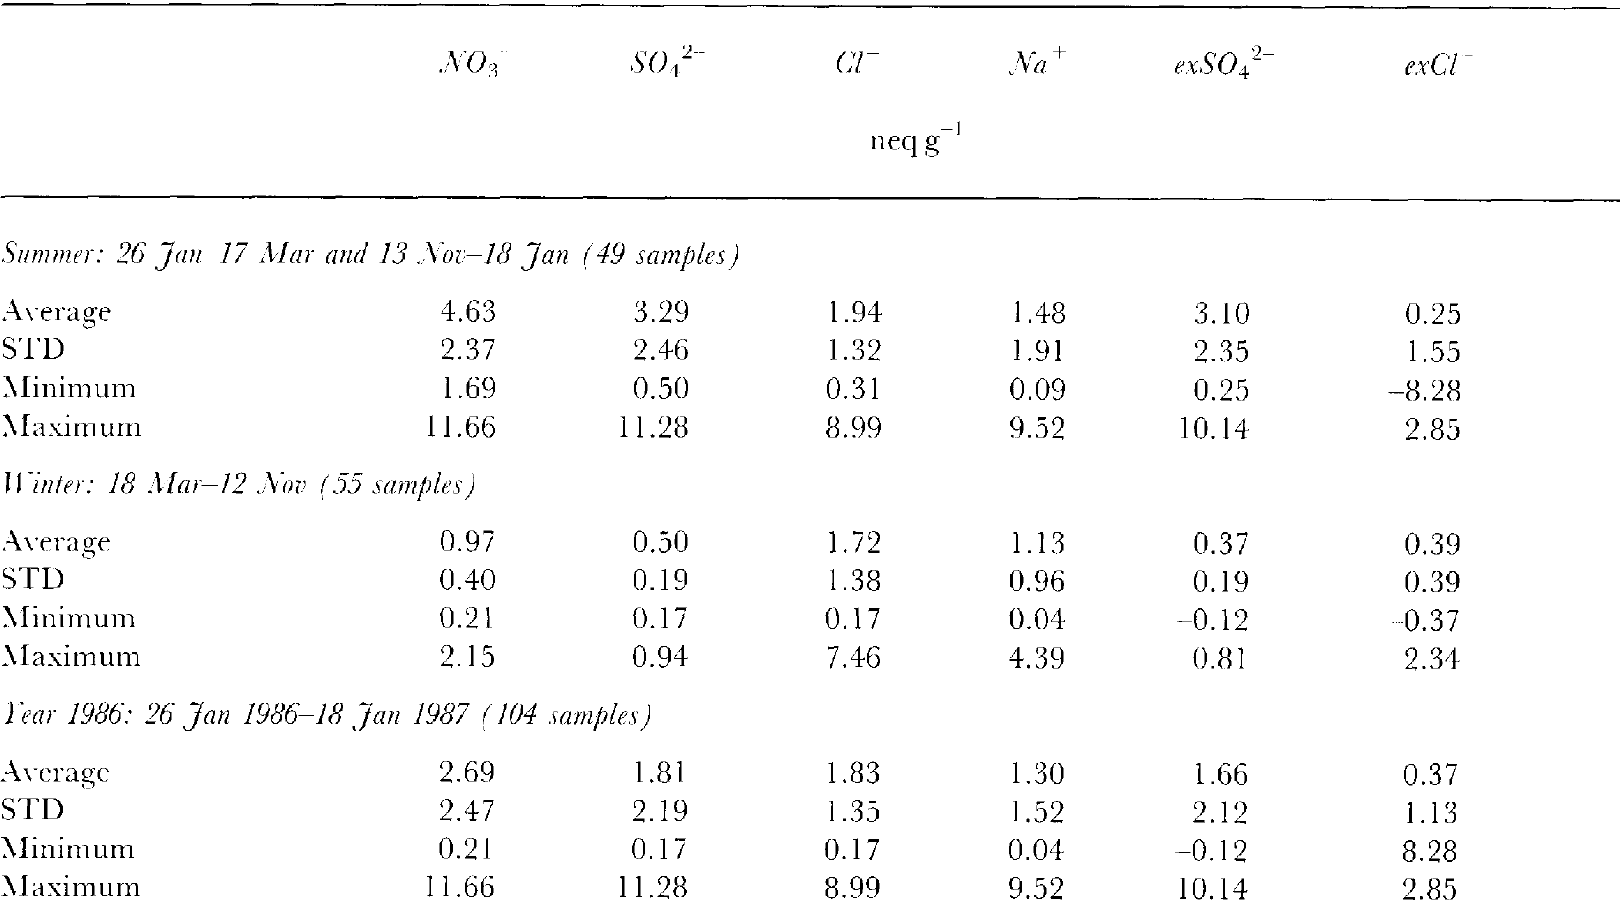
Table 1 Concentration levels of major ionic constituents in snowdrift
3. Results and discussion
Figure 2 shows the variation of δ18O values measured on the snowdrift samples trapped and the elevation of the sampling points. Variation of the δ18O values includes short-term variations during a precipitation event (sampled at Mizuho Station until early October) and .changes in the sampling-site elevation as well as distance from the coast. Temporal and spatial variations in the δ18O values for this region have been described by Reference Watanabe, Kato and SatowWatanabe and others 1981 Reference Watanabe, Fujii and SalowWatanabe and others 1988andReference AgetaAgeta (1993)
Figure 3 shows results of chemical analyses of the snowdrift samples that were trapped. In Figure 3, triangles represent snow samples containing newly fallen snow and open circles represent drifting-snow samples without falling snow. No samples were obtained for the gaps in December in the figure, because of the traverse of the bare icefield in the Yamato Mountains area. The results are summarized in Table 1. Excess SO4 2- concentrations (abbreviated as exSO4 2- hereafter) are the non-sea-salt part of the total SO4 2-content measured. The exSO4 2- concentrations are calculated from the measured SO4 2-and Na+ contents of the samples using the SO4 2-/ Na+ ratio in sea water (0.12 in equivalent units).
The seasonal variations in the concentrations of NO3- and exSO4 2- in the snowdrift trapped show distinctive maxima in summer and minima in winter. Concentration levels for NO3-and exSO4 2- show low variabilities in winter relative to variations in summer. The amplitudes of the concentration levels between summer and winter averages (Table 1) are 4.8 times for NO3- (summer, 4.63∼ winter, 0.97 neq g1) and 8.4 times for exSO4 2- (summer. 3.10∼ winter, 0.37 neq g-1). These seasonal amplitudes are close to the results of atmospheric aerosols collected at MawsonReference Savoie, Prospero, Larsen and andSaltzman(Savoie and others, 1992)about 5 times (summer maximum: October-December; winter minimum: April- May) for NO3- and about 7.6 times (maximum: October- March; minimum: April-September) for exSO4 2-.
On the other hand, detailed seasonal variations for NO3- and exSO4 2-are different from those of aerosol data collected at the coastal stations (at Georg von Neumayer:Reference Wagenbach, Gorlach, Moscr and MunnichWagenbach and others, 1988at Mawson:Reference Savoie, Prospero, Larsen and andSaltzmanSavoie and others, 1992 (1) a small winter peak of NO3- concentration in aerosols does not appear in the snowdrift trapped, (2) a sharp transition from summer to winter of exSO4 2 in the snowdrift took only about 20 d instead of a sinusoidal smooth curve for the results of the aerosols.
The seasonal variations in the Na+ and Cl concentrations show a similar trend except for a few points of significant excess or a depleted amount for the Cl- concentration levels (Fig. 3). Excess Cl- concentration levels (exCl-) with respect to the sea-water composition are calculated from the Cl and Na+ contents of the samples using the Cl-/Na+ ratio in sea water (1.17 in equivalent units). The seasonal variation of exCl- is not significant but it shows excess values about 0.4 neq g-1 for most of the year, except for some summer depletion points. Because sampling locations were moved from Mizuho Station after early October to the inland plateau, the exCl profile includes changes in fractionation conditions such as the transport distance of sea salts from the coast
Reference Legrand and andDelmasLegrand and Delmas (1981, 1988) reported that the Cl/Na ratio in deposited snow increases with distance inland from the coast. They suggested HCl-formation processes as follows: HCl is formed in the coastal area where sea-salt particles are abundant and then subsequently HCl is transported inland and deposited on the Antarctic Plateau. As opposed to the geographical variation of Cl/Na in deposited snow in Terre AdélieReference Legrand and Delmas(Legrand and Delmas, 1985)the exCl- profile in this study shows negative values with a high sea-salt concentration at the most distant location (G6) from the coast.
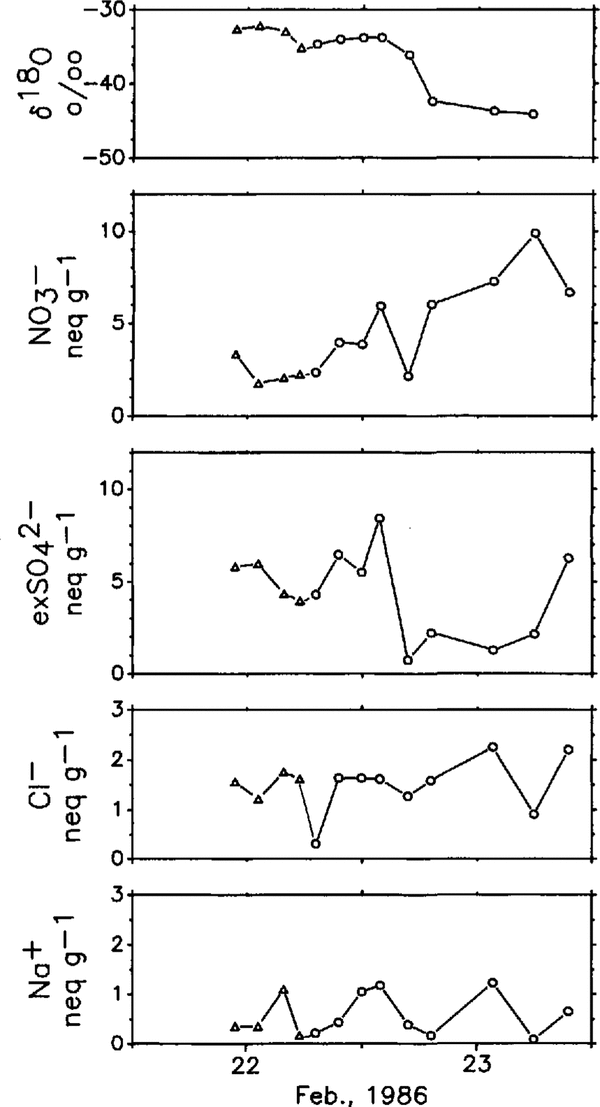
Figure 4 shows the short-term variations of δ18O and major ionic constituents measured on the snowdrift samples trapped at Mizuho Station in FebruaryReference Nishio, Ohmae and andIshikawa1986The beginning of the intensive sampling set corresponds to a snow-precipitation event. This fallen-snow condition (triangles in Figure 4) continued until the late afternoon of 22 FebruaryReference Ohmae, Osada and Nishio(Ohmae and others, 1987)The δ18O profile shows a decreasing trend (about 10-12%0 decrease) associated with a cooling trend in the air temperature (about 7°C decrease) within a day. After precipitation stopped, concentration levels of NO3 showed an increasing trend but exSO4 2- increased until after noon then decreased at once. The sea-salt components (Cl- and Na+) show a similar trend to each other but show different trends with NO3- and exSO42-. An excess amount of Cl (not shown in Figure 4) always exists during this period (0.06-1.43neq gl). Synoptic meteorological charts during this period indicate that a cyclone passed off the coast from 21 to 22 February, then subsequently, a ridge of high pressure came over this region on 23 February.
Figure 5 shows another set of an intensive sampling period of a 16d stay from 21 November to 5 DecemberReference Nishio, Ohmae and andIshikawa1986at a glaciological strain-grid station: G6 (73°07' S, 39°46' E, 3005 m a.s.l.;Reference Nishio, Ohmae and andIshikawaNishio and others, 1986). During this period, intermittent precipitation events were observed from 24 to 28 NovemberReference Nishio, Ohmae and andOsada(Nishio and others, 1988). Cloudy sky conditions extended from 28 to 30 November and clear-sky conditions persisted for the rest of the period. No significant trend in the δ18O profile is seen in the figure, whereas major ionic contents measured show parallel trends in their variations: low concentration levels during intermittent precipitation events and cloudy days. Synoptic meteorological charts do not show a passing significant ridge of high pressure over this region before or after the precipitation events.
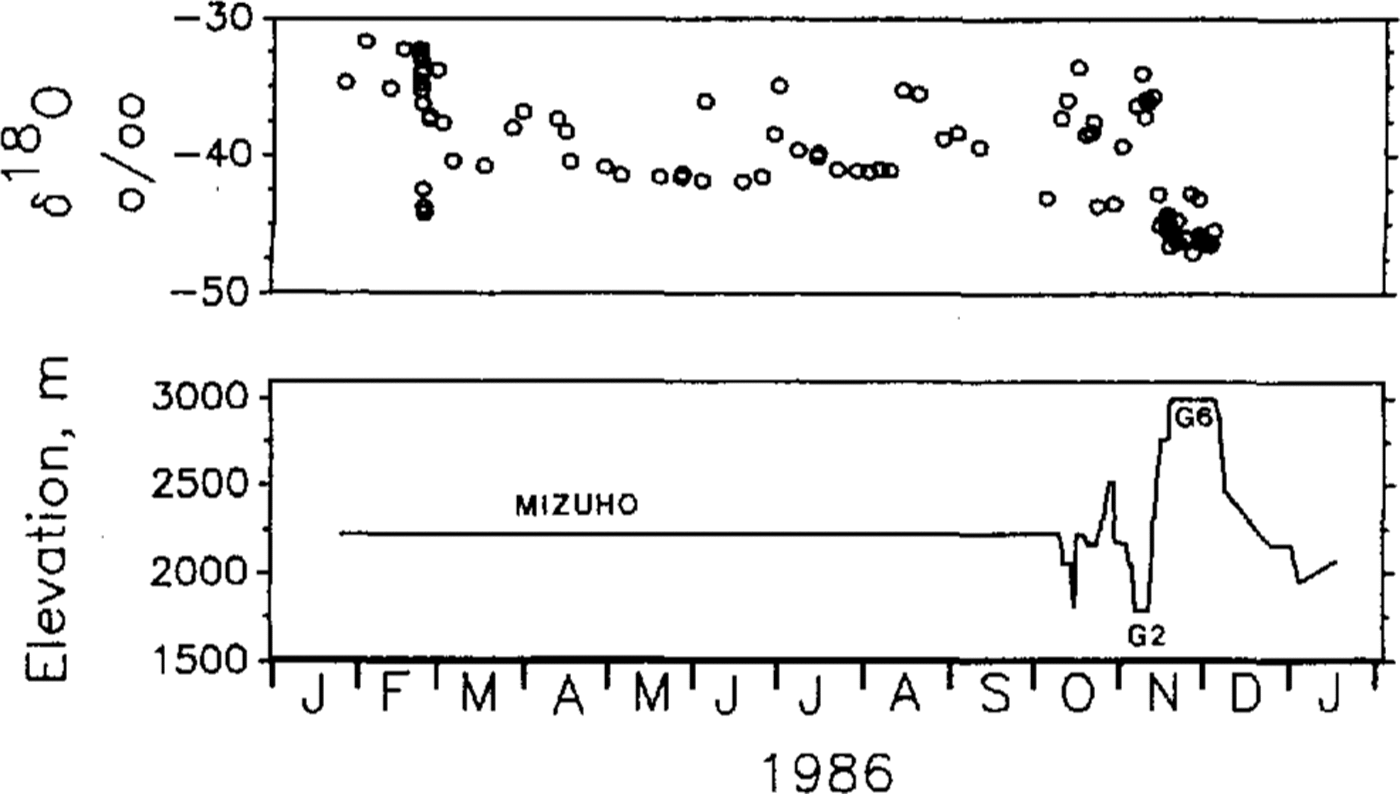
Fig.2. Oxygen-isotope ratio of drifting-snow samples trapped (upper) and elevation (m a.s.1.) of sampling points (lower). Station names of longer duration of stay are indicated for Mizuho Station, G2 and G6 sites

Fig. 3 Variations in concentration levels of ionic constituents in trapped snowdrift samples obtained from east Dronning Maud Land. Triangles represent snow samples containing fresh falling-snow particles. Open circles represent snow samples without falling-snow particles.

Fig. 4 Short-term variations of oxygen-isotope ratio and ionic concentration levels in snowdrift samples trapped at Mizuho Station. Triangles and circles represent the same as in Figure 3.
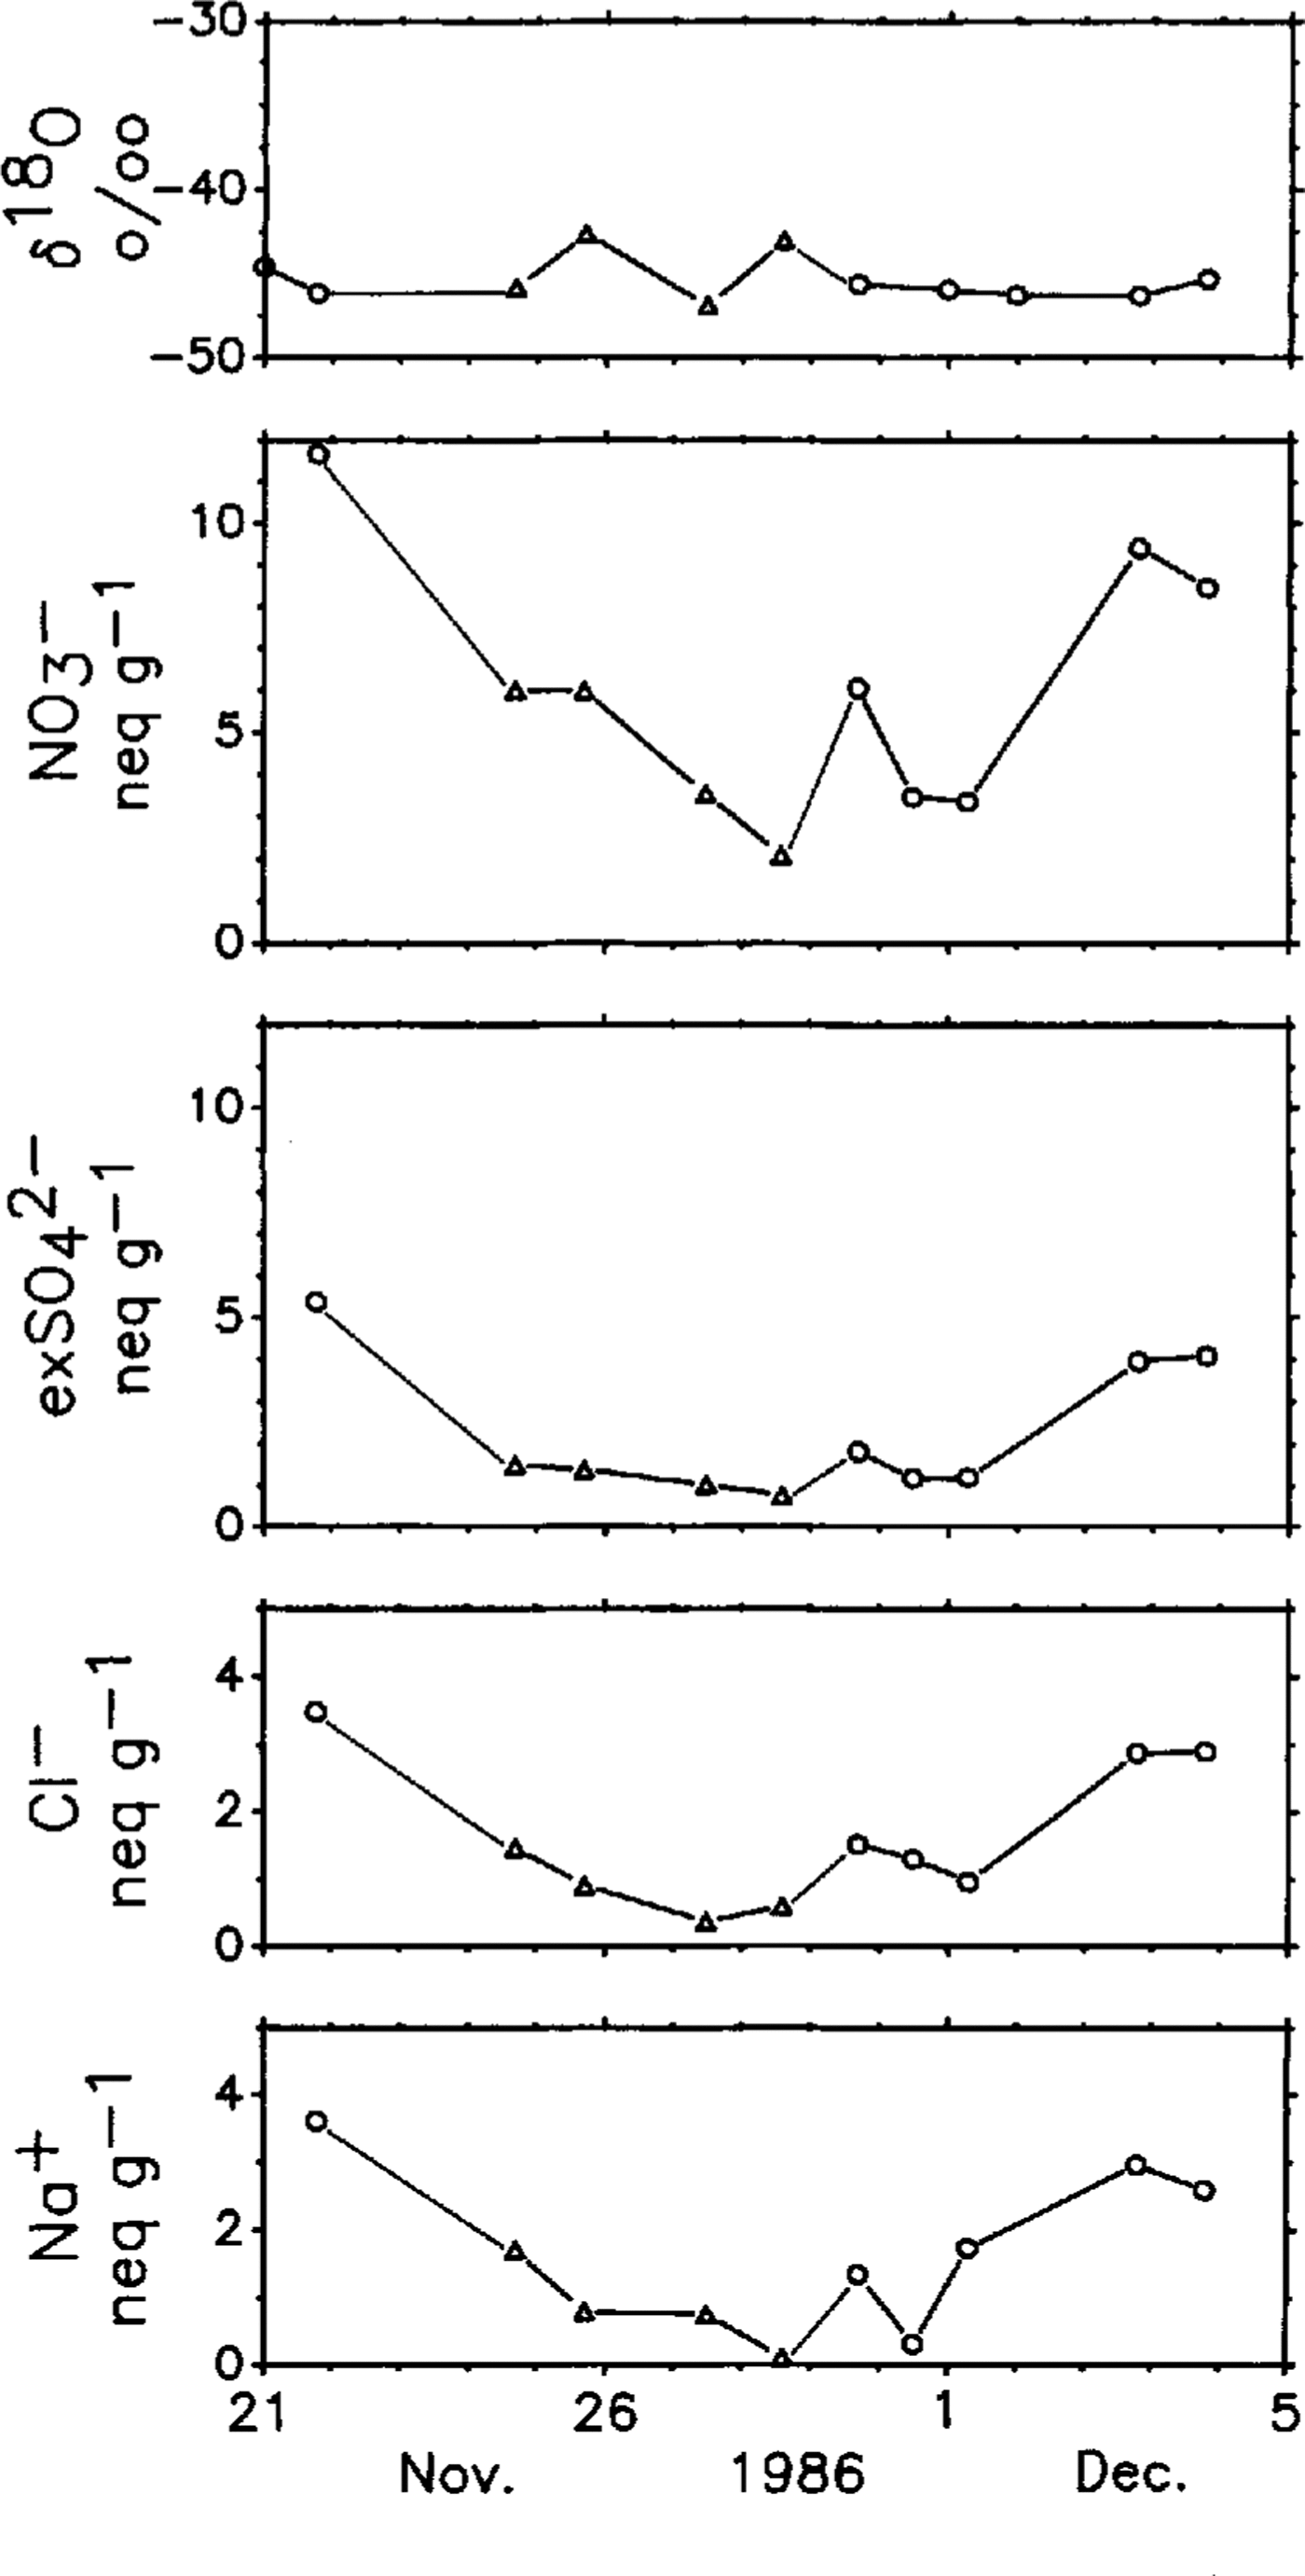
Fig. 5 Same as Figure 4 but collected at G6 glaciological strain-grid station. Triangles and circles represent the same as in Figure 3.
4. Concluding remarks
Despite moving sample locations from Mizuho Station after October, this study shows distinctive seasonal variations for NO3- and excess SO4 2- in drifting-snow samples trapped over cast Dronning Maud Land. General trends and seasonal amplitudes of NO3- and excess SO4 2- are similar to those of reported aerosol studies made at other Antarctic stations near the coast. Details of seasonal variations in NO3- and excess SO4 2- concentrations are different from those found in aerosols at the coastal stations: no small peak in winter for NO3- and a sharp seasonal transition from summer to winter for excess sol in this study. The reason [or the differences remains unexplained but the differences might have resulted from differences in transport processes of atmospheric aerosols and perhaps acidic gases at different regions, and rapid aerosol scavenging by drifting snow.
Short-term (at a time-scale of a few hours to 1 d) variations of ionic concentration levels in the drifting snow samples trapped have also been studied for the summer season. The results show high variability, especially for NO3 and excess SO4 2- within the short-term periods studied. Sampling strategy of drifting and falling snow particles, as well as atmospheric aerosols, needs to consider these significant short-term variations
Acknowledgements
The author wishes to thank Drs F. Nishio and H. Ohmae, members of the 27th Japanese Antarctic Research Expedition (JARE) for helping with sample collections and meteorological observations, and Ms E. Isa,, Ms E. Suzuki and .Mrs T. Kobayashi for their assistance in analytical work. The author is grateful to Drs O. Watanabe, Y. Fujii, Y. Ageta, T. Ohata, S. Kanamori and N. Kanarnori for many useful suggestions during this work.