


Introduction
The Earth’s radiation budget and climate system depend on the amount of energy absorbed at the Earth’s surface (Reference Lemke and SolomonLemke and others, 2007). Snow- and ice-covered areas have a high reflectivity, or so-called albedo, that limits the absorption of solar radiation. Albedo is the percentage of incoming solar radiation (0.1–15 μm) reflected by the Earth’s surface (Reference AhrensAhrens, 1999). The albedo of a snow surface depends on the particle size and shape of snow crystals, the snow density and impurities within a snowpack (Reference Wiscombe and WarrenWiscombe and Warren, 1980; Reference WarrenWarren, 1982). For example, dust and black carbon (BC) can lower the albedo and lead to greater energy absorption (Reference Warren and WiscombeWarren and Wiscombe, 1980; Reference Clarke and NooneClarke and Noone, 1985; Reference Hansen and NazarenkoHansen and Nazarenko, 2004).
BC, in particular, has an amplifying effect on the melt rate of a snowpack as it increases the absorption of solar radiation (Reference Flanner, Zender, Randerson and RaschFlanner and others, 2007). Originating from both natural and anthropogenic combustion sources, BC is typically deposited onto the snow surface through wet or dry deposition. However, knowledge of the primary sources and processes involved in the transport and deposition of BC, its temporal and spatial variability and implications for post-depositional processes within snow are limited. In addition, most studies on spatial variability of BC in snow are limited to snow surveys from the Arctic (e.g. Reference Forsström, Ström, Pedersen, Isaksson and GerlandForsström and others, 2009; Reference Doherty, Warren, Grenfell, Clarke and BrandtDoherty and others, 2010) or temporal variability of BC in snow and ice cores from the Greenland ice sheet (Reference McConnellMcConnell and others, 2007) and the Himalaya (e.g. Reference MingMing and others, 2008; Reference Cong, Kang and QinCong and others, 2009; Reference XuXu and others, 2009; Reference KaspariKaspari and others, 2011; Reference WangWang and others 2012).
Here we present results from a study of the seasonal and interannual variability in elemental carbon (EC) content in a winter snowpack on Storglaciären, northern Sweden. Defined operationally by the analysis technique, EC is generally used synonymously with BC. Both terms refer to the refractory and light-absorbing properties of carbonaceous aerosols. In this paper, we use the term EC, as a thermal/optical method was applied. We study the EC content and its relation to snow physical and geochemical parameters. We compare the snow EC content, physical and geochemical data to meteorological data from two automatic weather stations (AWS), located at the Tarfala Research Station (TRS; 67°55′ N, 188370E; 1135ma.s.l.) and in Katterjokk, provided by the Swedish Meteorological and Hydrological Institute (SMHI) (Fig. 1), in order to identify different snow layers and relate their differences in EC and snow chemistry to regional weather patterns and potential pollution sources. Our hypothesis is that North Atlantic air masses, with a trajectory from the north, northwest or west, contain less EC and are characterized by 18O-enriched precipitation compared to continental air masses from the northeast, east, southeast or south. This is because the industrial pollution load in air masses from eastern Fennoscandia (including nearby Kiruna) and Russia is larger (Reference Hegg, Warren, Grenfell, Doherty, Larson and ClarkeHegg and others, 2009).
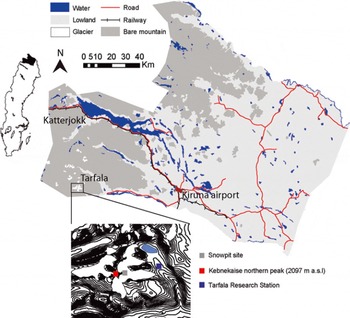
Fig. 1. Map of the study area showing the location of the snow pit on Storglaciären within the Tarfala research catchment and SMHI automatic weather stations near the Tarfala Research Station and Katterjokk in northern Sweden.
Methods
Study site
The sampling site is located on Storglaciären, which is situated in the Tarfala valley, east of Kebnekaise mountain, northern Sweden. The snow-pit site is located at 1520 m a.s.l. (Fig. 1) on a relatively flat part of the Storglaciären accumulation area between the north and south cirques (Fig. 1). The high alpine Tarfala valley is situated in the Scandinavian mountains, a northeast-southwest oriented mountain range that functions as a climate divide between the maritime west and the continental east (Reference Holmlund and JanssonHolmlund and Jansson, 1999). Tarfala valley is characterized by high accumulation rates since the site is relatively sheltered, which reduces mixing in the snowpack and wind transportation. The mean annual temperature at TRS is –3.5°C (1965–2011); the mean annual precipitation measured at TRS is 1997 ± 450 mm a-1 (Reference Dahlke, Lyon, Stedinger, Rosqvist and JanssonDahlke and others, 2012). Most of the winter precipitation originates from North Atlantic air masses during low-pressure passages (Reference Busuioc, Chen and HellstromBusuioc and others, 2001). The highest wind speeds occur when the general (>2000m a.s.l.) wind direction is westerly or northwesterly.
Snow sampling and estimation of snow physical parameters
Snow samples were collected at the end of the accumulation period, in April of 2009, 2010 and 2011. The seasonal snow depth during these years was 285–380cm (Table 1). Snow sampling and measurements of snow physical parameters were performed along the south wall of a pit dug down to the previous summer surface. Data on the EC content, stable water isotopic composition and snow density were available for all three years. Snow sampling to estimate the EC content was conducted at an increment of 50, 9 and 25 cm in 2009, 2010 and 2011, respectively, while snow density was estimated every 25, 3 and 5 cm in these years. Snow samples for stable water isotope analysis were taken every 10, 3 and 5cm in 2009, 2010 and 2011, respectively. In 2009, additional samples for analysis of chloride (Cl−), sulfate (SO4 2–) and nitrate (NO3 −) concentrations were taken at a sample resolution of 10cm. In 2010, additional snow physical parameters (e.g. snow temperature, permittivity, stratigraphy and snow particle size) were determined. On site, a PT100 instrument was used to register the snow temperature; the snow density was estimated based on the volume and weight of each sample and also using a TOIKKA AS snow fork to determine the density and permittivity of the snowpack (Reference Sihvola and TiuriShivola and Tiuri, 1986). The stratigraphy was described and the snow particle size was determined using the digital snow particle property (DSPP) method (Reference Ingvander, Johansson, Jansson and PetterssonIngvander and others, 2012).
Table 1. Summary of the sampling campaigns at the snow-pit site (Fig. 1) and the average soot content, mean δ18O isotopic composition and mean density for each year
For chemical and isotope analysis, snow samples were stored hermetically in plastic bags until laboratory analysis on the same day at TRS. Samples for analysis of the isotopic composition and Cl−, SO4 2– and NO3 − concentrations were slowly melted in the sealed plastic bags at 4°C at TRS. Snowmelt water was bottled in 50 mL HDPE bottles with poly-seal caps until laboratory analysis at Stockholm University. Samples were analyzed for 18O/16O ratio and 2H/1H content (expressed as δ18O and δd) using a laser absorption spectrometer (Liquid-Water Isotope Analyzer DLT-100, Los Gatos Research Inc., Mountain View, CA, USA) with a precision of 0.15% and 0.6% for δ18O and δd, respectively. These δ18O and δd contents are reported in per mil relative to Vienna Standard Mean Ocean Water (VSMOW). Analysis of Cl−, SO4 2– and NO3 − concentrations was performed using a Dionex IC25 ion chromatograph at Stockholm University. Snow samples for the EC analysis were extracted from the snow pit and kept frozen until filtration. The snow was melted in a glass jar in a microwave oven and filtered through a microquartz filter according to the methods of Reference Forsström, Ström, Pedersen, Isaksson and GerlandForsstrom and others (2009) and Reference Aamaas, Bøggild, Stordal, Berntsen, Holmén and StromAamaas and others (2011). Dried filters were analyzed in a Thermal/Optical Carbon Aerosol Analyzer (OCEC). Detailed descriptions of the instrument and the analysis protocol (EU-SAAR_2) are given by Reference Birch and CaryBirch and Cary (1996) and Reference Cavalli, Viana, Yttri, Genberg and PutaudCavalli and others (2010), respectively.
Using the filtration method introduces an underestimate of the EC concentration in the snow sample, as some particles may percolate through the filter and not be accounted for during OCEC analysis. This filtering deficiency, also known as undercatch, has been proposed to be in the order of 15–50% (Reference Ogren, Charlson and GroblickiOgren and others, 1983; Reference Doherty, Warren, Grenfell, Clarke and BrandtDoherty and others, 2010) depending on the type of filter used. In this paper, undercatch was measured by having two filters on top of each other during filtration. For the subset of 14 samples to which this evaluation was applied, an undercatch of roughly 50% existed. This is probably a high estimate, as Reference Aamaas, Bøggild, Stordal, Berntsen, Holmén and StromAamaas and others (2011) had a much lower undercatch (undetectable amounts) when using identical filters. Further experiments are needed before solid conclusions on undercatch for microquartz filters can be drawn. It does, however, provide insight into the uncertainty and underestimation present in our EC dataset.
Another possible loss of EC particles using the filter method is by particles attaching to the glass walls of jars used to melt the snow sample (Reference Ogren, Charlson and GroblickiOgren and others, 1983; Reference Clarke and NooneClarke and Noone, 1985). This was investigated by Reference Forsström, Ström, Pedersen, Isaksson and GerlandForsstrom and others (2009) who concluded that EC particles were lost when a liquid sample was stored for longer than 1.5 days in a glass jar. This was not the case for any of the samples filtered in this study.
Meteorological and snow accumulation data
The meteorological parameters wind speed, wind direction and air temperature, available with a temporal resolution of 10 min, were used. They were recorded at an AWS located near TRS ∼3 km east of the snow pit at 1150ma.s.l. (67°54′44′′ N, 18°36′46′′E) and are provided by SMHI. In order to better estimate the regional meteorological conditions during the study period, we included additional meteorological data from an SMHI weather station situated in Katterjokk near Abisko (68°21′N, 18°1′′E; 500ma.s.l.). We used meteorological data collected during the snow accumulation season (SAS; Reference Shulski and SeeleyShulski and others, 2004), the period when temperature is continuously negative and precipitation therefore falls as snow. In addition, we used the SMHI definition of the onset of winter as the first day of a 5 day period with daily mean air temperatures at or below 0°C. Similarly the end of winter was determined as the first day of a 5 day period with the mean air temperature above 0°C. We further divided the SAS into four periods (SAS1: start of SAS to October; SAS2: November–December; SAS3: January–February; and SAS4: March to end of SAS). SAS1 and SAS4 vary in length since the total season length differs over time (Table 1). Snow accumulation was estimated based on precipitation data (mm h−1) available from Katterjokk AWS and provided by SMHI. Winter precipitation data were not available for Tarfala AWS.
Results
Meteorological conditions and snow accumulation
The mean winter temperature decreased over the 2009–11 study period (Table 2). Figure 2 shows the wind speed and wind direction for both the Tarfala and Katterjokk AWS. Wind speeds measured at Tarfala and Katterjokk were similar during the SAS1–2 periods during all three years. However, in 2009 the wind speed observed at Katterjokk was three times smaller than recorded at Tarfala. Over the study period, the highest wind speeds were observed at Tarfala in the first part of winter 2009 (SAS1–2). In 2010 and 2011, wind speeds were consistently lower in late winter (SAS3–4). The predominant wind direction observed at Tarfala was west-northwest to northwest during all SAS periods and years. Wind directions recorded at Katterjokk showed a greater range, reflecting that station‘s more open setting (Fig. 2).
Table 2. Snow accumulation season (SAS) divided into four periods based on time of year: SAS1: start of SAS to October; SAS2: November–December; SAS3: January–February; and SAS4: March to end of SAS. The table shows the dates of each SAS, the mean temperature, wind speed and major wind direction during the SAS periods

Fig. 2. The major wind directions measured at Tarfala AWS (a) and Katterjokk (b) in 2009, 2010 and 2011. Data are shown for the following snow accumulation seasons: SAS1 (start of SAS to October), SAS2 (November–December), SAS3 (January–February) and SAS4 (March to end of SAS). The wind direction is indicated by the direction of each spoke; the wind speed is indicated by the length and color of each spoke emanating from the center of the circle.
The bulk snow accumulation on Storglaciären during the 2009, 2010 and 2011 winters was 390, 300 and 268 cm, respectively. However, in all three years the majority of snow was accumulated in SAS3 (January–February). These values compare to a total winter mass balance of 2.02, 0.91 and 1.32 mw.e. for 2009, 2010 and 2011, respectively. The mean snow density decreased from 0.45 gcm−3 to 0.36 gcm−3 over the 3 year sampling period (Table 1; Fig. 2). The decrease in snow accumulation rate at Tarfala from 2009 to 2011 is consistent with precipitation amounts recorded at Katterjokk, which showed a decrease in total snow accumulation for the SAS from 2009 to 2011 (Fig. 3).
Fig. 3. Snow accumulation measured at Katterjokk AWS for SAS1–4, 2009–11.
Snow chemistry
During the 2009–11 study period, the bulk EC content varied between 0 and 30.4 mgL−1. However, the average EC content decreased from 15.3 to 6.9 μg L−1. As indicated by the standard deviation, 2011 showed the smallest variability in EC content within the snowpack. In 2009, higher EC concentrations were measured in the upper part (upper 150 cm) of the snowpack, while in 2010 and 2011 higher EC concentrations were observed in the lower part (Fig. 4). The relatively high EC contents at the base of the 2009 and 2010 snowpack suggest that mixing occurred between the early-winter snow and the previous summer surface, which is typically characterized by high EC content due to continuous deposition of soot over the summer (Reference Xu, Cao, Joswiak, Liu, Zhao and HeXu and others, 2012).
Fig. 4. Density (gcm−3), isotopic composition (δ18O; %) and EC concentrations (μg L−1) in the snow pit in (a) 2009 (b) 2010 and (c) 2011. The density analysis is performed using 25 cm increments in 2009, 3 cm in 2010 and 5 cm in 2011. The isotope analysis is performed with 10cm increments in 2009, 3 cm in 2010 and 5 cm in 2011. The BC samples are analyzed with 50 cm increments in 2009, 8cm in 2010 and 25 cm in 2011.
Snow δ18O ratios varied between –9.68% and –25.56% over the study period. The snowpack weighted mean average δ18O value for 2009, 2010 and 2011 was –14.9%, –15.1% and –16.1%, respectively, indicating that the snowpack became isotopically more depleted from 2009 to 2011 (Table 1). In comparison, the 1961–90 long-term average δ18O value measured in precipitation in Kiruna was –15.7% (GNIP (global network for isotopes in precipitation) database 2012). However, variability in δ18O ratios was greatest in 2010, when four events with decreased δ18O values can clearly be identified (Fig. 4).
A comparison of the δ18O ratios with the EC content in the 2010 snowpack shows that snow layers depleted in heavy isotopes coincided with layers showing elevated EC contents. This pattern can also be detected in the 2009 and 2011 profiles, but is less pronounced due to the lower sample resolution (especially in 2009). The Cl−, SO4 2– and NO3 − concentrations measured in the 2009 snowpack ranged between 0.047 and 4.57, 0.058 and 0.611, and 0.059 and 0.61 mgL−1, respectively. High Cl− and SO4 2– concentrations occurred at 365, 265 and 185 cm depth and coincided with snow layers enriched in heavy isotopes but with low EC content (Fig. 5). As shown in Figure 6, the variability in snow density, conductivity and the presence of ice layers in the 2010 snowpack resemble the variation in EC content. For example, the higher EC content observed at 240cm depth coincided with an ice layer.
Fig. 5. The δ 18O stratigraphy in the snowpack in 10cm increments correlated to the chemical elements in the snowpack: chloride (Cl), sulfate (SO42∼ and nitrous oxide (NO3).
Fig. 6. Physical parameters retrieved from the snow pit in 2010: (a) temperature sampled by PT100; (b) density sampled manually by weighing samples with 3 cm increments (solid line) and using the snow fork with 3 cm resolution (dots); (c) electrical conductivity measurements using the snow fork with 3 cm resolution; (d) stratigraphy based on manual observation and (e) the particle sizes determined using the DSPP method (Reference Ingvander, Johansson, Jansson and PetterssonIngvander and others, 2012); and (f) EC sampled with 8cm increments and analyzed in the OCEC instrument, and the concentrations calculated based on the sample volume.
Discussion
Several processes are involved in the deposition of EC onto a snowpack surface. EC particles can either be directly deposited onto the snow surface via dry deposition (Reference Hansen and NazarenkoHansen and others, 2004) or washed out from the atmosphere (scavenged) with precipitation (Reference Warren and ClarkeWarren and Clarke, 1990; Reference Hadley, Corrigan, Kirchstetter, Cliff and RamanathanHadley and others, 2010; Reference Schwikowski, Eichler and BundiSchwikowski and Eichler, 2010). Since EC particles can act as nuclei in cloud formation they can be deposited as part of the snow accumulation (Reference JacobsonJacobson, 2006). As shown in Figure 4, the 2010 and 2011 snowpacks showed higher EC content in the lower 100–150 cm, while the 2009 snowpack showed higher EC content in the uppermost 150 cm of the snowpack. The early-winter season was windier in 2009 than in 2010 and 2011 (Fig. 2a and b), suggesting that EC deposition shown by concentration does not primarily occur during events with high wind speeds. As higher wind speeds are usually associated with passages of North Atlantic weather systems, this implies that air masses originating from the North Atlantic deposit less EC than Arctic or continental air masses.
Variability in δ18O can be used to infer different precipitation events with different precipitation sources within a snowpack (Reference Sinclair and MarshallSinclair and Marshall, 2009; Reference Lafrenière and SinclairLafrenière and Sinclair, 2011). This is because the δ18O ratio of precipitation depends on the condensation temperature (the lower the temperature, the more depleted the snow in heavy isotopes) and the source and trajectory of the air masses. For example, precipitation originating from the North Atlantic (i.e. maritime source) is typically more enriched in 18O compared to air masses from the north (i.e. arctic regions) or continental east (Reference Bowen and WilkinsonBowen and Wilkinson, 2002). During the study period the mean weighted average δ18O of the snowpack became isotopically more depleted, which could reflect the lower winter air temperatures observed in 2010 and 2011. However, when comparing EC content to the isotopic composition within each profile, a switch in the correspondence of both parameters is apparent. In the upper parts of all three snowpacks, snow layers depleted in heavy isotopes coincided predominantly with high EC contents, while, in the lower parts, snow layers enriched in heavy isotopes coincided with high EC contents. This dynamic suggests that isotopic redistribution and fractionation has occurred in the snowpacks, as reflected by the general increase in δ18O when moving from the surface to the bottom of the snowpack. This discrepancy in the correspondence between δ18O and EC content, especially in the lower parts of the snowpack, might be caused by the enrichment in heavy isotopes within the profile due to sublimation/evaporation or transport of lighter isotopes by meltwater within the profiles, while the EC particles remained immobile. However, it can be speculated that some of the 18O enrichment in the lower parts of the snowpacks might be accelerated by the higher EC contents, leading to increased absorption of solar radiation and hence increased warming of the snowpack. In contrast, the correspondence of snow layers depleted in heavy isotopes in the upper parts of the snowpacks with layers characterized by high EC contents suggests that air masses originating from the north, northeast, east and southeast, which are typically more depleted in heavy isotopes, contain greater EC loads. This is expected, as the potential sources of EC (e.g. the industrial area of Kiruna) are located along the trajectories of air masses from these directions.
These results can be further corroborated with the Cl−, SO4 2– and NO3 − concentrations measured within the 2009 snowpack. In 2009 we noted three events where concentrations of both Cl− and SO4 2– were increased, suggesting that precipitation had a strong oceanic, i.e. North Atlantic, imprint (Reference Lafrenière and SinclairLafrenière and Sinclair, 2011). Air masses originating from oceanic sources can have high concentrations of Cl−, which is produced from ocean spray that acts as nucleation source in precipitation build-up (Reference Davidson, Harrington, Stephenson, Small, Boscoe and GandleyDavidson and others, 1989). In contrast, SO4 2– can have multiple sources such as sea spray, volcanic gases, biological decay or human activity (Reference Delmas and BoutronDelmas and Boutron, 1978). Since it peaked at the same depth as Cl− in our analysis, we assume that it is of oceanic origin. This is corroborated by the δ18O ratios observed during these events. As expected, snow layers characterized by high chloride and sulfate concentrations coincided with snow layers enriched in 1 8O, which confirms a North Atlantic source of the precipitation (or a relatively warmer air mass).
The observed isotopic, geochemical and EC data suggest potential post-depositional changes in EC concentrations in the snow. For example, in the 2010 snowpack an ice layer was detected at the same depth (240 cm) as a snow layer with increased EC content (Fig. 4). An explanation for the development of this ice layer could be a precipitation event with rain (with a high EC content) or a melt event concentrating EC. Another explanation could be that high wind speeds compacted the snow and created a glazed surface (ice surface), compacted the snow particles and thereby led to an increase in EC content (Reference Jaedicke, Thiis, Bank, Hjorth-Hansen, Holand, Loset and NoremJaedicke and others, 2000). Larger particle sizes would be reflected by increased density in the snowpack. Increased amounts of EC in the snow could induce immediate melt in the snowpack by absorbing greater amounts of solar radiation or ground heat flux (Reference Clarke and NooneClarke and Noone, 1985; Reference Grenfell, Warren and MullenGrenfell and others, 1994). The induced melt would result in larger snow particles within the snowpack due to mobility of moist air or water, which is visible both in the stratigraphy of the snowpack and the snow particle sizes shown in Figure 4.
Conclusions
We have presented a comparative analysis of the variability in EC, stable water isotopic composition and snow physical parameters in a winter snowpack on Storglaciären over 3 years (2009–11). The isotopic and geochemical data in each snowpack were compared to meteorological parameters in order to relate the seasonal variation in EC to specific snow accumulation events and atmospheric sources of EC. The bulk EC content and weighted mean δ18O values in the snowpack on Storglaciären decreased over the 3 year study period. However, the distribution of BC in the snowpack varied between years. The 2009 snowpack showed higher EC content in the upper half of the profile, while the 2010 and 2011 profiles showed higher EC content in the lower half. When EC content was compared to isotopic composition within each profile, a switch in the correspondence of both parameters was apparent. In the upper parts of all three snowpacks, snow layers depleted in heavy isotopes coincided predominantly with high EC contents, while in the lower parts snow layers enriched in heavy isotopes coincided with high EC contents. This switch can be attributed to isotopic redistribution and fractionation within the snow-pack, which causes enrichment in heavy isotopes in the lower parts of the snowpack. However, the geochemical data in the upper parts of the snowpacks, in conjunction with the meteorological data, indicate that snow layers with low EC content corresponded to high chloride and sulfate concentrations and increased δ18O values, suggesting that snow deposited during these events had a strong oceanic, i.e. North Atlantic, imprint. Thus our results support our hypothesis that the EC load is lower in North Atlantic air masses from the north, northwest and west, compared to continental air masses from the northeast, east, southeast or south.
Acknowledgements
This research was partially financed by Metsä Tissue AB environmental research, the Tarfala Research Station, the Department of Physical Geography and Quaternary Geology, Stockholm University, and the Bergström Foundation. We acknowledge the staff who worked in the field retrieving samples, and in the laboratory analyzing EC and chemistry samples.


