


Introduction
Modelling the flow of ice sheets and relating this to the observed ice fabrics is hampered by our limited knowledge of the stress variation within the ice mass. In this paper we will discuss the possibility that stress concentrations occurring within the bulk of the ice may induce both brittle and ductile flow, causing local ice strains to be higher and concentrated within zones of localized flow or shear zones. The effect of stress concentrations, caused by bedrock perturbations, could contribute to an effective reduction in ice ductility at varying heights within the ice column and these would be superimposed on the general down-slope movement of the ice mass.

Fig. 1. Locality map of Law Dame, East Antarctica. The area of the study is along a flowline al the coastal end of the triangle from the Dome Summit to near Cape Folger and Casey Station. The height contours are in metres.
Local velocity and strain rate increases within the mobile part of an ice sheet have been reported by Whillans and others (1987), with a transition from ice-sheet flow to a non-steady-state ice-stream flow, and they attributed this action to stress concentrations caused by bedrock perturbations. In the theory presented by McMeeking and Johnson (1986), stress discontinuities at the base of the ice, at the bedrock interface, cause propagation of stress risers within the ice mass as a consequence of surging flow. Similar analyses have been made by Hutter and Olunloyo (1981), who identified stress concentrations at the ice-sliding interfaces, close to the bedrock, that can be related to deformation anomalies in the ice mass. However, in contradiction to this idea, Budd (1971) and Budd and Carter (1971) concluded that stress risers are related to particular bedrock wavelengths which were damped differentially. However, in this paper it is suggested that two different mechanisms are operative, one being a bedrock-induced perturbation and the other being a bifurcation phenomenon induced by longitudinal compressive stress associated with the down-slope movement of the ice mass.
Law Dome Study Area
In 1972, the ANARE thermal drill was set up at Cape Poinsett in eastern Antarctica, on the eastern side of Law Dome, to drill to bedrock (Fig. 1). At this location, drilling proceeded to 180 m in the 280 m thick ice sheet and the drill was raised to the surface to retrieve ice cores. The drill cabin was then subjected to a severe jolt. It was apparent, from the movement experienced by the drill cabin, that the ice below had moved. The drill was again lowered into the borehole and it was impossible to reach the depth previously achieved. The ice had sheared at the former position of the ice drill at a depth of 180 m. This observation suggests that stress and accompanying strain localization is occurring in the Law Dome ice sheet at depths considerably higher than the bedrock and is compatible with the results to be presented in this paper.
Previous models for the Law Dome ice mass have assumed a progressive dynamic flow where the ice mass remains in contact with its accumulation area and deforms under its own weight (Russell-Head and Budd, 1979; Budd and Jacka, 1989). The models assume that ice deformation and strain occur uniformly and little account has been taken of the possibility that ice may deform as discontinuous steps involving strain localization, as in a thrust sheet (Lawson and others, 1994). In order to analyse quantitatively the flow on Law Dome (Fig. 1), a section parallel to the general flow line (MacLaren, 1968; Etheridge, 1989) from strain grid D to strain grid A was investigated. In this paper, we are concerned with the plane strain (two-dimensional) deformation along a 16 km section, extending from the 97 km marker on the Law Dome triangle (strain grid “D”) to the 113 km marker and included an area with four boreholes, A. BHC1, BHC2 and D (Russell-Head and Budd, 1979). The profile was derived from optical survey measurements of the air–ice surface and radio-echo sounding to the bedrock.
Finite-Element Analysis
The two-dimensional finite-element model along a flow-line described in this paper examines the stress and strain-rate fields and investigates the movement of the ice sheet over an irregular bedrock profile. The two-dimensional plane-strain finite-element program used (Rowden-Rich, 1993) was developed from the NTJTEP program (Chang and Nair, 1973; Coulthard, 1982) and incorporates velocity data from surface-strain measurements and shear-deformation rates inferred from borehole inclinometry (Thwaites and others, 1984; Etheridge, 1989). The code used a four-noded crossed quadrilateral element and was modified to incorporate Glen’s (1955) non-linear power law with an exponent of 3. The model was constructed with layers of equivalent temperature and isotherms, based on observed temperature profiles (Budd and others, 1976), that were related to the mesh geometry with the ice ductility differentiated in the vertical direction.
A major difficulty in prescribing a numerical model is the scarcity of data available on sliding at the ice–rock interface and the selection of an appropriate sliding law. To undertake this study it was assumed that the constitutive behaviour of the ice can be described by a simple Mohr–Coulomb-like rate-independent dry-friction law and typical stillness values ascribed to the basal element were developed by an iterative procedure simulating the inferred boundary conditions for the sliding velocity (Rowden-Rich, 1993). Elastico-viscous displacements were mapped and related to the elastico-viscous velocities; hence there is a time factor involved in this process. The surface displacement is related to the field measured velocity and the basal displacement, from the stress maps, and this is related to a sliding velocity. The shear-stiffness parameter is chosen to give the appropriate velocity, not static resistance. However, the computer-derived sliding velocities at the ice–bedrock interface exhibited a distinctly stick–slip pattern. Hence, the precise nature of the deformation, in the lower part of the ice profile, is considered to be very significant to the total description of the flow of the ice mass.
The boundary conditions prescribed for the model are of three kinds: (1) velocities of 12 m a−1 at the upstream surface, (2) hydrostatic pressures on the downstream vertical-element boundaries and (3) a shear-strength parameter needed by the Mohr Coulomb law at the ice bedrock interface. The ice-surface pressure is atmospheric and each element was subject to a body force of gravity; but factors for ablation and accumulation were not incorporated. These boundary conditions set up with an internal constitutive relation in terms of the stress and strain rate within each element thus enables the velocities at all the other nodes (vertical and horizontally to be determined with the plane-strain stress components. An iterative procedure was used to compute the velocities (Rowden-Rich, 1993) at each node vertically below the upstream surface node using parallel-slab theory for a non-Newtonian flow law.
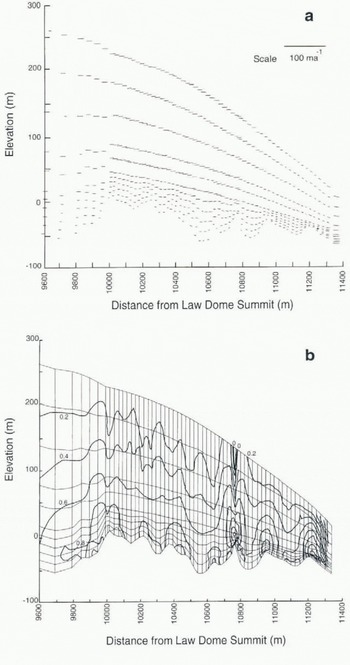
Fig. 2. The rough terrain model applied to a 16 km section, (a) Velocity (m a−1). Note that the greatest velocity vectors are of the order of 9 m a−1. (b) Horizontal shear stress, τxz, (MPa). The faint lines indicate the finite-element mesh contours. The model results indicate an ascent of the peak shear stress within the ice mass to a location above the bedrock. This particular model indicates a peak at approximately one-quarter of the ice-column height.

Fig. 3. The principal stress orientatian of each element for the model across one bedrock riser over a distance of 900 m. The oscillation of this principal stress in direction which occurs progressively with glacier movement over a bedrock riser is clearly depicted. This oscillation in stress is likely to accelerate the development of anisotropy and preferred crystallographic orientations within the ice mass. This pattern is reinforced as each bedrock perturbation is encountered in slow glacier flow. Foliation in shear lenses is propagated downstream progressively. The slow coalescence of these shear lenses in time is highly likely to initiate fast motion, or surging in temperate glaciers, or ice streams in polar ice sheets.
The mesh elements were quadrilateral in shape and were tested in the manner described by Nagtegaal and others (1974). The sliding boundary was dealt with by forcing the vertical thickness of the quadrilateral at the extra element inserted at the boundary to a zero dimension. The coding ensured that no singularities occurred in this case. A shear-stiffness parameter was assigned to the special case of the quadrilateral boundary element with prescribed values that result in an appropriate ice bedrock sliding velocity (Rowden-Rich, 1993). This value was 3 m a−1 at the extreme upstream node of the model, a value of sliding velocity inferred from borehole inclinometry (Etheridge, 1989).
The rough terrain series of models (Fig. 2) was based on the assumption of stress- and temperature-dependence for the ice properties used in determining dynamic flow. The initial models were constructed with parallel slabs on an inclined bedrock with both planar or sinusoidal bedrock profiles. Perturbations in the velocity of the upstream parallel slab did not vary the results in the main part of the model. Each time the upstream slope was changed, the approximate steady-state velocity was determined by iteration. Approximately 20% variation in velocity was caused by a 10% variation in bed slope. Steady state was arrived at within approximately five mesh columns from the location of the appended upstream parallel slab, provided the prescribed velocities were within 5% of the true value. It was concluded from this sensitivity study that oscillations in the shear-stress values were caused by bedrock perturbations.
A second series of models of the ice mass (Figs 3–5) divided vertically and horizontall) into more elements over a shorter section of Law Dome, in comparison to the rough terrain model, was then tested. The ice mass (Thwaites and others, 1984) changed in flow-rate factors from a stiff ice at the atmospheric surface to a more ductile ice at the bedrock interface. In the models, this was described by defining a range of viscosities, for a normalized stress and strain rate, with values varying from 16.3 × 10¹³ SI units for the highest layer to 5.7 × 10¹³ SI units for the basal layer. These values of viscosity were obtained from the flow parameter (Paterson, 1994) using a set of experimentally derived stress or strain rates (Budd and Jacka, 1989). As each element was calculated, the viscosity was adjusted by the computer program in accord with Glen’s (1955) flow law. This procedure allowed a matching of isotherms (Rowden-Rich, 1993) with elements of the model and simulation of stress and strain-rate fields, for the conditions in the ice sheet where zones of enhanced deformation were observed.
The velocity values calculated at the nodes and the computed profile correspond broadly with the field-derived velocities from borehole inclinometry. Similarly, the pattern identified in the previous series of models, namely an intensity of stress increases above the bedrock, at the location of the crest, was demonstrated to be independent of changes in mesh spacing. The greater subdivision of the mesh geometry in this second series follows the bedrock and thermal profiles more closely and this procedure also enabled more accurate ice-flow-rate parameters to be defined and allowed a better assessment of principal stress distribution (Fig. 3).

Fig. 4. Contours of the parameter λ over a 900 m section that includes a bedrock riser. The values of the principal shear stresses, σ1, σ2, σ3 and the parameter λ are defined within the figure. The contours indicate a pattern of stress associated with the bedrock crest.
Effect of Bedrock Topography on ICE Flow
The results of the two-dimensional computer models delineate regions of high velocity and stress gradients accompanied by significant changes in the orientation of the stress field that is related to the nature of ice flow. The results also infer that migration of discontinuities at the ice–bedrock interface progress upward in the ice column as the ice moves slowly forward. The following observations are made of the models:
-
1. The velocity vectors obtained (Fig. 2a) allow path lines for the flow of the ice mass over a series of bedrock risers to be estimated. The ice flow in the trough above 97 km is approximately horizontal. The flow in other troughs is similar but the ice appears to slide over the troughs in the lower part of the ice sheet, that is making the ice within these trough zones immobile. The velocity vectors in the lower part of the ice sheet are damped and do not follow the bedrock perturbations in either amplitude or wavelength.
-
2. The velocity vectors (Fig. 2a) in the top half of the ice mass do not follow the slope of the ice surface. The vectors suggest there is an oscillation in the direction of velocity at the risers for almost the entire height of the ice column in zones ahead and behind the bedrock riser. The crossing of the ice surface by the velocity vectors suggests ablation would have to occur downstream at Cape Folger (Fig. 1).
-
3. The shear deformation in the lowest zone of the ice profile within 5 m of the ice–rock interface was found to be approximately 2 m a−1 [Fig. 2a). This shear deformation combined with the sliding velocity accounts for approximately 50% of the total shear deformation of the entire ice column.
-
4. The most significant result was the occurrence of a zone of high shear stress within the body of the ice mass and at a height above the base of the bedrock. Coincidental with this shear zone there occurs a zone of stress relaxation and reversal of principal stress direction downstream of the bedrock riser; also an oscillation of the stress magnitude immediately in the lee of the riser.
-
5. Contours of the horizontal shear-stress component (σ xz ) indicate pronounced anomalies are formed by the movement of ice over the bedrock risers (Fig. 2b). These anomalies are associated with corresponding reductions of stress at the troughs, above and below the riser. Stress, as would be expected, increases from the ice surface, where it is negligible, to higher stresses as the bedrock is approached. In the 24 km section parallel to the flowline, there are two occurrences of isolated stress increases occurring at significant heights upward into the ice column.
-
6. There is a marked oscillation in the orientation of the principal stress as the ice flows over an individual bedrock riser (Fig. 3). This is more pronounced ahead of the bedrock riser and constant orientations are reached at a distance downstream of the bedrock riser.
-
7. The plot of the parameter, λ, defined in Figure 4, indicates the distribution of stress in the ice developed adjacent to the bedrock riser. The remarkable feature of Figure 4 is the upward and upstream trailing of the contours of λ, almost exactly from the point of the crest of the bedrock.
-
8. Two zones of higher shear stress occur, propagating upstream and downstream from geometric perturbations in the bedrock, where the ice moves over an irregular bedrock perturbation (Fig. 5).
-
9. The plots of principal shear stress component (Fig. 5) indicate two loci of stress maxima inclined to the horizontal, extending upstream and downstream from the crest of the bedrock riser. At these elements of peak stress, the principal stress orientations (Fig. 3) oscillate by up to 30°. These areas of high differential stress define macroscopic zones that are favourable positions for the development of zones of higher shear strain rates and thrust-related structures.

Fig. 5. Trace of peak principal stress within a 900 m section of the ice mass at a bedrock riser. Note that the two traces, upward of the bedrock riser, extend from the point of the crest, one trace extending almost in a straight line upstream, the other trace curving downstream. The traces are drawn by identifying the two points within each horizontal layer of the mesh, upstream and downstream of the crest point, which are subjected to peak stress. (Note that the study originally was parameterized in terms of the C.G.S. units of bar. 1 bar = 105, N m −2, 1 MPa = 106 N m−2, the SI units.)
Relationship to ICE Textures
Changes in the ice fabrics have been noted in many of the cores obtained from Law Dome. In the upper part of the ice (Russell-Head and Budd, 1979), there are equilibrium crystal microstructures with small-circle girdle patterns indicating significant vertical compaction. However, at depth there are anomalies in the fabric and microstructure that are attributed to a component of shear (Budd and Jacka, 1989; Jacka and Gao, 1989). In drill holes BHC1 and BHC2, Thwaites and others (1984) recognized two zones of anomalous fabric development that could be identified by their prominent single-maxima c-axis fabric and a marked grain-size reduction which they equated with high strain zones, possibly comparable to mylonite zones recognized in quartzose rocks. Similarly, there is a marked reduction and elongation in the air bubbles in the Law Dome ice that corresponds to the zones of high shear strain (Russell-Head, 1982).
The drop in peak shear stress and the small velocity vectors that occur after movement of the ice over the bedrock riser (Fig. 2a) would explain the weak fabrics and coarse ice types described from within the bedrock hollows described by Thwaites and others (1984). This would be a zone of low strain, essentially a region where decompression of the ice takes place and this would produce the coarse-grained, multiple-maxima, unoriented fabrics.
The computed zone of high shear stress that propagates upstream from the bedrock riser (Fig. 4) would intersect the ice column drilled in BHC 1 between approximately 100 and 200 m below the ice surface. It is in this area that the principal stress intensifies (Fig. 3) and this corresponds to the area that Thwaites and others (1984) described as being characterized by a vertical, single-point maximum c-axis fabric. It also contains domainal c-axis concentrations about the horizontal that can be related to very localized higher borehole closure which has been attributed to easy glide in the ice crystals (Thwaites and others, 1984). This would be a zone of high strain where the ice would have a grain shape and orientation consistent with the extension direction of the deformation.
In the low-closure zones, there are tabular grains elongated parallel to the flow plane with smaller grain-sizes and a concentration of caxes towards the vertical, that is the basal planes are aligned sub-horizontally. Ice with such a microfabric would be suitably oriented for easy glide in a simple shear deformation and it would be these grains that undergo extensive grain-boundary migration and recrystallization (Wilson and Zhang, 1994). When the direction of principal shear stress is coincident with the plane of easy glide on the basal plane of the ice crystals, slip will be activated.
Conclusions
The numerical model used in this paper suggests that a zone of high stress exists above the crest of a bedrock riser and would be superimposed on the general downslope movement of the Law Dome ice cap. Likewise there is a relaxation of stress, downstream of a perturbation, to as low as 0.06 MPa (0.6 bar). The stress behaviour described in our models fits the hypothesis that rapid ice movement is related to the formation of localized shear zones trailing slightly upwards and downhill of the bedrock risers. A small reduction of ductility in a shear zone could induce strain localization and this would correspond to the thrusts and extensional features that are developed in a typical surging glacier (Lawson and others, 1994).
Similarly, the localization of the shear stress by perturbations in the bedrock along the entire length of travel of the ice cap would progressively contribute to the process of local stress-induced enhancement of the fabric. Such perturbations in crystallographic structure would immediately attract a localized incompatibility of strain across grain boundaries with the creation of significant stresses and a tendency to locally reconstruct the grain matrix and this can lead to sites of preferential recrystallization and even melting, and suggests a possible reason for the occurrence of layers characterized by marked grain shape and fabric anisotropy within the ice cap.
Acknowledgements
Support and use of facilities provided by the School of Earth Sciences, University of Melbourne, is gratefully acknowledged. W. F. Budd, T. H. Jacka, I. Allison and R. C. Lile and other members of the Australian Antarctic Division’s Glaciology Group are thanked for their discussions and assistance during the progress of this work. C. Schott-Hvidberg and H. Gudmundsson are thanked for constructive reviews which, together with comments from W. F. Budd and R. Hindmarsh, greatly improved and shortened the final version of the manuscript.


