


INTRODUCTION
In Alpine basins, liquid water may be stored in the ground, in vegetation, in snowpack and glaciers, in rivers, lakes and reservoirs, and to a negligible amount in the atmosphere. In this study, we calculate the amount of liquid water storage (LWS) in 86 basins and sub-basins in the Tyrolean Alps between 10 and 13°E and 46.5 and 47.5° North (Fig. 1).
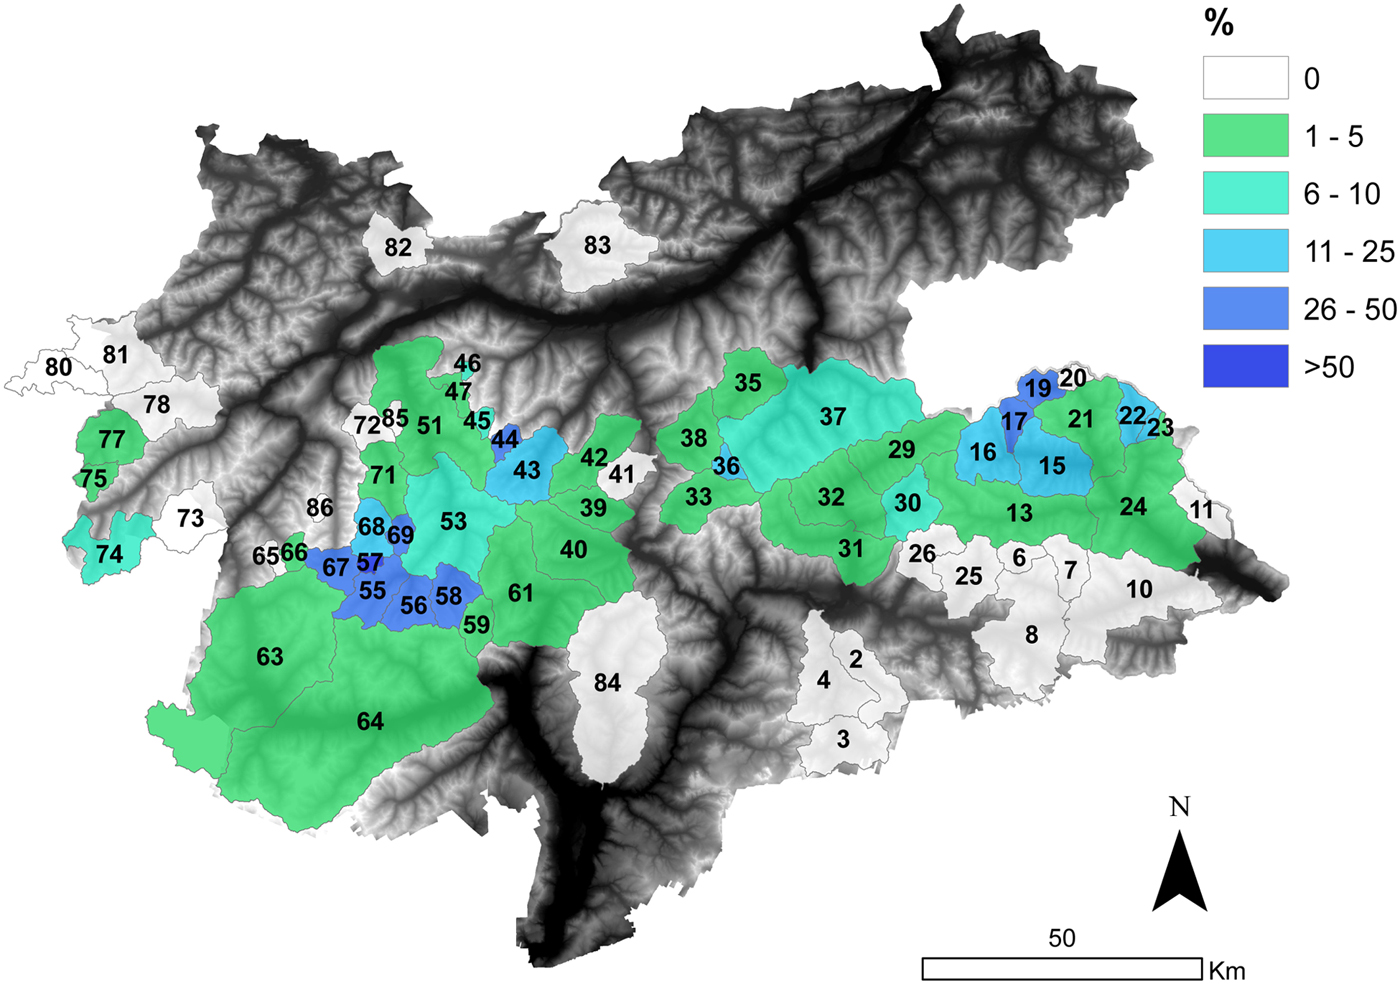
Fig. 1. The basins used in this study. The fraction of the basins covered by glaciers is given in % of the total basin area by a colour code. Some of the basins are described in Table 1. The grey of the background indicates low elevation with dark shades like Lech Valley in the North-East, the Inn Valley from West to East in the North and the Etsch Valley in the South. The Main Alpine divide runs approximately from basin 65 to 58 to 33 to 20. Basins 63 and 64 as well as 2–4 are the driest, well screened by high mountains from both North and South. Only sub-basins are entered in this map, some large aggregated basins are mentioned in the text, for example, 34 Mayrhofen, which includes basins 35–37 and 79 Steeg, which includes basins 80 and 81.
The basis for our modern understanding of the behaviour of water in ice and snow was to a great part laid in the International Hydrological Decade (1965–74). Further, processes like infiltration, saturation and metamorphosis that were studied in laboratory experiments or at the plot scale produced substantial knowledge at the smaller scales (e.g. De Quervain, Reference de Quervain1973; Colbeck, Reference Colbeck1978; Ambach and others, Reference Ambach, Blumthaler and Kirchlechner1981; Röthlisberger and Lang, Reference Röthlisberger, Lang, Gurnell and Clark1987; Fountain, Reference Fountain1989; Kattelman and Dozier, Reference Kattelman and Dozier1999). Point measurements of liquid water in snow were made, among others, by Denoth and others (Reference Denoth1984). These measurements have recently been revived with novel methods (Techel and Pielmeier, Reference Techel and Pielmeier2011; Eisen and Schweizer, Reference Eisen and Schweizer2014; Koch and others, Reference Koch, Prasch, Schmid, Schweizer and Mauser2014; Heilig and others, Reference Heilig2015; Schmid and others, Reference Schmid2015), however, again at the point or plot scale.
The work of Stenborg (Reference Stenborg1970) is an early example of the consideration of LWS at the basin scale as the cause for ‘runoff delay’ and Tangborn and others (Reference Tangborn, Krimmel and Meier1975) concluded that LWS is ‘not negligible’. Reviews by Jansson and others (Reference Jansson, Hock and Schneider2003); Verbunt and others (Reference Verbunt2003) and Hock and others (Reference Hock, Jansson, Braun, Huber, Bugmann and Reasoner2005) give further references to recent work, which is generally concerned with limited areas or single basins. Here we attempt to survey the course of LWS characteristics for a large number of basins in two periods of different climate (1970–97 and 1998–2006). Beyond that, we analyse them with respect to the different climatic conditions found in the area of investigation.
DATA AND METHODS
In order to determine long-term averages of the LWS for each basin we use OEZ, a conceptual, semi-distributed model with monthly resolution and 100 m elevation bands (Summaries of this model were given in Kuhn, Reference Kuhn2000, Reference Kuhn2003, more details are given below). We calculate the balance of water in any phase between precipitation P, runoff Q, evapotranspiration E and storage S at the basin scale. We then model the rain fraction in precipitation and the amount of meltwater produced for each month, compare them with the measured basin runoff and consider the difference to be storage or release of liquid water.
 $$P = Q + E + S$$
Since S is only known from the glacier inventories as period mean annual value (1970–97 and 1998–2006), the solution of Eqn (1) proceeds from period mean annual values of each term. Runoff data are available from public services and power companies. Evaporation was parameterized according to altitude, vegetation and snow cover (Kuhn, Reference Kuhn2000, Reference Kuhn2003). Results are in agreement with other authors (e.g. Kaser, Reference Kaser1982; Körner, Reference Körner1999; De Jong and others, Reference De Jong, List and Ergenzinger2002; Braun and others, Reference Braun, Escher-Vetter, Siebers, Weber, Psenner and Lackner2007). It was assumed that, for long-term averages, changes in the storage term are restricted to changes in glacier mass balance. Values of the long-term glacier mass balance were taken from three Austrian glacier inventories (Lambrecht and Kuhn, Reference Lambrecht and Kuhn2007; Abermann and others, Reference Abermann2012; Kuhn and others, Reference Kuhn, Lambrecht, Abermann, Patzelt and Gross2012) and of South Tyrol (Knoll and others, Reference Knoll, Kerschner and Abermann2009). These inventories supplied DEMs for the years 1969, 1997/98 and 2006, providing constraints on the storage terms S for Period 1 and 2, by calculating the respective glacier volume changes using DEM differencing. Averages of Q were determined from measured values and those of E were estimated for these two periods as well. The resulting value of P is thus the mean of annual basin precipitation over the corresponding period, referred to as ‘period mean’ in the following.
The period mean annual value of basin precipitation was distributed over all months of the year, proportional to precipitation period mean monthly values from reference stations. The undercatch caused by wind and snow (Dingman, Reference Dingman2015) was corrected according to Sevruk (Reference Sevruk1983). Basin precipitation was then distributed with altitude with monthly values of precipitation gradients (dP/dz (mo)) and adjusted in the successive approximations of the model as P(mo) so that the basin value of P was preserved. With measured values of Q(mo), parameterized evaporation E(mo), monthly storage S(mo) was determined by Eqn (1).
Temperature T(mo,z) was determined using T(mo)ref from reference stations in the valley and converted to T(mo,z) with lapse rates taken from the HISTALP dataset (Chimani and others, Reference Chimani, Matulla, Böhm and Hofstätter2012) for 12 regional groups of basins. Temperature T(mo,z) is required to distinguish between rain and snow, and to calculate potential melting using degree-day factors DDF(mo). The choice of DDF(mo) and dP/dz(mo) is not well-constrained; their interdependence increases the uncertainty of the model as will be described below. Finally, snow is redistributed by wind drift and avalanches once it is deposited, giving glaciers higher accumulation than ice-free ground as is observed in nature (Kuhn, Reference Kuhn2003; Helfricht and others, Reference Helfricht, Schöber, Schneider, Sailer and Kuhn2014). This redistribution is accomplished in the model by moving snow from ice free to glacier areas using constant factors for each basin, it is constrained by the specific glacier mass balance and its change with altitude as derived from the DEMs of the glacier inventories.
LWS is then derived from the balance of the liquid parts of Eqn (1), reduced by evaporation
 $$LWS = R + M - E - Q$$
The magnitude of LWS is generally smaller than the runoff Q, meltwater M and rain R, and it is the small difference of possibly large quantities. This makes it especially important to consider its uncertainty.
Uncertainty
Basically, uncertainty in this investigation has four components: uncertain data input, an imperfect model, uncertain parameterization and the uncertainty whether liquid water is stored in the ground or in snow and ice. As a reference text we recommend the book of Gupta (Reference Gupta2012) and recent evaluations of uncertainty in hydrological modelling (e.g. Gupta and others, Reference Gupta, Sorooshian and Yapo1998; Zappa and others, Reference Zappa, Pos, Strasser, Warmerdam and Gurtz2003; Addor and others, Reference Addor2014; Huss and others, Reference Huss, Zemp, Joerg and Salzmann2014).
The uncertainty of the data input is difficult to estimate. Monthly runoff values with peak discharge may be off by up to 10% when moving bed load alters the rating curve, but in large basins and with long-term averages, uncertainty will be reduced. Precipitation and evaporation are known to suffer from measurement errors (Sevruk, Reference Sevruk1983; Brutsaert, Reference Brutsaert2005; Hendriks, Reference Hendriks2010; Dingman, Reference Dingman2015). Geodetic determination of storage change in glaciers based on DEM differencing may be better than ±150 mm (Abermann and others, Reference Abermann, Fischer, Lambrecht and Geist2010; Bollmann and others, Reference Bollmann, Sailer, Briese, Stötter and Fritzmann2011); conventional glacier mass balances may have errors of 100–200 mm (e.g. Andreassen and others, Reference Andreassen, Elvehoy, Kjollmoen and Engeset2015). The contribution of these uncertainty values to overall uncertainty is distinctly reduced by the ratio between glacierized to total area. For the uncertainty of each of these data sources there exists a certain consensus in the scientific community, but that cannot be taken as a basis for a meaningful statistical analysis (Nuzzo, Reference Nuzzo2014).
Our model is not an operational model and is not used as a predictive model in this study. Its purpose is to determine the evolution of the Alpine water balance as a response to long-term climatic changes. It does not lend itself to a rigorous validation in this context. It is based on two basin mean, period mean annual values of S, Q, E and P like S (1970–97) and S (1998–2006), which excludes the application of a leave-one-out validation. It is calibrated with measured period means of monthly basin runoff, calculated period means of annual storage change based on three glacier inventories and period means of monthly, parameterized evaporation. It is most accurate in high-altitude basins and in basins with large relative ice cover and we expect it to be least accurate in low altitude, vegetated areas.
A desirable cross validation of this model with direct glaciological measurements suffers from the lack of any records of basin-wide LWS determined with other methods to compare with.
The model was calibrated for each basin to meet the objectives of reproducing the measured period mean monthly runoff within ±20 mm and reproducing the period mean of annual glacier mass balance, given by three glacier inventories, within ±50 mm.
There are at least two cases of equifinality where similar quality of optimization can be reached with several possible combinations of parameters, namely the interdependence of dP/dz and dT/dz in creating accumulation at a given height and that of dT/dz and DDF in melting that amount: smaller temperature lapse rates require lower DDFs to melt a given amount of snow.
 $$\eqalign{& {\rm Accumulation} = {\rm} P{\rm} ({z_{\rm o}}){\rm} + {\rm} (dP/dz)\Delta z \cr & {\rm Ablation} = (T({z_{\rm o}}){\rm} + {\rm} (dT/dz)\Delta z){\rm} DDF} $$
This ambiguity was constrained by limiting DDFs between 4 mm/DD (mm w.e. per degree-day) for winter snow and 8 mm/DD for bare glacier ice and by assuming that dP/dz should be higher with advective precipitation prevailing in winter than with convective precipitation prevailing in summer. Regional values of dT/dz given in the HISTALP dataset were used (Chimani and others, Reference Chimani, Matulla, Böhm and Hofstätter2012). Given these constraints we decided that a Monte Carlo Simulation of LWS determination, which is the central topic of this investigation, would at least give a fair indication of uncertainty. The Monte Carlo Simulation was set up for one basin, that of 12 Lienz Isel 1970–97, results are given in Figure 2. Assuming normal distribution of all input parameters we used the following standard deviations: 0.25°C for the reference temperature, 5% for reference precipitation, 0.05°C 100 m−1 for lapse rate, 2% (100 m)−1 for the altitudinal change of precipitation and 0.1 for the redistribution factor of snow. This resulted in maximum values of the standard deviation of LWS of about ±30 mm that are reached in May and July. This is about one third of the mean LWS in these months, but little compared with precipitation and runoff. It should be kept in mind that a Monte Carlo simulation is a strictly statistical evaluation in which individual input parameters are assumed to have a normal probability density function and are varied independently, for example, deviations of temperature are not correlated with deviations of precipitation.
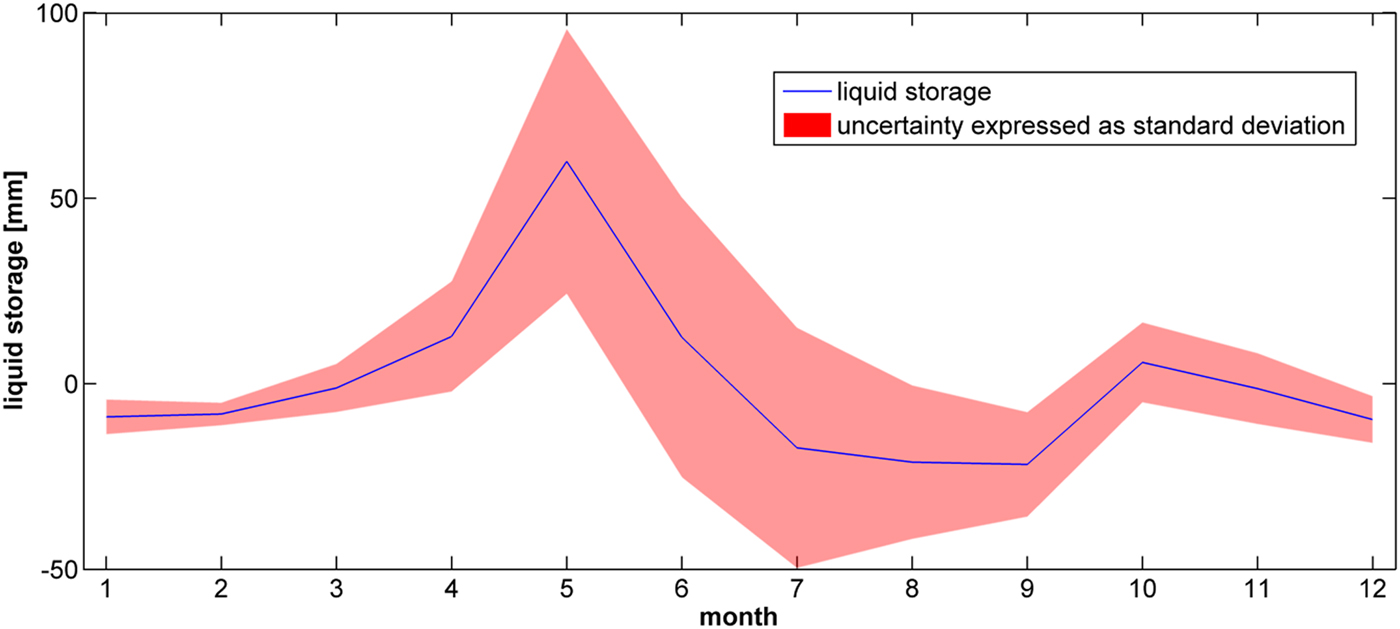
Fig. 2. Uncertainty of the determination of the LWS expressed as one standard deviation from the monthly mean derived from a Monte Carlo Simulation. Valid for the basin 12 Lienz Isel, which includes basins 13–24 in Figure 1, for the years 1970–97. This basin has an area of 1197 km2 extending from 600 to 3700 m, is to 5% glacierized and has precipitation maxima in November and August.
RESULTS AND DISCUSSION
Monthly values of the four components of the water balance plus LWS have been calculated for all basins, examples are given in Figure 3. Physiographic characteristics are presented in Table 1. Monthly values of LWS, solid storage and cumulative w.e. of solid storage are shown in Table 2, all expressed in mm w.e. The basins 19 Innergschlöß and 55 Rofenache are of the glacial type and show maximum melt and runoff in July, produced by glacier melt. The basins 79 Steeg and 3 Pedraces, with runoff maxima produced by snowmelt in May or June, are of the nival type. Precipitation is abundant in all four examples, with maxima in July and August reflecting convective activity. Innergschlöß, Rofenache and Pedraces show secondary maxima in October and November, which are typical for Mediterranean influence, and are observed up to the main Alpine divide. Evaporation plays a subordinate role in these three basins, with higher values at the lower altitude of 79 Steeg.

Fig. 3. Examples of the components of the water balance in the two periods, period mean monthly values in mm w.e.. Q is runoff, P precipitation, S storage, E evaporation and LWS liquid water storage. The basin of 55 Rofenache is high (Table 1) and relatively dry (Table 2), 19 Innergschlöß is high and wet, 79 Steeg is relatively low and wet, while 3 Pedraces is low and dry. Basin numbers are those given in Figure 1 where 79 Steeg comprises basins 80 and 81. Hydrological years are indicated by the calendar year in which they end, for example, 1970 refers to October 1969–September 1970. Faint lines refer to the first period, heavy lines to the second.
Table 1. Glacier cover, basin area, basin altitude range and annual basin precipitation of selected basins, for the period 1998–2006
Basin numbers refer to Figure 1. Basin 34 Mayrhofen aggregates basins 35–37, 79 Steeg comprises basins 80 and 81. Basins affected by hydro-electric dams are marked with*.
Table 2. Averages 1998–2006 of monthly LWS and monthly solid storage of snow and ice in the basins listed in Table 1, each in mm w.e. per month
Storage values given here are derived from the basin water balance (Eqn (1)) and are annual basin means. For example, solid storage in February includes changes of the snow cover in the entire basin. Values restricted to the glacier surface, i.e. the annual mean specific glacier mass balance, are summarized in Table 3.
Table 3. Mean values of summer temperature T (June, July, August) and mean annual precipitation P at Obergurgl (11°01′30″ E, 46°52′03″ N, 1930 m a.s.l.) and arithmetic means of mean specific annual mass balance of the 28 glacierized basins, for which data exist in both periods
The basins 63 Spondinig and 34 Mayrhofen listed in Table 2 contain hydropower reservoirs, which store water in the summer months and release it for power production in the winter. Although both basins have large areas this activity is evident in extreme values and amplitudes of LWS.
Glacier changes from the first to the second period were considerable. Arithmetic means of mean annual specific mass balance have been derived from DEM differencing for glaciers in the 28 glacierized basins, for which data exist in both periods. The mean annual specific glacier mass balance changed from −560 mm w.e. a−1 in the first period to −1170 mm w.e. a−1 in the second period. These results are compared with summer temperatures und annual precipitation in Table 3. The sensitivity of the glacier mass balance to climate changes is in good agreement with results presented by Kuhn (Reference Kuhn2003).
Snowmelt causes an early increase in runoff and contributes to a first peak in LWS, which is particularly well developed in the basin of 79 Steeg. Secondary peaks in LWS in summer and fall appear to coincide with peaks in precipitation. In fall and winter, changes of LWS feed the base flow at a rate that is obviously influenced by basin altitude. In Table 2, monthly values of LWS are presented together with solid storage including release by ice melt, all expressed as basin averages. Figure 4 presents two examples of monthly LWS with a pronounced change from one summer peak in the first period to two in the second. The release of water between the two peaks feeds the summer base flow. Figure 5 shows that the trend from prevailing single summer peaks of LWS to double peaks is indeed widespread.

Fig. 4. LWS in the basins of 75 Verwall and 55 Rofenache. Note the change from one maximum in June or July to two maxima in May and August, the first due to earlier snow melt and the second primarily due to the precipitation maximum in August. Basin characteristics are given in Table 1.
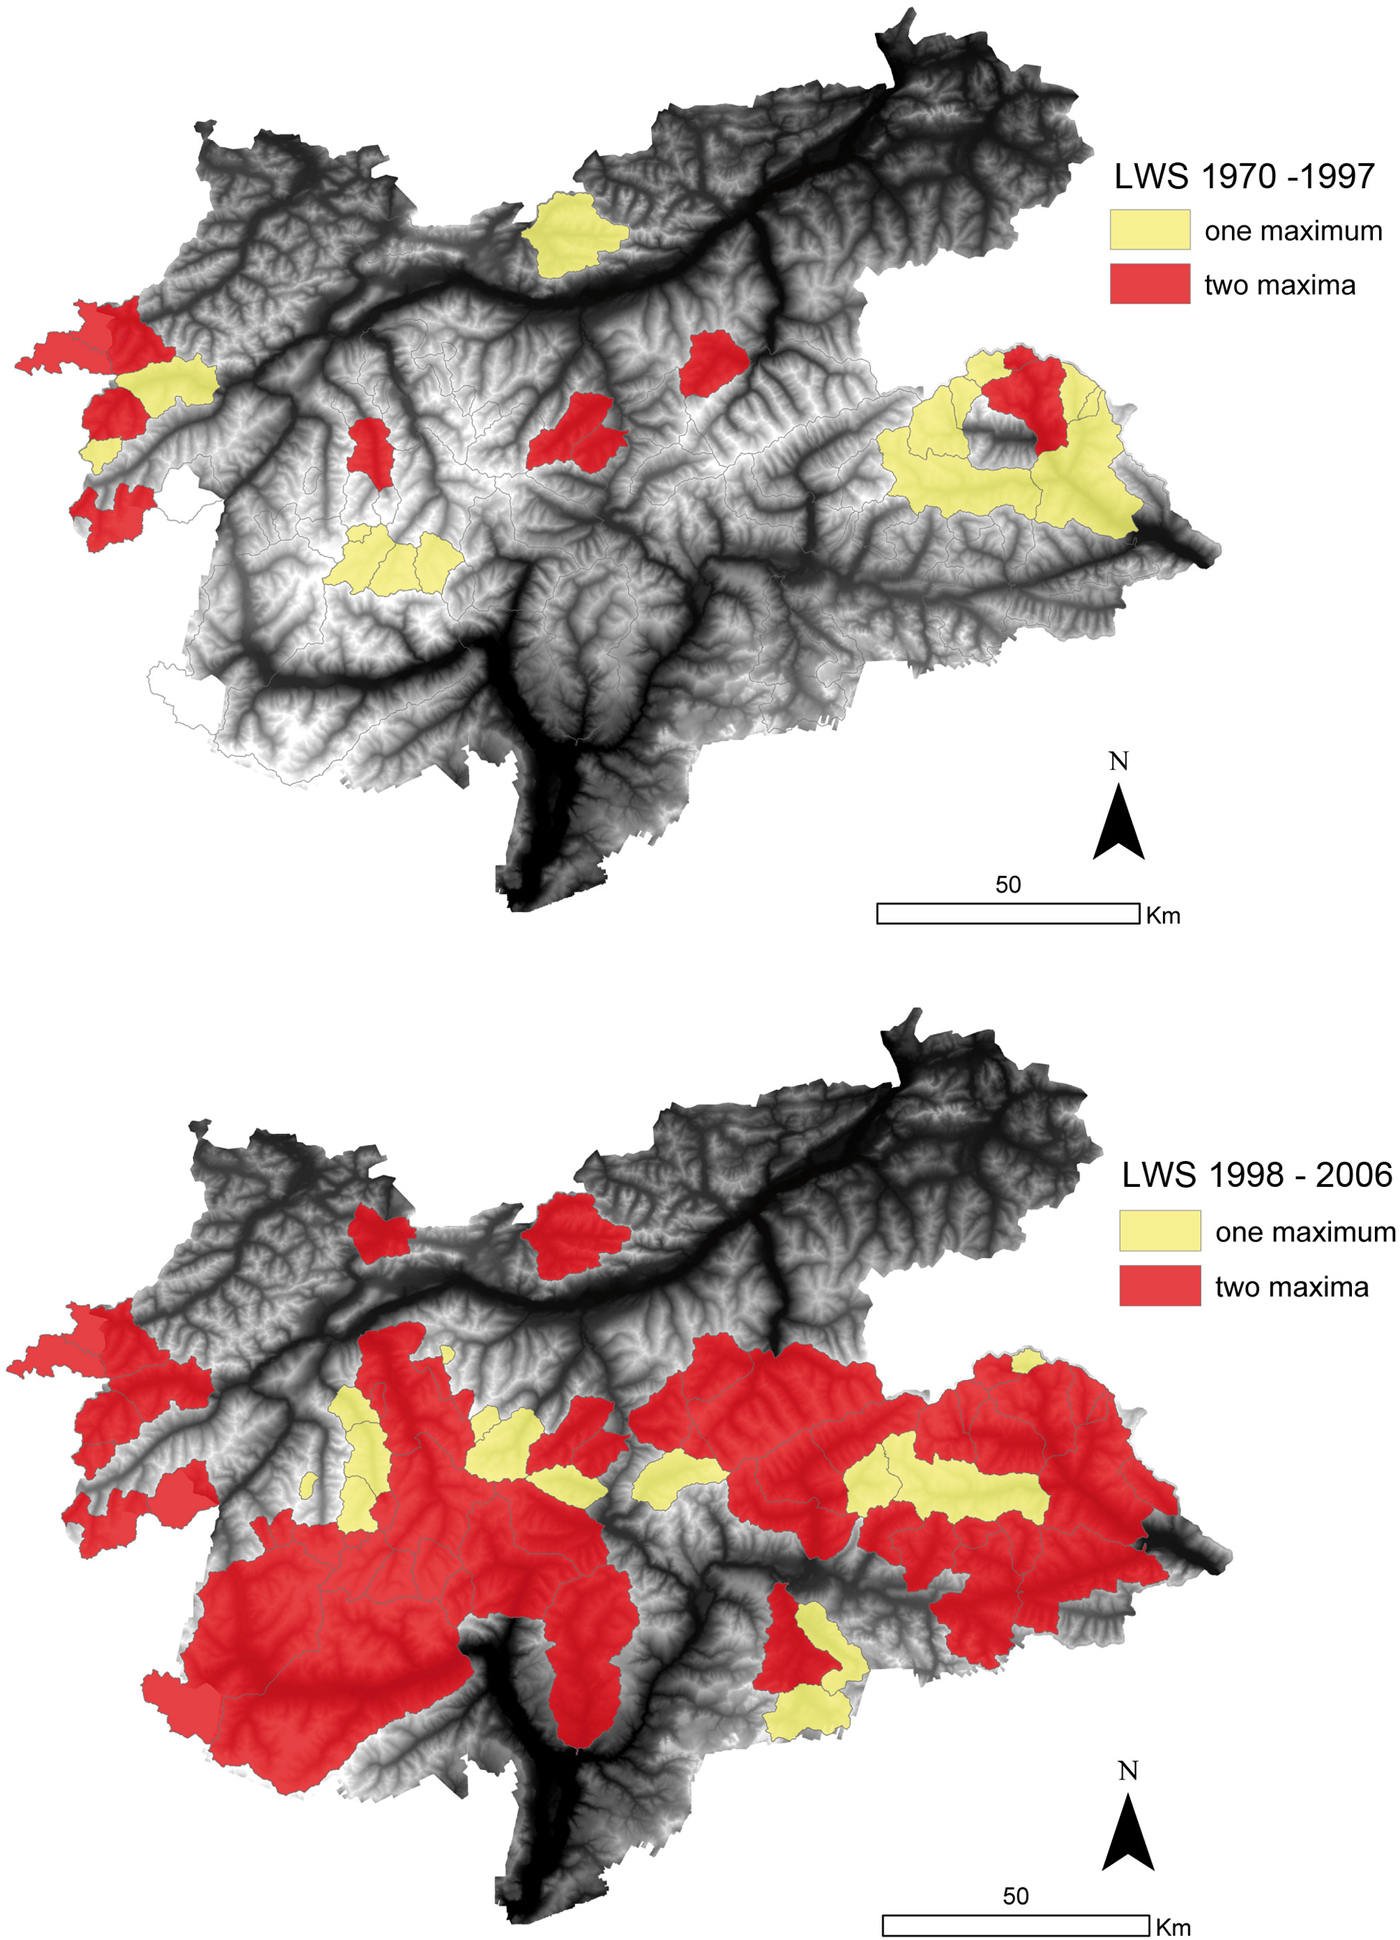
Fig. 5. The appearance of maxima of LWS in the summer months. Yellow colour indicates one maximum (usually in July), red indicates two maxima, usually in May and August. This obvious shift from one maximum in the first period, where basin-wide snowmelt and summer rains nearly coincided, to two in the second period, is due to earlier snowmelt in recent years combined with a minor increase in late summer precipitation.
In Figure 4 and Table 2 we observe frequent release of LWS in the months following the first LWS peak, which may have several causes. One is a release of the storage in the snow pack that was filled with meltwater in May.
Figure 6 shows that from May to July, snow w.e., and thereby storage space within the snow pack, is drastically diminished in the altitude bands between 2800 and 3100 m. Meltwater stored in the snow since May slowly drains during summer from the remaining snow pack, firn body and bare ground, like base flow in winter. It should be noted that in the active time of the water cycle from May to October, all transient hydrological reservoirs of the basin are being refilled and release water at the same time. These processes have been referred to in various studies. De Quervain (Reference de Quervain1973) noted that ‘a considerable amount of free water may exist in a transient state during and following a melting period or rainstorm’. Fountain (Reference Fountain1989) found a rise of water storage in April and a release in October on South Cascade Glacier, which seems typical for the glaciers in the Alpine area as well. Verbunt and others (Reference Verbunt2003) give the change of water balance components with altitude for three Alpine catchments and Jansson and others (Reference Jansson, Hock and Schneider2003) state that the annual course of LWS is governed by seasonal snow, water in firn and en- and subglacial water. They show the seasonal change of storage and release of water in glaciers of various climatic conditions. Further references are given in the chapter on Glacial Hydrology in Cuffey and Paterson (Reference Cuffey and Paterson2010).
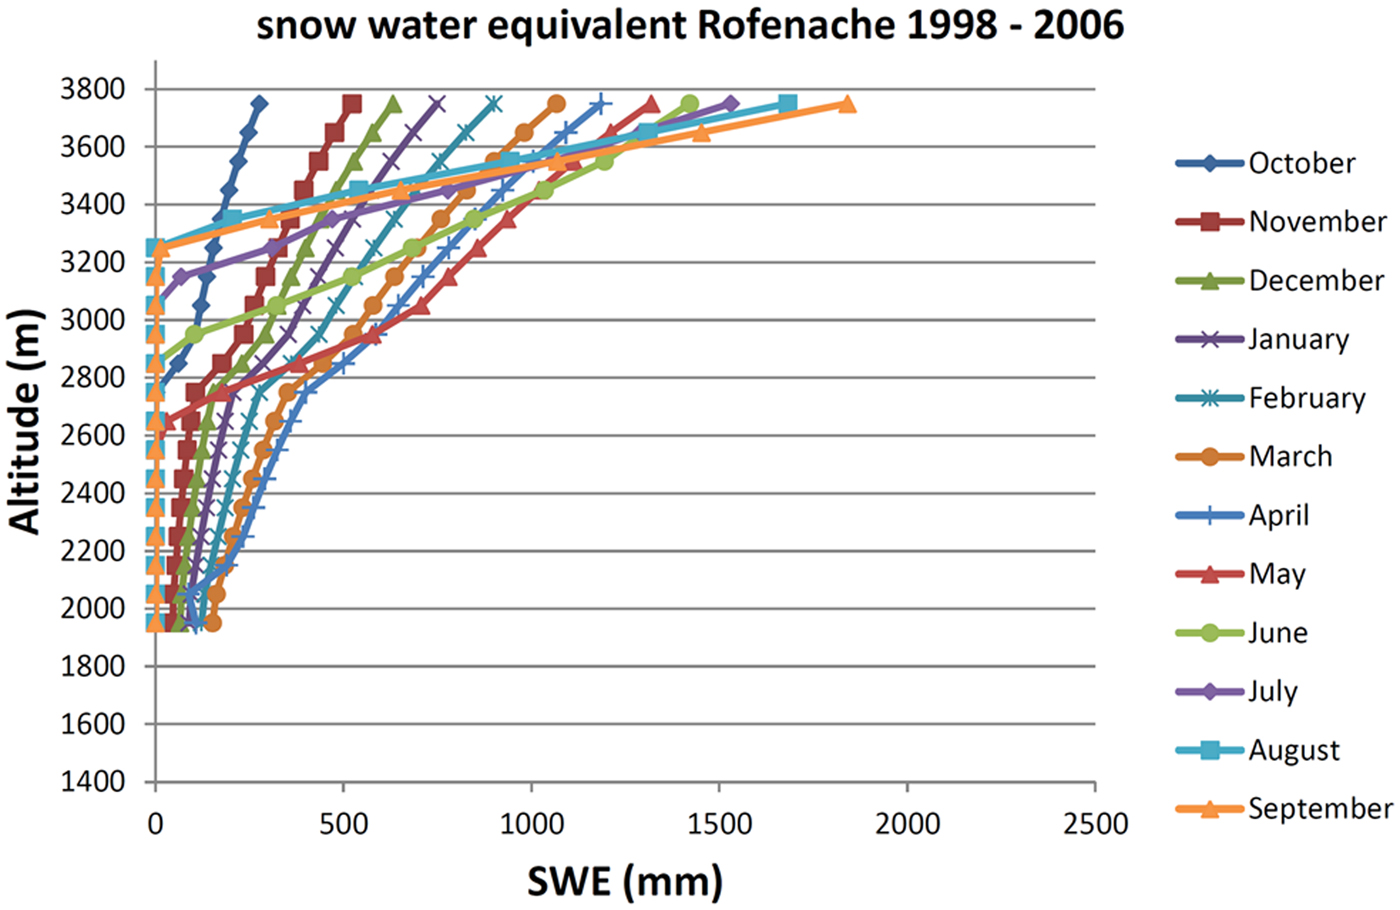
Fig. 6. Evolution of the snow w.e. in the basin of 55 Rofenache, mean values for the period 1998–2006. In the dark blue profile of monthly net accumulation in October, appreciable accumulation starts from 2800 m a.s.l. upwards. The snow w.e. increases at all elevation bands throughout the accumulation season till April (blue crosses). The snow line retreats to 2900 m in May–June (brown and green profiles) and reaches the equilibrium line altitude (ELA) at 3250 m in September with maximum altitudinal gradients. Each of the profiles leads to an upper bound for liquid water storage.
Next, we present how much of the LWS is in each transient hydrological reservoir. For snow, Heilig and others (Reference Heilig2015) give 5% by volume as a frequently appropriate upper limit of LWS. The cumulative value of the w.e. of the snow pack, given in the third line for each basin in Table 2, provides an upper bound on the snow storage. For example, 75 Verwall in the month of May has a liquid storage of 50 mm w.e., a large part of which may be accommodated in the snow pack of 458 mm w.e.. In the unglacierized basin 79 Steeg, again in May, the liquid storage of 170 mm does not fit into 140 mm w.e. of the snowpack so that a considerable amount must be stored as ground water as no other transient storage reservoirs exist at the surface.
Finally, we address the question of how much the presence of glaciers influences the seasonal course and the amplitude of LWS. From Tables 1 and 2 we find that higher maxima of monthly LWS appear in low elevation, unglacierized basins, which reach altitudes of little more than 2700 m, while areas with large glacier covers go up to ~3700 m. This suggests that for the variation of LWS, the altitude range as given for example, in Table 1, is more important than glacier cover. The basin 57 Vernagt with an altitude range 2600–3600 m and 74% ice cover is an exception in Table 2 with peak LWS in July and August. In other basins, an indication of increased englacial storage in August was not found.
CONCLUSIONS AND OUTLOOK
Using a semi-distributed hydro-meteorological model we determined monthly values of the components of the water balance and of LWS in glacierized and ice-free basins for two climatically different periods. A Monte Carlo simulation of LWS in one large basin indicated a standard deviation of 30 mm w.e. in May and less in other months. LWS has a pronounced seasonal variation that is similar in all basins. We found a change from a single summer peak of LWS in the first period 1970–97 to a double peak in May and August. We believe that it is due to higher temperatures, reduced snow cover and earlier melt in the second period 1998–2006, separating the spring maximum from the peak in August that may be caused by peak precipitation. We found that a basic condition for an increase in LWS is the supply of liquid water (either meltwater or rain), and we propose that the first LWS peak is supplied by the melting of winter snow. The summer peak or peaks (see Fig. 3, Innergschlöß) are due to water supply from rainstorms leading to an increase in the amount of water stored in glaciers such as in cavities, channels and crevasses or in subglacial sediments in the summer months.
The single peak in LWS in the first period may be explained in view of climate conditions at that time. In the years from 1965 to 1981, summer temperatures were lower; summer snow falls were more frequent so that minor glacier advances were observed at ~75% of Alpine glaciers. This meant more snow accumulation and later onset of melting that shifted the first peak of LWS to a later point in time, at the same time enlarging the second peak so that in many cases they grew together.
Typically, we observed release of water in June and July and believe that it is the slow draining of the spring meltwater peak from all storage compartments and the marked reduction of storage capacity in the waning snowpack. We were not able to separate the effects of glacier cover of a basin from that of its altitude when we tried to distinguish glacierized from ice-free basins.
The modelled snow cover may be validated by remote sensing data such as delivered by MODIS (Moderate-Resolution Imaging Spectroradiometer). However, MODIS records are available only for a limited time of the second period since the year 2000. Moreover, its areal snow cover product does not verify in any way the modelled values of snow w.e. We intend to test the period mean values of this model with the results of MODIS for the period from 2006 to a possible new glacier inventory. As a continuation of the present study we plan to resolve annual values of the water balance using meteorological records and records of annual glacier mass balances from up to ten glaciers in the greater area of investigation.
ACKNOWLEDGEMENTS
This paper was supported by the Autonomous Province of Bozen/Bolzano, Abt. 40 with Fördervertrag Nr. 29/40.3 (Eis und Wasser in Tirol, Folgen des Klimawandels) and by the University of Innsbruck. The input by Marc Olefs (now at Zentralanstalt für Meteorologie und Geophysik, Vienna) and Lukas Rastner (now at Hydrographic Office Bolzano) to the early phase of this project is highly appreciated. We thank the Scientific Editor Tómas Jóhannesson and the anonymous referees for their valuable comments and encouragement.


 Open access