


Introduction
The area of seasonal snow cover in the Northern Hemisphere has decreased, as has the length of the snow-cover season, compared with that in the 1970s (e.g. Reference Rikiishi, Hashiya and ImaiRikiishi and others, 2004). These trends are thought to have resulted from recent global warming and are more obvious in the middle latitudes. Japan is located on the eastern side of the Eurasian continent, and most of the country is located on two large islands: Honshu and Hokkaido. In winter, strong northwesterly monsoons blow from Siberia to the islands of Japan. The monsoons collect large amounts of water vapour while passing over the warm Sea of Japan, strike the major mountain range of Japan, and bring heavy snowfall to the northwestern part of the range. Therefore, some of the world’s heaviest seasonal snowpack occurs in regions facing the Sea of Japan. Cyclones are not major sources of precipitation in the middle of winter, but precipitation events resulting from cyclones increase with the end of winter (Reference NakaiNakai, 2007). On the other hand, the coastal region near the Sea of Japan is a warm snowfall area in which air temperature averaged over the coldest winter months (January–February) is above 0°C (Reference IshizakaIshizaka, 2004). Consequently, the snow cover in this region is vulnerable to global warming caused by greenhouse gases. In fact, simulation results based on predicted data using the coupling general circulation model (CGCM) indicate that snow depth in the Honshu region will decrease considerably as a result of global warming (e.g. Reference Inoue and YokohamaInoue and Yokoyama, 2003; Reference Hara, Yoshikane, Kawase and KimuraHara and others, 2008). Two factors could cause snow depth in this area to decrease. One is a decrease in the amount of winter precipitation. Based on more than 100 years of sequential data for mean winter temperature and winter precipitation at Tohkamachi (Fig. 1b) in the Hokuriku Region, Reference Takeuchi, Endo and MurakamiTakeuchi and others (2008) discovered a negative correlation between mean winter temperature and winter precipitation (water equivalent). Winter precipitation amounts tended to be lower in warmer winters because winter precipitation in this region is caused mainly by the cold winter monsoon. Therefore, it is likely that winter precipitation amounts in this region will decrease with global warming. The second factor is conversion of snowfall to rainfall as a result of warming. Using a regional climate model, Reference Yoshikane, Hara, Ma, Kawase and KimuraYoshikane and others (2011) determined that an increase in temperature and in the duration of sunshine in February caused the drastic decrease in snow cover that occurred in this region in the 1980s and 1990s. Based on measured data from Nagaoka (Fig. 1b), Reference Yamaguchi, Abe, Nakai and SatoYamaguchi and others (2007, Reference Yamaguchi, Abe, Nakai and Sato2011) suggested that the form of winter precipitation in Nagaoka will change substantially from snow to rain if temperature rises by even a small amount in the future because a large part of the present winter precipitation in Nagaoka occurs at ∼0°C. On the other hand, it is thought that melting snow particles affect the surface atmospheric conditions, including leading to the development of an isothermal layer of ∼0°C (e.g. Reference FindeisenFindeisen, 1940; Reference Matuso, Sakakibara, Aoyagi and MatsuuraMatuso and others, 1985). Therefore, any change in the percentage of winter precipitation represented by snow will likely not be a simple response to global warming, such as a linear change with temperature, because a change in the amount of snow particle melting would affect the surface atmospheric conditions. In the present study, we use 20 years of data to examine interannual fluctuations in the relationship between the amount of precipitation and the temperature at which precipitation occurs. We then discuss the complex condition of winter precipitation in this region.
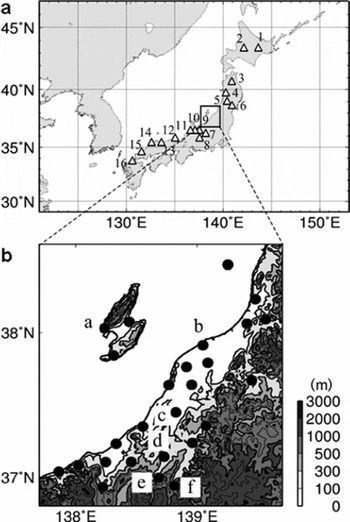
Fig. 1. Location of JMA observation sites: (a) white triangles are observation sites throughout Japan; (b) black circles are observation sites in Niigata Prefecture. a: Aikawa; b: Niigata; c: Nagaoka; d: Tohkamachi; e: Tsunan; f: Yuzawa.
Study Areas
We examined data mainly from Niigata Prefecture in the Hokuriku region located on the Sea of Japan side of Honshu island. This prefecture receives some of the heaviest snowfall in Japan. The Japan Meteorological Agency (JMA) operates 26 meteorological measurement sites in the area (Fig. 1b) and these sites record hourly temperature, precipitation (water equivalent) and wind speed data. The maximum snow depth in an average year at each site increases from <0.1 m in the coastal region to >4.0 m in the inland region. The averaged mean winter (December–February) temperature at each site varies from above 5°C at the coastal sites to below 0°C at the inland sites, reflecting the higher altitude of the inland sites. Therefore, winter precipitation conditions in this area would be expected to vary widely. In addition to these data, we examined data from 16 JMA observation stations distributed from Hokkaido island to the southern part of Honshu island (Fig. 1a) to analyse the dependence of winter precipitation conditions on regional climatic conditions.
Procedure
We analysed hourly temperature and precipitation data for the winter season, defined as the period from December to February, over a 20 year time period (1991–2011). To discuss the relationship between the amount of precipitation and the temperature at which precipitation occurs, we introduce a new concept, the winter precipitation curve (WPC), which is defined as the distribution of the ratio of the precipitation amount at each air temperature at which precipitation occurs to the total winter precipitation. The WPC indicates which air temperature is dominantly associated with the winter precipitation amount and how much snowfall is included in the winter precipitation amount. The concrete procedure is as follows. First, we sum the hourly precipitation that occurred at each air temperature, with a resolution of 0.1 °C. Second, we normalize each summed value by dividing it by the total winter precipitation. Finally, the data are smoothed by calculating a moving average over the range of ±0.5°C. The following three parameters are used to describe characteristics of the WPCs: average air temperature for the winter season (Ta ), average air temperature of all winter-season precipitation events (Tp ) and temperature at the highest peak of the WPC (Ts ) (Fig. 2c).
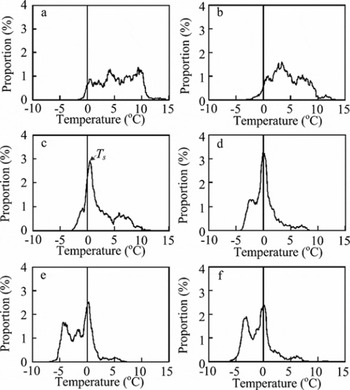
Fig. 2. Winter precipitation curves (WPCs) at each site for 2008: (a) Aikawa, (b) Niigata, (c) Nagaoka, (d) Tohkamachi, (e) Tsunan and (f) Yuzawa (locations shown in Fig. 1b). Ts is the temperature of the highest peak of a WPC.
Results and Discussion
Type of WPC
Figure 2 shows the WPCs for six locations, Aikawa (5.5 m a.s.l.; a in Fig. 1b), Niigata (1.9 m a.s.l.; b in Fig. 1b), Nagaoka (23 ma.s.l.; c in Fig. 1b), Tohkamachi (170 m a.s.l.; d in Fig. 1b), Tsunan (423 m a.s.l.; e in Fig. 1b) and Yuzawa (340ma.s.l.; f in Fig. 1b), which are distributed from the coast (Aikawa, Niigata) to the mountains (Tsunan, Yuzawa), for winter 2008 (winter 2007/08 is designated as winter 2008 in this paper). Values of Ta are highest at Aikawa along the coast (Ta =4.2°C) and lowest at Tsunan in the mountains (Ta =–0.4°C). The shapes of the WPCs clearly differ (Fig. 2). Those in Nagaoka and Tohkamachi show a single sharp peak at ∼0°C. Even if there is another small peak, the difference between the sharp peak at ∼0°C and the small one is larger than several percentage points. We refer to these as the single-peak (SP) type. In contrast, the WPCs in Aikawa, Niigata, Tsunan and Yuzawa show several small peaks, and the difference between peaks is smaller than one percentage point. We refer to these as the multiple-peaks (MP) type. Although the MP type has several small peaks, one of these is also at ∼0°C.
Figure 3 shows interannual fluctuations of Tp and Ts . Two different relationships between the interannual fluctuations of Tp and Ts can be seen. The Ts values of the MP type locations show large interannual fluctuations, and the fluctuations of Ts seem to be synchronized with those of Tp. On the other hand, Ts values of the SP type do not fluctuate but remain at ∼0°C each year, although Tp shows obvious year-to-year fluctuations.
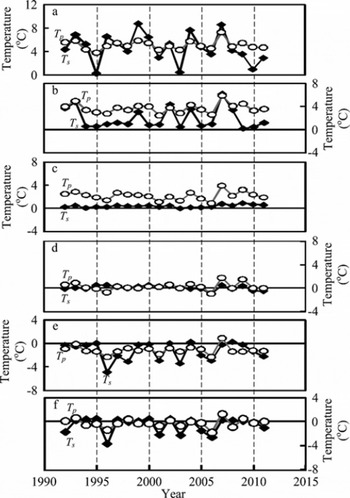
Fig. 3. Interannual fluctuations of average air temperature of all winter-season precipitation events (Tp) and the temperature of the highest peak of a WPC (Ts) for: (a) Aikawa, (b) Niigata, (c) Nagaoka, (d) Tohkamachi, (e) Tsunan and (f) Yuzawa.
Dependence of WPC type on climatic conditions
Figure 4 shows the relationship between Ta and Tp, averaged over the 20 years. Black circles represent stations in Niigata Prefecture (Fig. 1b); white triangles represent stations in other prefectures (Fig. 1a). A linear relationship between Ta and Tp can be seen in the graph. This result implies that Tp is basically determined by Tä, which should reflect the climate condition of each site. On the other hand, the relationship between Tp and Ts averaged over the 20 years seems complex (Fig. 5). Three different temperature sections can be identified. The first (section I) occurs when Tp is above 4°C. In this section, Ts seems to be directly proportional to Tp (i.e. Ts increases as Tp increases), although both Ts and Ta show large scattering around a linear function. The second section (section II) occurs between Tp=4°C and Tp =0°C. In this section, Ts remains at ∼0°C and does not show large fluctuation even though Tp varies from 4°C to 0°C. The third section (section III) occurs when Tp <0°C. In this section, Ts seems to be directly proportional to Tp, as in section I, and they show small scattering around a linear function. Sections I and III represent the MP type, whereas section II represents the SP type. The WPCs of the border between two sections fluctuate between the MP type and SP type with year-to-year fluctuations of Tp; hereafter we refer to this type as the Mix type.
Fig. 4. Relationship between the average air temperature for the winter season (Ta) and the average air temperature of all winter-season precipitation events (Tp). The black circles represent observation data from Niigata Prefecture averaged over 20 years. The white triangles represent observation data from other prefectures averaged over 20 years. The dashed line shows the 1 : 1 linear relationship.
Fig. 5. Relationship between the average air temperature of all winter-season precipitation events (Tp) and the temperature of the highest peak of a WPC (Ts). The black circles represent observation data from Niigata Prefecture averaged over 20 years. The white triangles represent observation data from other prefectures averaged over 20 years. The dashed line shows the 1 :1 linear relationship.
To determine whether the above characteristics are unique to Niigata Prefecture, we also analysed the WPCs of 16 stations distributed widely throughout Japan (Fig. 1a). These WPCs could also be classified into the three types (MP, SP and Mix type), as shown in Table 1. Here we assigned a WPC type to each site based on which type mainly appeared throughout the 20 year study period. If MP and SP appeared with almost the same frequency during the 20 years, we classified the site as Mix type. Additionally, the relationship between Tp and Ts could be classified into the same three sections as observed in Niigata Prefecture (Fig. 5). From these results, we conclude that the characteristics of the WPCs in Niigata Prefecture are not peculiar to the region but instead reflect some physical processes.
Table 1. Location, altitude and WPC type of 16 observation stations
Causes of the different types of WPC
We now consider the reasons for the two distinct types (SP and MP) of WPC. As shown in Figure 4, Tp basically depends on Ta. Thus, one of the peaks in a WPC should be controlled by the climatic condition at each site and the peak should appear around Tp. This hypothesis is supported by the relationships between Tp and Ts in sections I and III, i.e. Ts changes with change in Tp. We named the peak determined by the climatic condition the climatic peak (CP). If we can apply our hypotheses to section II, then there should be some processes that change the position of the CP to ∼0°C. Reference FujibeFujibe (2001) analysed hourly data at 808 JMA automated stations for 19 years and found that the temperature during precipitation events has a distinct frequency maximum just above 0°C, although no peak existed in non-precipitation events. Reference FujibeFujibe (2001) suggested that the distinct frequency maximum resulted from an isothermal layer caused by the melting of snow particles. Based on this idea, we estimated the potential of snow particle melting to cool the surface atmospheric condition. To consider the standard precipitation condition in the study region, we calculated the precipitation intensity (pint) for all winter precipitation intensities (Table 2) and the ratio of each of several time durations of precipitation events (tdur) to all winter precipitation events (Table 3), which were averaged over the 20 years at three sites (Niigata, Tohkamachi and Tsunan). As shown in Figure 2, Niigata and Tsunan are classified as the MP type, whereas Tohkamachi is a typical SP type. For reference, Table 2 also presents the total winter precipitation amount, Ta and Ts . Table 2 shows that pint=1 mm h−1 accounts for 58%, and pint = 2mm h−1 for ∼20%, of all winter precipitation events at all sites. Based on these results, we estimated the potential cooling effect of snow particle melting on the surface atmospheric condition for the cases of p int = 1 and 2 mm h−1. The time evolution of the 0°C isothermal layer was discussed by Reference Atlas, Tatehira, Srivastava, Marker and CarboneAtlas and others (1969) based on the assumption of a layer having a uniform lapse rate Γ. Consider a column of air of unit cross-sectional area. If a mass of snow (m; kg) melts in this column, it will remove from the air an amount of heat equal to Lfm, where Lf is the heat of fusion of ice (334kJkg−1). This heat removal will produce an isothermal layer of depth H (m) given by
where p a is the density of air (1.3kgm−3) and Cp specific heat of air at constant pressure (1006J kg- 1 is K–the 1). Here, the origin of the z-axis is the position of the initial 0°C layer. After integration, Eqn (1) yields
Table 2. Ratios of precipitation intensities to all winter precipitation intensities at three sites. The values are averaged over the 20 years of the study

Table 3. Ratio of duration of precipitation to total winter precipitation at three sites (%). The values are averaged over the 20 years of the study
We introduce m=pw P melt, where P melt is the amount of precipitation that has melted and p w is the density of liquid water (1000 kgm−3), in Eqn (2). The relationship between H and precipitation is given by
Assuming T to be 0.006°Cm 1 and all precipitation to be melted (here P melt = 1 and 2 mm), H was calculated as 291 m (P melt = 1 mm) and 413 m (P melt = 2 mm). Although our analyses did not consider processes that offset the cooling caused by melting, such as turbulent mixing and condensation heating, the estimated values are not unrealistic compared with observed reports of isothermal layers (e.g. Reference Matuso, Sakakibara, Aoyagi and MatsuuraMatuso and others, 1985). Our estimations indicate that the general precipitation condition in the study region is such that a 0°C layer located above 290 m (410 m) from the ground level can potentially reach ground level in 1 hour. In other words, even if the initial surface temperature (T ini) was 1.7°C (2.5°C), as estimated from Γ and the initial 0°C layer height H (T ini = Γ × H), the surface temperature would frequently become 0°C because the 0°C isothermal layer could reach ground level in 1 hour. From these analyses, we considered the potential cooling effects of snow particle melting on the surface atmospheric condition in this region (AT) to be ∼2°C. Table 3 shows that in >40% of winter precipitation cases at all sites, precipitation continued to fall for >1 hour. This result indicates that precipitation in the study region continues after the surface temperature has been reduced within the past hour by the effect of melting snow particles.
The above cooling mechanism of snow particle melting should cause a peak to appear in the WPC near 0°C (P 0) that should be common to both MP and SP types (Fig. 2). If the CP, which might appear around Ta, is sufficiently higher than A T (Niigata), then the cooling effect of snow particle melting will not have a strong effect on the position of the CP, although the CP might decrease to a slightly lower temperature. Meanwhile, the cooling effect of snow particle melting will lead to a P 0 peak because surface temperature conditions lower than ΔTduring precipitation events will be shifted to ∼0°C. Thus the WPC should have multiple peaks (MP type), one of which is P 0 and the other of which is the CP. On the other hand, if the CP is located around A T (Tohkamachi), its position should shift to ∼0°C due to the cooling effect of snow particle melting. Thus the peak that appears at ∼0°C becomes sharper because P 0 and the CP overlap (SP type). When the CP is below 0°C (Tsunan), there is no temperature-change effect. Therefore, the CP does not change position, but the surface temperature during precipitation events with temperature between 0 and A T should be shifted to ∼0°C by the cooling effect of snow particle melting, following which a P 0 peak appears. Thus, the WPC has multiple peaks (MP type). Moreover, the phenomenon of Tp being cooler than Ta at all sites (Table 2) might be caused by the appearance of P 0, i.e. some parts of the surface temperature during precipitation shift to a lower temperature because of the cooling effect of snow particle melting.
This conclusion is consistent with the results shown in Figure 5, i.e. sections I and III show a linear correlation between Tp and Ts and the highest peak in those sections should be the CP. On the other hand, Ts in section II remains stably at ∼0°C even though Tp fluctuates from 0°C to 4°C, and the highest peak in section II should be mixed CPand P 0 peak. Moreover, because the boundary between SP and MP types depends on Tp, sites located near the boundary between two sections display year-to-year fluctuations of WPC type because Tp fluctuates around the boundary temperature (AT).
Conclusions
We analysed 20 years of hourly weather data from Niigata Prefecture, one of the heaviest-snowfall regions in the world despite its winter mean temperature above 0°C. For this analysis, we introduced the idea of WPCs, which show the distribution of winter precipitation against air temperature, to understand the dependence between the precipitation and possible changes in regional climatic conditions and thereby to better understand possible changes in snowfall in the future. The analyses showed that two types of WPC exist in the region: the single-peak (SP) type, which has a sharp peak (Ts ) at ∼0°C, and the multiple-peaks (MP) type, which has several small peaks including one that is located at ∼0°C. The peak of the SP type moved only slightly despite annual fluctuations in the average temperature for winter precipitation (Tp ), whereas the highest peak (Ts ) of the MP type changed position with fluctuations in Tp although the peak near 0°C remained stable.
After considering the development of the 0°C isothermal layer due to the cooling effect of snow particle melting, we addressed the reasons for the existence of the two types of WPC. Our analyses indicated that the cooling effect of snow particle melting can decrease the surface temperature by ∼2°C under the general winter condition in this region. Thus, multiple peaks (MP type) will appear if the major peak of the WPC is located at a temperature sufficiently higher than 2°C. One peak will be the CP, which should be controlled by the climatic condition, and the other will be the peak at ∼0°C (P 0), which is caused by the cooling effect of snow particle melting. Thus, the CP will shift with year-to-year fluctuations of Tp. On the other hand, if the CP is located at ∼2°C, the peak will overlap P0 because of the cooling effect of snow particle melting, and only a single peak will occur and will be stable in spite of fluctuations in Tp (SP type). These analyses approximately correspond to measured results of the relationship between Tp and Ts under the conditions that Tp is between 0°C and 4°C and Ts appears near 0°C and shows independence from fluctuations of Tp . However, under other conditions, Ts shows a linear relationship with Tp .
Although the analyses in this study are preliminary, the results imply that snow conditions in the region of heavy snowfall along the Sea of Japan will likely exhibit more complex responses to global warming than previously considered because the melting of the large number of snow particles exerts a perceivable effect on the atmosphere.
Acknowledgements
We thank the JMA for providing the hourly meteorological datasets and R. Naruse for helpful discussion at the start of the analyses. We are also grateful for helpful suggestions from the members of the Snow and Ice Research Center. Helpful comments and suggestions from two anonymous reviewers and the scientific editor, Y. Kodama, are greatly appreciated. This work was supported by the Japan Society for the Promotion of Science (JSPS) KAKENHI grant No. 23710211.


