


1. Statement of the Problem
Research on the impact of ice on structures has increased considerably in the last ten years and numerous articles have been published on the subject. Most of this research has been, however, theoretical, and there has been little experimental data to support the results.
Two completely different modes of failure were found experimentally when an indenter penetrates into an ice sheet (Michel and Toussaint 1977). In the ductile mode, at low speeds, microcracks are formed in individual ice grains which multiply to form a plastified zone in front of the indenter, progressing in a regular manner and producing a continuous load variation. In the brittle mode, at high speeds, macrocracks are formed in front of the indenter extending away from it and giving a highly fluctuating load. In the transition zone both mechanisms are observed.
In many ways the ductile behaviour can he represented by the theory of elastic-plastic failure. But this does not appear to be the case for brittle fracture which combines the very complex processes of macro- and microcracking as well as buckling of the floating ice. This is the least known of the problems related to the impact of ice on a vertical-faced structure though it is a most important one for engineering applications. This question was the object of this experimental study.
In general, all research on this question is related to the earlier work of Korzhavin (1962) who suggested the following empirical relationship:
Where
In these equations, 2b is indenter width, C-i indentation coefficient, F total ice force (load), h ice thickness, m form coefficient (1 for a rectangular indenter), k contact coefficient (1 for full contact), p effective ice pressure, and o uniaxial crushing strength of ice obtained for similar ice on small samples.
Although Equation (1) is widely accepted with the relevant m and k values, the discussions centre around the adequate values to use for C- j and the choice of representative values for p. In Korzhavin’s original work the indentation coefficient and the ice strength were grouped in what he called the indentation strength σ i :
He then proposed that this indentation strength was decreased with increasing velocities and suggested a relationship in order to compute this value for different, velocities. However, many other authors found that the so-called indentation strength was an increasing function of velocity (e.g. Saeki and others 1978). Michel and Toussaint (1977) found experimentally that in the ductile range the indentation strength followed exactly the dependence of the uniaxial crushing strength of ice on strain-rate (or velocity). This function is shown on Figure 1.
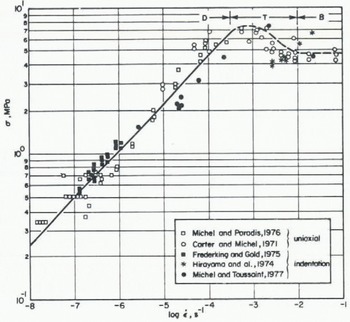
Fig. 1. General curve for uniaxial crushing and,indentation of S 2 ice at -10°C (α is strength and ε is strain-rate). A coefficient of 3 has been used to reduce the indentation data in the ductile zone (D) and transition zone (T), and 1.57 in the brittle zone (B). Refer to Reference MichelMichel (1978) for description of data.
Little is known, however, about the value that should be given to Ci in the transition and brittle range, which is of a broader practical interest.
The more widely held view is that Ci is a function of 2b/h. The value of Ci is usually taken to start at ~3 for very narrow indenters (i.e. 2b/h small) and to attain a value of 1 for large values of 2b/h. This was originally suggested by Reference Afanas’yevAfanas’yev (1972). Recent theoretical analyses used a limit plastic analysis with the upper and lower bound theorems (Croasdale and others 1977, Reference RalstonRalston 1978). For a narrow indenter, Croasdale and others showed that the problem reduces to that of a classical Prandtl indenter with Ci = 2.57 when using a failure criterion of the Tresca type. For large values of 2b/h the ice would fail by forming a wedge across the ice thickness as was originally proposed by Reference TrydeTryde (1973). The applicability of a plastic analysis to ice behaviour in the brittle range may be challenged.
In the ductile range, Michel and Toussaint (1977) carried out laboratory experiments on plates of highly anisotropie S2 ice. These plates, 81 × 81 cm, were held vertically in a press and were indented with flat indenters. They found that Ci was independent of 2b/h with the exception of very narrow indenters where the size of the ice grains became relatively important. The value of the indentation factor was then found to be close to 3 and this could be explained with the Hill theory of indentation in a perfect plastic material, using the Von Mises failure criterion. The computed value of Ci is then 2.97. They also showed that the experimentally observed dependence of the indentation factor on the width of the structure is caused only by the strain-rate effect on the yield strength of ice, in compression. This occurred only at low indentation speeds.
In the brittle range for the same S2 ice, Reference MichelMichel (1978) suggested Ci = 1.57, obtained from the perfectly elastic solution with the Tresca failure criterion. Such a value was proposed previously for all cases of ice impact by Reference KheysinKheysin (1961). This coefficient is also independent of 2b/h with this theory.
It is possible that the approach giving a value of Ci = 1 may be rationalized if the completely different failure modes for isotropie ice and columnar Si ice under conditions of plane stresses are taken into account, as explained in a recent paper by Reference MichelMichel (1981) and shown in Figure 2. Isotropie ice can easily fail by formation of wedges in the vertical plane (first proposed by Reference TrydeTryde (1973)), but S2 ice must first fail by indentation in the plane of the ice cover before it can shear across its thickness.
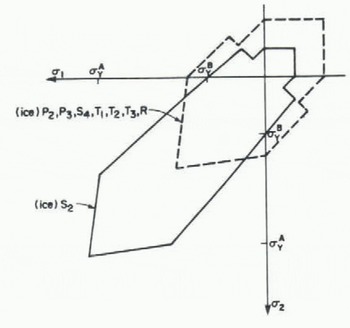
Fig. 2. Failure envelope for both columnar (full line) and granular ice (dashed line) under conditions of plane stresses. Ice types are indicated and and α2 are positive in the compression zone, αA is the strength to fail the ice across the plane and αB in the plane of the grains (Reference MichelMichel 1981).
In this paper we present new experimental data on the failure of floating ice sheets of S2 ice made in a laboratory tank, under a fast-moving vertical-faced indenter.
2. Laboratory Results
Twenty-seven tests were carried out in a cold-room water basin with a surface area of 4 × 4 m as shown in Figure 3.
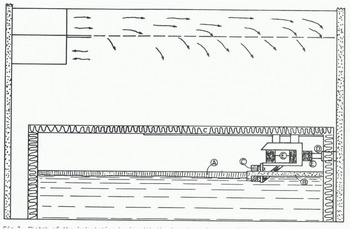
Fig. 3. Sketch of the indentation basin with the ice sheet in the cold room. A is the ice sheet, B the plastic foam to form the free edge, C the loading edge, D the piston, and E the load cells.
2.1 The experimental set-up
The basin itself was built within a steel frame acting as a loading press to which the ice sheet was attached. Its maximum capacity was 110 kN for an indenter 1 m wide and an ice thickness of 2.5 cm. The water depth was 60 cm. The ice sheet was produced by seeding, growing and, then, selective melting of the top layer in order to obtain uniform S2 ice without the random crystal orientation normally present on the top of natural S2 ice. Crystal sizes were, on average, H mm. One side of the ice sheet was free-floating and directly aligned with the initial position of the indenter. The hydraulic ram had a diameter of 6.35 cm and a stroke of 1.83 m so that more than one significant load event could be obtained. Three cells were used to measure the loading force in two different manners. A potentiometer measured the distances and an accelerometer the accelerations. The ram was operated with a maximum speed of 6.8 cm s−1 which gave computed indentation rates varying from 0.017 to 0.34 s−1. In this range the ice can normally be considered to act as a brittle material.
All measurements were recorded on a HP-1000 data acquisition system with an interval of 0.01 s between recordings.
2.2 Program of testing
All tests were carried out at an air temperature of 0°C to ensure a uniform strength within the ice sheet. Only S 2 ice was tested so that major parameters to be varied were those of the aspect ratio 2b/h of the indenter. Since both b and h could be combined in different ways, tests were made with constant values of 2b/h whilst varying b and h. The description of the 27 tests is given in Table I.
Table 1. Summary Of All Indentation Tests Made In 52

2.3 Results of tests
The results for all tests conducted are given in Table II. The characteristic length of ice for buckling analyses is ℓall other parameters have been defined previously. The uniaxial crushing strength was taken as 2.2 MPa from previous tests for this ice in the brittle range. Values for m and k in Equation (1) were both taken as 1 in the computations. These results are all shown on graphical form in Figure 4 giving Ci as a function of 2b/h.
Table 2. Results Of Tests Giving Peak Loads Amd Computed Indentation Coefficients
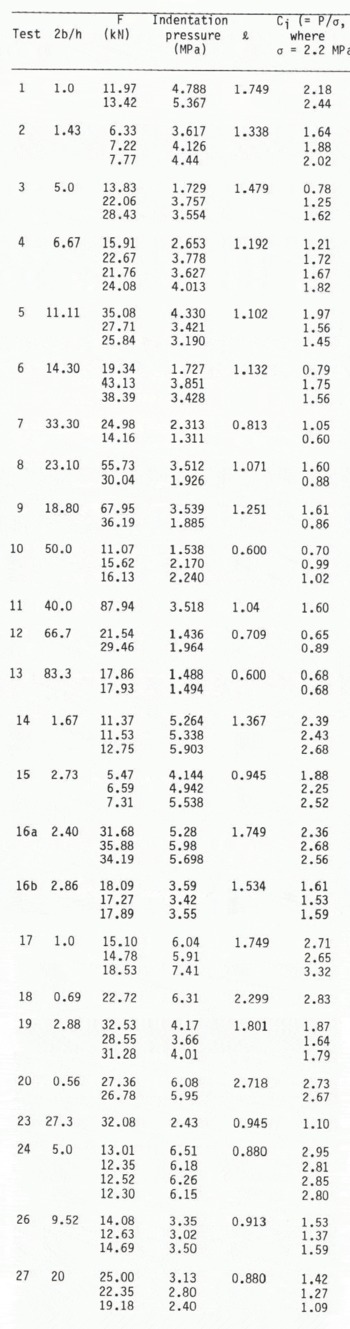
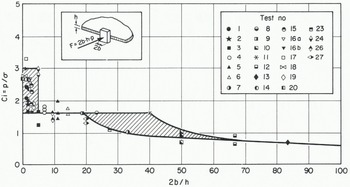
Fig. 4. General curve of results of the tests giving Ci as function of 2b/h, The crossed areas show unstable zones.
3. Interpretation of Results
For all tests the horizontal force was recorded and the broken ice sheet was reconstituted afterwards to determine the fracture lines. A film was also taken in each case to analyze and record the manner in which the ice failed.
The aspect ratio 2b/h was varied from 0.5 to 83 and four different modes of failure were observed. Although each mode was found in ranges of 2b/h which overlapped with one another, it is easier for description and understanding to separate each mode of failure within a specified range of 2b/h whilst keeping in mind this overlapping effect.
3.1 Failure by cleavage, 2b/h < 1
For very small indenters, as in test 1, the ice may fail by cleavage across its thickness. The terms of peeling or spelling may also describe this process. Usually, however, this type of failure is combined with extrusion.
In this case radial cracks first appeared at the corners of the indenter making wedge angles from 5 to 35° with the direction of motion. The ice was peeled in a dish-like fashion over the top third and the bottom third of the ice thickness.
A typical recording for test 1 is shown in Figure 6. The maximum force was obtained when the initial cleavage process occurred and the value for C¡ was found to be 2.4.
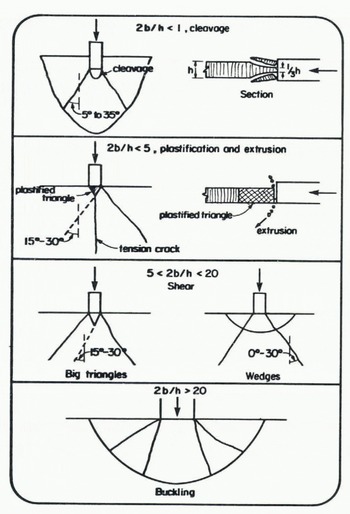
Fig. 5. Sketches showing the different mechanisms of failure of the S2 ice sheet in the brittle range for various values of 2b/h.
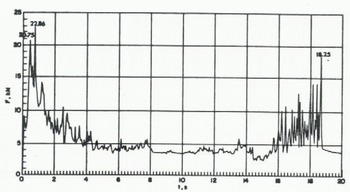
Fig. 6. Recording of loads for an ice sheet failing by cleavage (test 1).
The value of C¡ may thus be the experimental value of failure of columnar S2 ice across its thickness by cleavage. This has been found experimentally to be between 2 and 3 in the top range of ductile failure (Frederking and Gold 1975). After the first two peaks there was a large reduction in load as the peeling continued in the remaining section. This was also observed in tests that were previously carried out (Michel and Toussaint 1977).
3.2 Failure by plastification in a triangle and extrusion 2b/h < 5
This is the general mode of failure observed for small indenters, as in tests 2, 14, 15, 16a, 17, 18, 20 and 24. In these tests a triangle was first formed in front of the indenter by cracks making, on each side, angles from 15 to 30° with the direction of motion. Simultaneously, a tensile crack appeared at the vertex of the triangle in the direction of motion, as shown in Figure 5. The ice then plastified due to microcracking of the individual crystals within the triangle. This plastification was assisted by the loading system whose speed decreased throughout loading of the frame but increased as the load dropped. Finally, the plastified ice was blown up and down by extrusion in a thin layer just in front of the moving indenter and the process repeated itself once the indenter came again in contact with the remaining intact ice sheet.
A typical recording for test 2 is shown in Figure 7. The peak force was obtained during the extrusion process and appeared relatively constant from peak to peak for these tests. The maximum loads corresponded to C¡ varying between a wide range from 2.0 to 3.3. In this case, the value of C¡ can probably be related to most theories of the ductile behaviour of ice (Croasdale and others 1977, Michel and Toussaint 1977, Reference RalstonRalston 1978) that give an indentation coefficient close to 3.
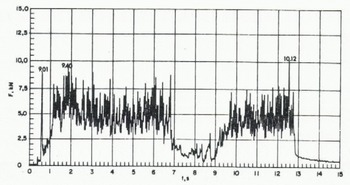
Fig. 7. Recording of loads for an ice sheet failing by formation of plastified triangles and extrusion (test 2).
3.3 Shear failure, 5 < 2b/h < 20
The series for intermediate size and large indenters was characterized by macrocracking of the ice sheet and can be represented by tests 4, 5, 11 and 26. In these tests, radial cracks originated initially from the corners of the indenter making angles from 0 to 30° with the direction of motion. These cracks propagated either outside to form wedges in the ice sheet or inside to form large broken triangles in front of the indenter. A major peak was recorded when these first cracks formed a triangle. At the beginning of each test there might be some ice extrusion just in front of the indenter but without noticeable plastification.
There was a drop in load immediately following the first crack formation. In one case of wedge formation, the first peak showed a higher intensity than the second one, which was caused by buckling of the wedge. This is shown in Figure 5. It then took a relatively long time until the indenter moved again to the intact ice sheet and started building up the load again. When the ice buckled, circumferential cracks were formed in the ice.
When a large triangle was produced in front of the indenter, it was then pushed over the remaining ice sheet with a smaller force by the indenter. Load build-up started again from the renewed contact with the intact ice. A typical recording is shown on Figure 8 for test 8, when a wedge formed followed by buckling, or in Figure 9 for test 5, when a triangle was formed instead.
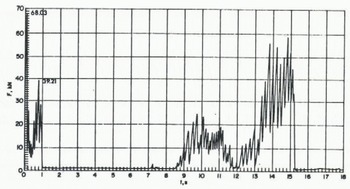
Fig. 8. Recording of loads for an ice sheet failing by shear with wedge formation and secondary buckling (test 5).

Fig. 9. Recording of loads for an ice sheet failing by shear with the formation of large triangles (test 8).
We believe that in all the tests in which triangles were formed the major event was the formation of the shear cracks at the corner of the indenter. When wedges were formed, shear was the controlling factor in only one case. From pure elasticity theory (Reference KheysinKheysin 1961, Reference MichelMichel 1978) Ci should then be 1.57 with the Tresca failure criterion. Measurements for all these tests gave Ci values varying from 1.53 to 1.97. We think that this small increase is caused by lateral friction on the ice by the indenter which prevents the ice from moving laterally. This produces shear cracks at angles up to 30° with the direction of motion, compared with zero for the elasticity theory, and slightly increases the computed value for Ci.
3.4 Buckling of the ice sheet, 2b/h ~>20
Partial buckling was observed for tests 3, 6, 8, 9, 12 and 23 and general buckling in tests 7, 10, 25, and 27. In general, radial cracks first formed from the corners and were followed by buckling with little interruption in the increasing load. There was also some frontal extrusion occurring at the beginning of loading. The maximum load was given by buckling. A typical pattern of cracking after buckling is shown in Figure 5, It shows the radial and circumferential cracks. General buckling was not preceded by the formation of radial cracks, but all processes occurred simultaneously.
Figure 10 shows the successive buckling loads as the indenter moved into large broken ice pieces towards the intact sheet.
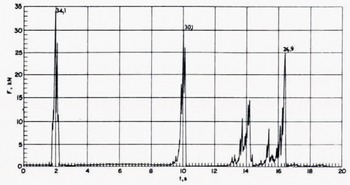
Fig. 10. Recording of loads for an ice sheet failing by successive buckling of wedges (test 27).
Values of Cj for these tests fall in a range from 0.68 to 1.40, This is an important reduction compared with values for shear failure. In this interpretation, account has been taken of existing theories on buckling as shown in Figure 11. The dashed line is the curve given by Sodhi and Hamza (1978) and Reference Nevel and PNevel (1980) for the general buckling load of a semi-infinite sheet by a square-edged indenter with a free edge. The equation for this curve is:
where F cr is the buckling load, γ is the specific weight of water, and ℓ is the characteristic length given by:

Fig. 11. Data results for buckling. Three theoretical curves are shown, the dashed line for a free edge (Sodhi and Hamza 1978), the full line for a hinged edge (Elhadi and Dhatt 1981), and the dotted line for a hinged 45° wedge (Reference KerrKerr 1978, 1981).
Here, u is Poisse’s ratio and E is Young’s modulus.
The upper full-1ine curve was obtained by Elhadi and Dhatt (1981) in a finite-element study for general buckling with a frictionless square-edged indenter with the ice hinged at the edge of the indenter. There is little doubt that this condition should be more representative than the condition of a free edge. In fact, the experimental data always show higher values than those from the curve given for a free edge, but they are still about 20% lower than the values given by the upper curve for a hinged edge. The dotted curve is the equation given by Kerr (1978, 1982) for partial buckling of a truncated wedge having a central angle ψ and a loading width of 2b. The equation in the case of a hinged end is:
The dotted curve in this equation was computed for an ice thickness of 2 cm and a central angle of 45°. It seems to represent most of the results well and intersects the shear failure line for 2b/h = 16. This transition value depends obviously on ℓ and is different for various ice thicknesses and characteristics. For thicker ice it moves to higher values of 2b/h and, in fact, the condition for general buckling becomes more critical.
4. Conclusions
It is surprising to observe that for such a simple phenomenon as indentation of a uniform sheet of S2 ice by a fast-moving square-edged indenter, four different failure mechanisms occur, depending on the aspect ratio, and only in the range of indentation rates in which ice would normally be considered to act as a brittle material. In the ductile range another completely different failure mode has been observed previously when microcracking activity alone controlled the process of ice deformation.
S2 ice is a non-isotropic type of ice which fails differently when loaded in the plane of the ice sheet then as opposed to it perpendicularly. If isotropie T1 ice (snow ice) had been tested, the failure modes would have been different again, as neither cleavage nor in-plane plastic flow around the indenter could occur. The ice would then have failed by shear across the thickness of the ice sheet giving a much lower value of Ci, closer to 1 as proposed initially by Reference TrydeTryde (1973) for large indenters.
Even natural columnar ice would behave in a different manner because of the random orientation in space of the c-axis in the top centimetres of the ice sheet. For an observer the top ice would then shear to the top but the bottom ice would fail in the plane of the ice sheet. Taking into account the extremely important effect of temperature on the crushing strength of ice, it is not surprising that ice has always been one of the most difficult materials to study and analyze even under simple mechanical loading conditions.
In summary, for practical purposes S2 would be more difficult to fail than other types of ice and would give values of Ci of the order of 3 for narrow structures with 2b/h < 5, under quick loading conditions. It would also produce Ci = 3 for low loading rates for all structure widths, under ductile conditions (Michel and Toussaint 1977, Reinicke 1980). In the brittle range, it will give values of Ci around 1.8 for structures of intermediate size with 2b/h >5, and a much reduced value of Ci that could be computed for buckling conditions, with higher 2b/h, depending on the thickness of the ice sheet.
Acknowledgement
Support for this study was provided by the Natural Science and Engineering Research Council of Canada.


