


1. Introduction
The present generation of basin-scale sea-ice ocean models incorporate a number of essential processes of the coupled polar air–ice–ocean systems. Dynamic–thermodynamic sea- ice components that simulate ice growth due to the atmosphere–ocean heat flux and ice transport and deformation in response to surface winds are standard in current global climate models. In general, simulation of the recently observed Arctic sea-ice extent loss has improved (Reference StroeveStroeve and others, 2012), whereas changes in sea-ice thickness are generally not captured well (Reference Langehaug, Geyer and GaoLangehaug and others, 2013). Also, global climate models have difficulty simulating the overall positive trend in Antarctic sea-ice extent, which, however, features great regional variations (Reference ParkinsonParkinson and Cavalieri, 2012).
Because sea ice prevents turbulent heat exchange between the ocean and atmosphere, only allowing a much smaller conductive heat flux, ice growth is largest in open-water and thin-ice areas, and smaller in areas with thicker ice. Ice growth in open-water areas has up to now been simulated using simple assumptions that do not represent the complexity of ice growth processes as they occur in nature. In this paper, we therefore suggest a new parameterization for grease-ice formation in open water, and demonstrate its effect in simulations covering a climatologically normal Arctic winter.
Grease ice is a mixture of free-floating frazil ice crystals and sea water (Reference Martin and KauffmanMartin and Kauffman, 1981). When sea water is cooled below the freezing point and the surface layer is significantly turbulent, sea-ice crystals form within the water column and settle as frazil or grease ice at the ocean surface. Later in the freezing process, the grease ice congeals, and forms – in the presence of wind and waves – pancake ice. Pancake ice floes are small round pieces of solid sea ice, which often are still surrounded by a sluggish grease-ice layer (Reference WadhamsWadhams and Wilkinson, 1999).
Observations of grease and pancake ice from Arctic and Antarctic waters are limited because formation takes place in locations that are logistically challenging to reach, and it is generally difficult to work during open-water freezing situations in polar waters. Observations from an Arctic polynya, which had a grease-ice layer thickness of up to 0.7 m (Reference Smedsrud and SkogsethSmedsrud and Skogseth, 2006), added to the first few grease-ice observations of Reference Martin and KauffmanMartin and Kauffman (1981). Observations of pancake ice since Reference WadhamsWadhams and Wilkinson (1999) exist from the Weddell Sea, Antarctica (Reference Doble and WadhamsDoble and others, 2003). Formation of grease and pancake ice is probably more prominent in Antarctica due to the large seasonal ice formation and the high wave activity of the Southern Ocean. Reference EickenEicken and Lange (1989) found the volume fractions of granular ice (grease and pancake ice) and columnar ice to be about the same in the Weddell Sea, whereas the ratio is more like 1 : 4 in the Arctic (Reference Eicken, Lensu, Leppäranta, Tucker and SalmelaEicken and others, 1995).
Observations of grease and frazil ice have been obtained from laboratory investigations (Reference Daly and ColbeckDaly and Colbeck, 1986; Reference Martin and KauffmanMartin and Kauffman, 1981; Reference SmedsrudSmedsrud, 2001). These have, for instance, partly been used in polynya modelling (Reference Biggs, Morales Maqueda and WillmottBiggs and others, 2000). We suggest using recent laboratory experiments (Reference De la Rosa, Maus and Kernde la Rosa and others, 2011) as a guide to the transition from grease ice to pancake ice, i.e. solid sea ice.
Detailed numerical studies involving frazil ice dynamics also exist (Reference OmstedtOmstedt, 1985; Reference Svensson and OmstedtSvensson and Omstedt, 1998; Reference mpf and BackhausKämpf and Backhaus, 1999; Reference SmedsrudSmedsrud, 2002), using grid resolutions as fine as 1–10m. Frazil ice models require that a size spectrum of frazil ice crystals is resolved, where small crystals grow faster than larger crystals. Detailed processes at the millimetre scale (e.g. collision between crystals, diffusion and differential rise of individual size classes) are, however, beyond the scope of basin-scale models. The same holds for the interaction with waves, although some coupled regional sea-ice models have started to resolve wave processes. The transition between regional and basin-scale models is fluent, but when we use the term basin-scale model here, we think of a model with a horizontal resolution larger than ∼10 km.
1.1. Grease-ice characteristics from observations
A parameterization of the grease-ice layer thickness and area needs to reflect available field measurements. Unfortunately, limited data are available so far (Reference Martin and KauffmanMartin and Kauffman, 1981; Reference Smedsrud and SkogsethSmedsrud and Skogseth, 2006). Nevertheless, these data support basic grease-ice characteristics that can be incorporated into any sea-ice model. The transition from grease ice to solid sea ice can further be based on laboratory experiments (Reference De la Rosa, Maus and Kernde la Rosa and others, 2011), and earlier process models of pancake ice formation (Reference DobleDoble, 2009).
In the natural environment, individual frazil crystals grow, and are mixed downward by local turbulence until their buoyancy becomes stronger than the downward diffusion. A grease-ice layer forms, which damps the local turbulence and surface waves, and gradually starts to congeal from the top downwards.
The lower bound on observations of Arctic grease-ice bulk salinity is 21.5 (Reference Smedsrud and SkogsethSmedsrud and Skogseth, 2006). The salinity range is limited by this minimum and that of the original sea water. This implies that the grease ice consists of a major portion of sea water, and a smaller portion of frazil ice crystals, which do not include any salt. The calculated range of frazil ice concentration in the grease-ice layer ranges from 16% to 32% (Reference Smedsrud and SkogsethSmedsrud and Skogseth, 2006). This volume concentration may vary in time depending on, among other things, heat exchange, wave motion and grease-ice age.
The mean frazil volume concentration of the grease ice found around Svalbard was 25.3% (Reference Smedsrud and SkogsethSmedsrud and Skogseth, 2006). This is within the range of earlier values from laboratory experiments. The range of 14-29% is consistent with the values in Reference Martin and KauffmanMartin and Kauffman (1981) when a correction for the sea-water content of the grease ice is made as noted by Reference Smedsrud and SkogsethSmedsrud and Skogseth (2006). It also agrees with the 2 2% mentioned by Reference Wongpan, Langhorne, Dempsey, Hahn-Wornle and SunWongpan and others (2015). We suggest applying a constant frazil ice concentration of 25% as a reasonable approximation for regional to basin-scale ocean models. This implies a bulk grease-ice density of pg = 0.75pw + 0.25pi ∼ 1000 kg m 3, using p w = 1 0 2 7 kg m3 and pi = 917 kg m 3 . Varying densities for ocean water and sea ice used in individual sea-ice ocean models may lead to small differences in bulk grease-ice density.
Assuming that grease ice consists of ∼75% sea water, it has a surface temperature close to that of its water fraction. Reference Skogseth and NilsenSkogseth and others (2009) measured supercooling of 0.040°C below the freezing point at the upwind edge of an active polynya forming grease ice downwind. To the best of our knowledge, this level of supercooling seems to be representative of the maximum surface supercooling driven by heat loss.
Grease ice appears as grey in the visible spectrum (Reference SmedsrudSmedsrud, 2011, Fig. 1), and an albedo between that of open ocean (∼0.1) and thicker solid ice (∼0.5; Reference Perovich and PolashenskiPerovich and Polashenski, 2012) would be expected. Generally the newly formed ice needs to be thick enough to support a snow cover before the albedo rises above this level. An approach similar to the grease-ice density calculation therefore seems reasonable: agrease = 0.75awater + 0.25aseaice ∼ 0.2. Grease ice is expected to melt rapidly when the sun rises in spring. Therefore, effects of albedo changes, due to the difference in albedo between grease ice and open water, can be assumed insignificant.

Fig. 1. Relevant processes for the grease-ice parameterization. The sketch represents a gridcell in a basin-scale model where two solid ice thicknesses (h 1 and h2) are initially present at t = 0 hours. The ice then experiences divergence/export until t= 1 hour, and does not move afterwards. Heat fluxes are present all the time but are only indicated for t = 1 hour and t = 2 hours. A salt flux occurs between t = 2 hours and t = 26 hours. With respect to the heat flux, grease ice contributes to the open-water area fraction a 0. Pancake ice is modelled as new solid sea ice. Pancake thickness (h 1) should thus be merged with h1 after the growth sequence (t = 27 hours), and new pancake area (a 1 ) contributes to the solid ice area a tot = a '1 + a1 + a 2.
1.2. Grease ice in common basin-scale models
In most sea-ice ocean models frazil ice forms instantly in open water when the net ocean-to-air heat flux drives the ocean temperature below the freezing point. This ice growth prevents the ocean from becoming supercooled and is a reasonable approximation as noted above. In these basin-scale models, frazil ice also becomes solid ice instantly, which closes off the open-water area and leads to an instant reduction in atmosphere-ocean flux exchange. Instantly adding the frazil ice to the solid ice mass disregards the accumulation of frazil ice crystals into a grease-ice layer, which still allows for greater heat loss from the ocean. Because under favourable conditions grease ice may persist for days before it turns into solid ice, hence affecting the heat flux, we recommend resolving grease ice in a separate ice (thickness) category in the sea-ice ocean model. Before outlining our new grease-ice parameterization we first give a brief overview of various representations of sea-ice formation in current ocean models. The new parameterizations we suggest build on these in a constructive manner.
The growth of ice in open water and the fraction of thin ice during winter are key elements of any sea-ice model. Reference HiblerHibler (1979) argued that loss of open water should depend on the formation rate f(0) (md–1) of new ice in open water, and defined a critical ice thickness h0 = 0.5 m (also known as lead-closing parameter) to distinguish between thin and thick sea ice, with the thin-ice area counting as open water. This definition produces a time constant, T 0 = h0/f(0) (days), that controls the exponential decay of the area of open water a 0 over time:
leading to
Here a 0(t) is the area of open water present at time t. Reference HiblerHibler (1979) used seasonal growth rate estimates, with f(0) = 0.1 m d 1 for winter conditions, yielding T 0 ∼ 5 days.
Rapid open-water ice growth can, under natural conditions, only take place through frazil ice formation, producing a grease-ice layer of a certain volume. In a model, the difficulty arises how this newly formed ice volume should be distributed between growth in ice thickness and growth in area. In Reference HiblerHibler (1979) the frazil ice volume is transferred from the open-water (or thin-ice) category to the thick-ice category whenever the critical ice thickness h 0 = 0.5m is exceeded. In practice, most models apply an ice thickness of h0 to compute the ice area covered by newly formed ice from the frazil ice volume. In a different approach, Reference Mellor and KanthaMellor and Kantha (1989) used a tuning parameter, Φ F = 4, to partition the ice growth in open water between increases in sea-ice thickness and area. However, considering the enormous changes Arctic sea ice is currently undergoing (e.g. Reference ComisoComiso, 2012; Reference JeffriesJeffries and others, 2013), the validity of constant parameters derived decades ago may be questioned.
Reference HiblerHibler (1979) used a model time step of 1 day, but the spatial resolution of sea-ice ocean models has increased in recent years, necessitating a decrease in the time step. As h0 is somewhat time-step dependent if interpreted as the initial thickness of newly formed ice, smaller values are common nowadays (e.g. h0 = 0.05 m is used in the CICE model (Reference HunkeHunke and Lipscomb, 2010)). In this case an open-water ice growth rate of 0.1 m d 1 yields a time constant T 0 of ∼0.5 days with the open-water area decaying in a similar way.
Most advanced in respect of grease ice is the current Louvain-la-Neuve Sea Ice Model Version 3 (LIM3) (Vancop-penolle and others, 2009), which includes the assumption that new ice formed in open water has a variable thickness h0 ranging between 0.05 and 0.15 m. Their h0 depends nonlinearly on wind speed, ice velocity and pack-ice thickness, and is based on a theoretical polynya model (Reference Biggs, Morales Maqueda and WillmottBiggs and others, 2000) validated with the laboratory experiments of Reference Martin and KauffmanMartin and Kauffman (1981). This approach resembles high-resolution polynya models that use a frazil collection thickness, which is the maximum thickness of the frazil layer at the leeward edge of the polynya (Reference Drucker, Martin and MoritzDrucker and others, 2003).
Here we propose a grease-ice parameterization that not only incorporates a wind- and current-speed-dependent layer thickness but moreover features the grease-ice layer volume as a prognostic variable. The approach for the layer thickness presented in Section 2 builds upon a formulation by Reference SmedsrudSmedsrud (2011) and is based on field observations. In Section 3 we present test results from implementations in a one-dimensional (1-D) column model and a three-dimensional (3-D) coupled sea-ice-ocean model. We then summarize our conclusions.
2. A New Parameterization for Grease Ice
The explicit description of a grease-ice layer in a basin-scale numerical model can focus on the grease-ice volume V g, or mass V gPg, as the only prognostic variable. The layer thickness hg is highly variable and strongly depends on the surface wind stress, as discussed below. The grease-ice area, or area fraction if Vg represents volume per gridcell area, is determined from the volume divided by the actual layer thickness a g = Vg/hg. As stated above, the grease-ice density is determined by ocean and frazil ice densities. We assume that the grease-ice mass drifts with the surrounding solid sea-ice mass as a continuum, which has velocity Ui. Here the only source of grease ice is new ice that formed in open water, and its sinks are solidification, melt, and complete compaction of the surrounding pack ice:
where G i,ow > 0 is sea-ice growth rate in open water due to a heat flux from the ocean to the atmosphere, which would supercool the ocean. The second term on the right-hand side is the sink of grease ice by solidification, which is prescribed by a timescale Ts and is discussed in more detail below. The last term describes the melt of grease ice proportional to the melt of solid sea-ice volume Vi, with Mi < 0 the total melt rate of solid sea ice. Additionally, complete closing of all open water in a gridcell due to convergent motion of the solid sea ice is assumed to cause all grease ice in the respective area to solidify instantly.
The impact of grease ice on ocean surface processes is much smaller than that of a solid sea-ice cover. Damping of surface waves and an increase in albedo are the major effects. In contrast to a solid sea-ice cover, the reduction of heat and mass exchange between ocean and atmosphere by a grease-ice layer is negligibly small. In essence, for the fraction of the gridcell covered by grease, fluxes should be modelled the same way as for open water. This ‘unrestricted’ flux to the atmosphere should last until the grease-ice layer starts to solidify, or congeal.
2.1. Proposed grease-ice growth sequence
A few basic assumptions are made to develop a useful parameterization for grease ice. Figure 1 shows a sketch of the growth sequence in a single gridcell. In this case we assume that solid ice of two different thicknesses h 1 and h2 is already present. Time intervals t are given for orientation, are based on observations and do not necessarily represent a model ‘time step’.
The open water created by divergent ice motion at t = 0 is exposed to a cold and dry atmosphere typical for winter conditions. The open-water heat flux, F0, is significantly higher than the conductive heat fluxes F 1 and F2 through solid sea ice. F 1 is larger than F2 because h 1 < h2, as the conductive heat flux through solid sea ice decreases with increasing ice thickness. All open-water ice formation from t = 1 hour onwards is grease-ice growth. We further assume wind and currents are strong enough to produce hg ∼ 0.5 m (t = 2 hours; Fig. 1). The grease-ice layer now covers an area fraction a g with a 0(t = 2 hours) = a 0(t= 1 hour) a g. In the case of further heat loss from the ocean, i.e. continuous freezing conditions, the grease-ice volume (V g) becomes solid ice of volume V i over time:
The timescale of grease-ice solidification Ts is similar to that of open-water reduction T 0 in Eqn (2). Observations from the field (Reference DobleDoble, 2009) suggest an ‘age threshold’ of 24 hours before the transformation from grease to pancakes starts. More detailed observations from laboratory experiments suggest a 50% loss of grease-ice area to solid pancake ice within 24 hours, once the transition has started (Reference De la Rosa, Maus and Kernde la Rosa and others, 2011). Hence, we suggest using Ts = 1.44 days in Eqn (4). A sensitivity study of this value is performed in Section 3.3.5.
For models with multiple ice thickness categories the solidified grease-ice volume could either be tracked in a separate pancake ice category or merged with the thinnest solid sea-ice category so that the area-weighted sum of h 1 and h 1 yields a new ice volume V 1 (Fig. 1).
2.2. Grease-ice thickness
Observations suggest a nonlinear profile for the grease-ice distribution in a lead with increasing thickness toward its lee side. This means that areal extent and mean thickness of the grease-ice layer are both linked by the area, or cross-sectional volume, of the profile. We follow Reference SmedsrudSmedsrud (2011) and compute the mean grease-ice layer thickness hg as a function of grease-ice volume and surface stresses (wind stress ra and stress from currents rw), which push the grease ice toward the lee side of the lead:
Here Vg is the grease-ice volume per gridcell area (m3 m 2 ) and L the dimension of the gridcell. We suggest computing L as the geometric mean, i.e. the square root of the gridcell area. Note that Reference SmedsrudSmedsrud (2011, his eqn (10)) uses grease-ice volume per unit width (m3m1 ) . We acknowledge that including the factor L to transfer the work of Reference SmedsrudSmedsrud (2011) to a 3-D model yields a model-grid-resolution dependent grease-ice layer thickness. We leave this for later improvement when more extensive lead statistics are available from observations. Further, Kr is the resistance force of the grease ice towards further packing, and Reference SmedsrudSmedsrud (2011) found that a value of Kr = 1 0 0 N m 3 best represented available field data. Finally, both wind and ocean currents act to herd the grease ice towards the lee side of the lead. In most models fa and fw are readily available. Alternatively, they can be computed from quadratic drag laws fa = pa C a|U a|U a and fw = pw C w|U w U i | (U w U i ), using common estimates of mean air density pa = 1.3 k gm 3, air-water drag coefficient C a = 1.3 x 1 0 3 (Reference SmithSmith, 1988), water density pw = 1027 kg m 3, and ice-water drag coefficient C w = 5.5 x 1 0 3 (Reference McPheeMcPhee, 1975). The grease layer thickness then varies with the 10 m wind velocity U a (ms1 ) and the undisturbed current velocity Uw U i relative to the ice drift. Because of the diagnostic character of Eqn (5) the grease-ice layer responds instantaneously to the applied stresses: for stronger winds and currents, the grease-ice layer will be thicker, and the open-water fraction will persist longer, whereas the grease ice will spread out and create a thinner layer in calm conditions. Together, Vg and hg determine the present grease-ice area a g = Vg/hg, which cannot exceed the available open-water area a0.
2.3. Grease-ice melt
The frazil ice crystals in the grease-ice layer have a large area relative to their volume, so grease ice melts very effectively. No grease ice is therefore observed during summer. In spring, all energy in the ocean available for ice melting in a gridcell should therefore first be applied to the grease-ice volume Vg before bottom melt of solid sea ice sets in. In case of coarser grid resolution, i.e. with gridcell dimensions of several tenths of km, the continuum may represent a much more heterogeneous ice and heat content distribution, so a proportional splitting between grease and solid ice melt may be applied as shown in Eqn (3).
2.4. Grease-ice temperature and heat flux
We are not aware of any field measurements of heat flux from a grease-ice covered ocean. Our choices in the model set-up are therefore based on a few results from a laboratory experiment (de la Rosa and others, 2011). The 24 hour long experiment showed that grease-ice surface temperature remains close to the freezing point (Tf) of the surface ocean. This can be approximated using the surface salinity and a constant in the freezing equation:
This is an example of the simplest possible linearization of the freezing point relation often used in sea-ice models. Reference De la Rosa, Maus and KernDe la Rosa and others (2011) measured a grease-ice temperature of 0.4°C below the in situ freezing point derived from the salinity at 0.5 m depth. Only after pancake formation started did the surface temperatures drop >1.0°C below the freezing point. The experiment also indicated that the heat flux remains fairly constant through the transition from open water to frazil, and onwards to pancake ice. The results of Reference De la Rosa, Maus and Kernde la Rosa and others (2011) support the notion that the surface temperature as well as the heat flux over grease ice remains the same as for open water, although grease ice has the potential to damp surface ocean turbulence. The heat loss from the ocean is only significantly reduced once a solid ice cover forms. Thus, we consider the surface temperature of open water, T w, and that of grease ice, T g, to be the same. Consequently, the heat flux from the grease ice and from the open water are also equal, and Fg = F0 (Fig. 1).
2.5. Grease-ice solidification
As grease ice solidifies, the frazil ice accumulates at the sea surface, separating from the sea water contained in the grease-ice layer. The newly formed solid ice layer is thus much thinner than the grease-ice layer, which consists of three-quarters sea water. However, some of the sea water between the crystals will be incorporated into the solid ice as brine pockets. In nature this brine loss is high initially and slows down over time, but for this parameterization we assume an instant salt drainage, i.e. a salinity adjustment within one time step. Thus, the thickness of the newly formed solid sea ice is not simply a quarter of the grease-ice layer thickness hg but depends on the bulk salinity of sea ice Si > 0 and the sea surface salinity S w . We calculate the initial thickness h'0 of solid ice newly formed in open water and leads as
For example, a grease-ice layer of 1 m thickness forming from sea water of salinity S w = 34.5 yields a solid sea-ice thickness h'0 = 0.39 m for a solid ice salinity S i of 5, and 0.53 m for a bulk salinity of 10 (with p i = 917 kg m 3 and pw = 1027 kg m 3 ) . Most basin-scale sea-ice models prescribe either a constant bulk salinity (commonly ∼5) or a constant Si/S w ratio.
3. Implementation and Testing
3.1. A note on simplified realizations
For some modelling purposes it might be desirable to keep computational costs as low as possible, which in the most extreme case would not allow for an explicitly simulated and advected grease-ice category. In this case we suggest carefully adjusting the sequence in which frazil ice solidifies in the model and calculating the heat exchange with the ocean in order to ensure that, to first order, grease enables the same heat flux as open water.
A further step would be to store frazil ice locally (either as ice volume or equivalent energy), neglect advection, but account for the characteristic solidification timescale of 24 hours (see Eqn (4)). This would be close to how open-water ice growth is handled today, with the difference that the solid ice forms after a delay instead of instantaneously. Nevertheless, the thickness of the new solid ice, and the area it covers, should depend on surface stresses exerted by winds and currents. All the grease that forms in a certain gridcell would in this case turn solid in that gridcell. This ‘non-advective’ approach is only suitable for models with relatively coarse grid resolutions of the order of 50 km or more because grease-ice advection within 24 hours is of the order of 10 km. However, for present-day high-resolution models (grid dimensions of 1-10 km) this is not the case because grease ice persists for up to 2 days, i.e. several model time steps. Moreover, differential sea-ice motion, including drift of grease within larger leads, or closing of leads by larger-scale convergence, complicates the situation. Thus, we do not recommend using such a non-advective approach to account for grease ice in 3-D models.
3.2. Implementation in a 1-D sea-ice model
In order to test the main effect of the grease-ice scheme described above we use the 1-D column sea-ice model 1DICE of Reference Björk and SöderkvistBjörk and Söderkvist (2002). 1DICE represents the Arctic sea-ice growth and decay over an average season and is forced by monthly mean observations, following the approach of Reference Overland, Turet and JohannessenOverland and Turet (1994). Moreover, 1DICE can be used in an uncoupled version with atmospheric forcing or a coupled mode (Reference Söderkvist and rkSöderkvist and Björk, 2004). We aim at quantifying the effect of an additional grease-ice category on sea-ice thickness and heat fluxes between the ocean and atmosphere. We apply a relaxation towards the Atlantic layer at 350 m depth, and no additional ocean heat transport (Reference Smedsrud, Sorteberg and KlosterSmedsrud and others, 2008).
Monthly mean values of the following forcing parameters are prescribed for all runs apart from those termed ‘Arctic’: shortwave and longwave heat flux, atmospheric air temperature, relative humidity of the air, snow albedo, snowfall and wind speed. We use the values given in Reference BjörkBjörk (1997, Table 1 ).
Table 1. Overview of model experiments with 1 DICE. The first four columns are daily average values for 31 October. Heat fluxes are averaged over all ice classes including open water and grease ice. h i is the mean thickness of all solid ice classes, and h g is the grease-ice thickness. Open-water area fraction is a 0, and grease-ice area fraction a g. Rightmost column is the winter mean heat flux from 1 September through 31 January
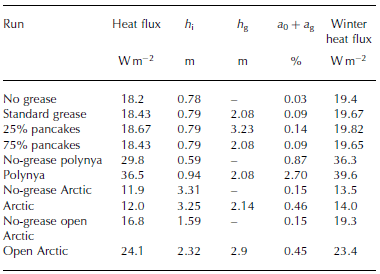
For the runs termed ‘Arctic’ the fully coupled atmosphere-ocean model including oceanic shelf circulation, and ridging and rafting processes is used (Reference Björk and SöderkvistBjörk and Söderkvist, 2002). Boundary conditions applied are Bering Strait inflow and atmospheric advection of heat as in Reference Smedsrud, Sorteberg and KlosterSmedsrud and others (2008). The ocean drag is set to zero in 1DICE, implying that grease-ice thickness is solely based on the monthly mean wind speed. 1DICE has a high vertical ocean resolution (∆z = 2m), and a large number of ice thickness classes (hi , with i < 40). The results represent spatial means over the interior Arctic Ocean being 9 x 1 0 6 km2. Because of the large horizontal scale no advection of grease ice is implemented here.
3.3. Tests with 1DICE
To illustrate the importance of the added grease-ice parameterization an idealized sea-ice cover is initialized with a mean thickness of 0.7 m. Two initial ice categories cover most of the gridcell area: thin ice (h 1 =0.5m and a 1=0.48) and thick ice (h2 = 1.0 m and a2=0.48) as illustrated in Figure 1. The model experiment starts on 1 September because at this time of year the net open-ocean to atmosphere heat flux changes from downward (heat gained by ocean) to upward (heat lost to atmosphere). A constant ice export is specified (28.9x10³ m2 s 1 ), meaning an export of 10% of the total sea-ice area per year. This is similar to the average annual Arctic Ocean ice export of ∼920 000 km2being close to 10% of the Arctic Ocean area of ∼9 x 1 0 6km2 (Reference Kwok, Cunningham and PangKwok and others, 2004). Results are mostly discussed for the first 60 days, until 31 October.
3.3.1. No grease
In this run, open water quickly freezes over, but open water also forms constantly anew due to the ice export in each time step. The rate of new ice formation is large, so the fraction of open water remains small and constant throughout the experiment (Table 1; Fig. 2). The growth rate of ice in open water increases almost linearly from zero to f0 = 0 . 1 7 m d 1 until 31 October.
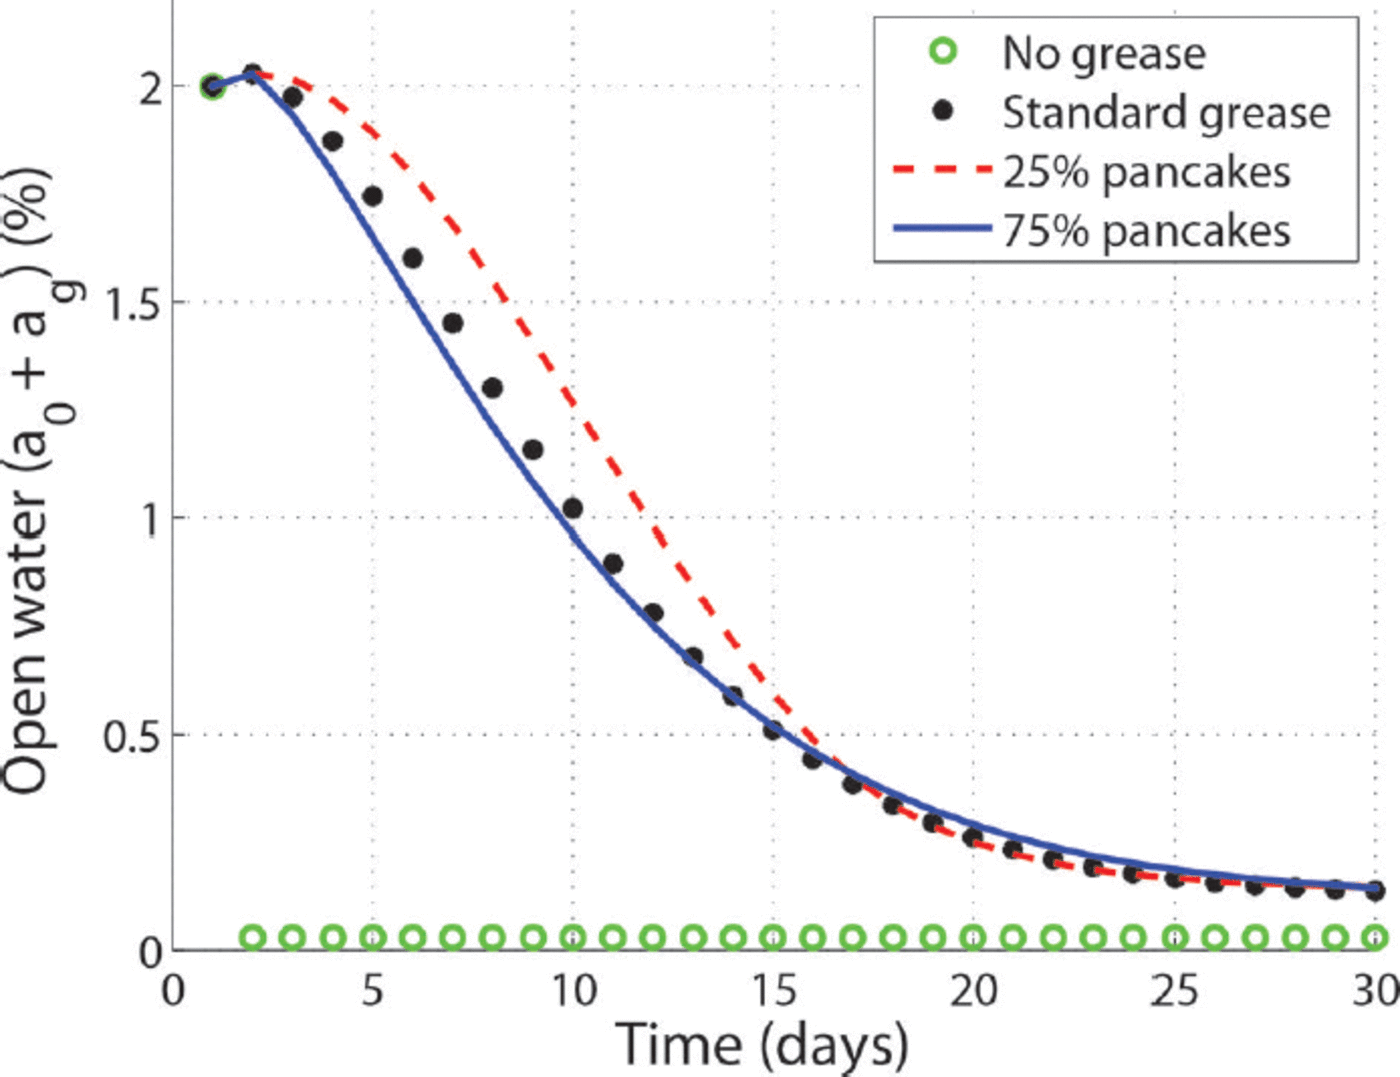
Fig. 2. Open-water area fraction for different 1 DICE model runs. In all cases except for ‘no grease’ the concentration displayed is the sum of the open-water (a 0) and grease-ice (a g) fractions. ‘No grease’ produces a constant open-water fraction as low as 0.03%. The grease-ice parameterization increases the open-water area fraction showing an exponential decline in time as grease turns into pancake ice. The sensitivity to the timescale (T s) is illustrated by the 25% pancake and 75% pancake runs.
The open-water ice growth results directly in a new solid ice class h 1. This new ice class initially does not merge with the thicker ice classes, but becomes the new h1 ice class. Thicker ice transfers to h2 and h 3. After 2 months h 1 reaches 0.32 m, resulting from the accumulated solid ice growth over this time as described in Reference Björk and SöderkvistBjörk and Söderkvist (2002). The average heat loss to the atmosphere is 1 6 W m 2 over the 60 days, increasing from 1 4 W m 2 to 1 8 W m 2 at the end of October (Table 1). At this stage there is no solar radiation, and heat fluxes from open-water areas exceed 400 W m 2 . Over open water the sensible heat flux, the longwave radiation and latent heat fluxes are all significant and contribute with >100 W m 2 each. The mean ice thickness has grown to 0.79 m (Table 1) over these 2 months, and 150 000 km2 of ice were exported.
3.3.2. Standard grease ice
We now include the grease-ice parameterization with the same set-up and forcing as the ‘no grease’ run. This basically increases a 0 + a g compared to the a0 of the ‘no grease’ result as shown in Figure 2. Ocean to atmosphere heat fluxes increase accordingly (Table 1). The area a 0 + a g decreases gradually over 30 days from the initial 2% to a steady level three times larger than without grease ice (Fig. 2).
Figure 3 shows that the total ocean to atmosphere heat flux increases by ∼0.5 W m 2 as a result of the added grease-ice parameterization. The difference between ‘no grease’ and ‘standard grease’ is mainly the open-water heat flux, reaching a maximum of 1.5 W m 2 after ∼8 days (Fig. 3). There is no change in the open-water to air flux per area of open water, but as the open-water area increases, the total flux increases, too. The heat flux from open water remains higher than in the ‘no grease’ run throughout the 60 days, but, after ∼30 days, compensating changes in the heat flux through the solid ice classes are of the same magnitude. Note that for the new thinnest solid ice class, the heat flux (F1) is smaller for the ‘standard grease ice’ than for ‘no grease’, because there is a smaller area of this thin solid ice. The mean solid ice thickness is also thinner for ‘standard grease’. The excess heat flux has thus not produced solid ice, but grease ice. The grease-ice layer starts out at h g∼1.0m, and grows another metre over the next 2 months. When solid ice forms from the grease ice it is therefore 0.25-0.5 m thick.

Fig. 3. Change in heat flux due to the new grease-ice parameterization. Heat fluxes are area-weighted by the respective area fraction (ai). The thick solid green line shows the difference for the total heat flux from ocean to atmosphere (‘Standard grease run’ - ‘No grease’). The major difference over the first weeks is caused by the flux over open water (F0 + F g)|Standard grease F 0| Nogrease, whereas there is a smaller difference for the heat flux through the thicker solid ice classes (F1, F2 and F3).
The difference in heat flux caused by the grease-ice parameterization may seem small, but represents an average over the Arctic Ocean. Integrating the 0.5 W m 2 over the Arctic Ocean total area of ∼9 x 1 0 6 km 2 and 6 months produces an additional net heat loss of 79 x 1018 J. This heat compares to freezing, or melting, a 1 m thick ice cover of ∼334 000 km2, comparable to 5 months of Fram Strait ice area export (Reference Kwok, Cunningham and PangKwok and others, 2004).
3.3.3. Polynyas and grease ice
The effect of the new parameterization increases with the rate of ice export, or divergence, of the ice cover. A typical polynya has an ice divergence rate several times larger than the Arctic Ocean mean. The Arctic mean divergence rate is ∼4 x 10⁻⁹ s–1 (Reference Kwok, Cunningham and PangKwok and others, 2004). For comparison, assuming a square polynya with sides of 10 km, making the area 100 x106m2, and a speed of 0.01 m s–1 perpendicular to one side would create an ice area export of 100 m2 each second, and a divergence of ∼1000 x 1 0 9 s 1 . We apply a polynya divergence of 200 x 1 0 9 s 1 here. The winter heat loss over open water in a polynya is 1 0 0 - 5 0 0 W m2 (Reference Morales MaquedaMorales Maqueda and others, 2004), which is an order of magnitude larger than the average value for the Arctic Ocean mostly covered by solid sea ice (Reference Serreze, Barrett, Slater, Steele and ZhangSerreze and others, 2007). The larger heat fluxes, caused by the larger divergence, are listed for the ‘no grease polynya’ run in Table 1 .
The grease-ice parameterization changes a polynya situation as illustrated by the ‘polynya’ run included in Table 1 . Heat loss to the atmosphere is increased by typically ∼ 8 W m–2 during the first month, and the open-water fraction a 0 + a g increases. Without the grease ice included, the open-water area quickly stabilized at 0.87%. With grease ice a maximum open-water area of 7% is reached after 13 days, relaxing to a steady level of 2.7% around ∼60 days. Because the atmospheric forcing and other parameters are the same, the mean grease-ice thickness hg is the same for the ‘polynya’ and ‘standard grease’ runs. However, the grease ice covers a much larger area and has a greater volume Vg.
3.3.4. Arctic applications
Fully coupled 1DICE runs have also been performed to study the impacts of the grease-ice parameterization more realistically. Boundary conditions and forcing applied in all ‘Arctic’ runs are as described earlier (Reference Björk and SöderkvistBjörk and Söderkvist, 2002). The overall effect of adding the grease-ice parameterization is similar to the more simplified runs of the ‘standard grease’ mentioned above, but a number of new interesting effects appear.
The ‘no-grease Arctic’ run is the same as the ‘base’ run described in detail in Reference Smedsrud, Sorteberg and KlosterSmedsrud and others (2008), initiated with a 3.2 m mean ice thickness, consisting of 41 different ice classes. The September through January mean heat flux is 13.5 W m 2 . With the grease-ice parameterization added this value increases by ∼0.5 W m 2 . The temporal evolution of the heat fluxes is shown in Figure 4 beginning 1 September.The increased heat loss is caused by a larger grease-ice and open-water area fraction of a 0 + a g ∼ 0.45% during the winter months. This is a significant increase of the open-water fraction compared to the ‘no-grease Arctic’ run, where a 0∼0.15% (Table 1). Most of the heat loss occurs as longwave radiation with, and without, the added grease ice. This explains why the response is similar in the fully coupled atmosphere and uncoupled atmosphere set-up of the model.
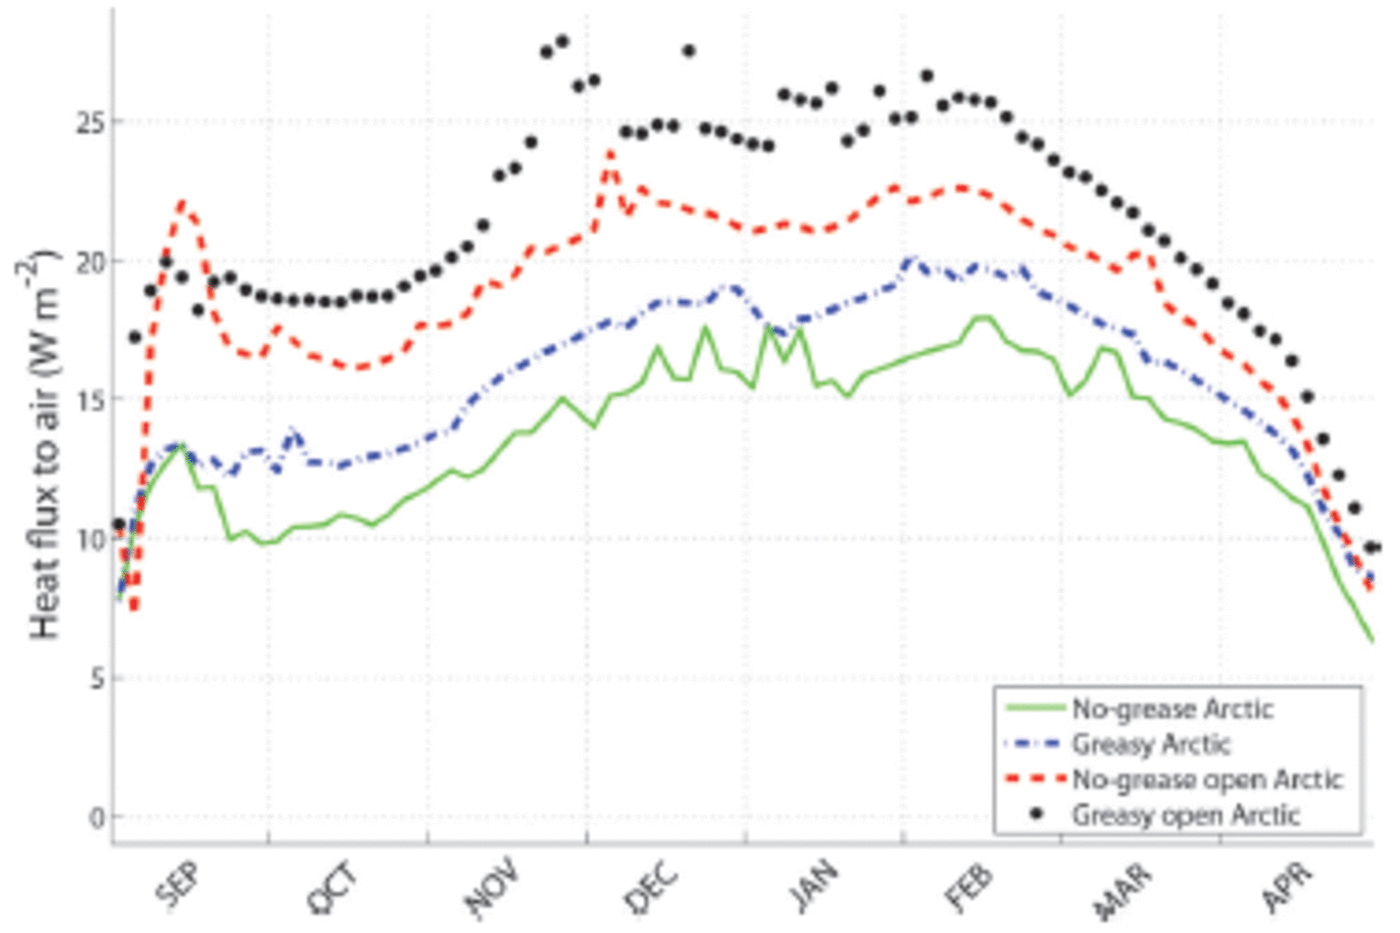
Fig. 4. Heat fluxes from ocean and ice to the atmosphere from fully coupled 1DICE model runs. The solid (green) line shows the result of the Arctic run with no grease-ice parameterization. The dash-dotted (blue) line shows the effect of including grease ice. The heat loss is larger in the ‘open Arctic’ runs with larger initial open-water areas.
The summer sea-ice cover of the Arctic Ocean is experiencing a steady decline (Reference StroeveStroeve and others, 2012). The open-water area fraction has thus increased, so we have included two ‘open Arctic’ runs. These runs illustrate the effect of differences in initial solid ice concentrations on the grease-ice parameterization. The ‘open Arctic’ runs have five solid ice categories: (h 1 =0.5m, a 1 =0.3), (h 2=1.0m, a 2=0.3), (h 3=2.0m, a 3=0.2), (h 4 = 3.0m, a 4 = 0.1) and (h5 = 4 . 0 m, a5 =0.05).
The ‘open Arctic’ set-up results in an area-weighted mean ice thickness of 1.3 m, and 5% open water. Most of the extra open water freezes over during September, but the ‘no-grease open Arctic’ run has higher heat fluxes to the atmosphere throughout the winter than the ‘no-grease Arctic’ run (Fig. 4; Table 1 ).The additional heat loss occurs as a combined effect of the larger area of open water, and the thinner ice cover that ridges more effectively. The effect of the grease-ice parameterization for the ‘open Arctic’ is a further increase of the open-water area and accordingly also heat fluxes. At the end of October the heat flux is ̃60% larger in the case with grease ice. The difference remains until January as shown in Figure 4, and the mean heat flux has increased by ̃20% (Table 1).
3.3.5. Sensitivity of solidification in 1DICE
The grease-ice parameterization we present here is based on some parameters that have limited observational field support, especially the timescale for pancake ice formation. We used a solidification from grease to pancake ice of 50% within 24 hours, or T s = 1.44 days. The fraction of open water and grease (a 0 + a g) is lost by the growth of pancake ice (Eqn (4)), and thus depends on the exponential decay (Reference HiblerHibler, 1979). A different time constant leads to changes in heat flux and other quantities.
At day 60 (31 October) the ‘standard grease’ run has an open-ocean area of 0.09% using Ts = 1.44 days (Table 1). Using a longer time constant, T s = 3.5 days, in Eqn (4) corresponds to losing 2 5% of the grease to pancake ice in a day. This Ts is similar to the value used by Reference HiblerHibler (1979). Using this Ts, the ‘25% pancakes’ run, results in an open-water area fraction of 0.14% (Table 1).
In a similar way the open-water area fraction decreases faster in the ‘75% pancakes’ (T s = 0.72 days) run, and the difference lasts until day 15 (Fig. 2). There are also related differences in heat fluxes between the ‘25% pancakes’ and ‘75% pancakes’ runs (Table 1). The differences are smaller than ± 1% change in heat flux, but are still on the same order as the overall change of implementing the grease parameterization. The grease ice grows much thicker in the ‘25% pancakes’ run though, because it is permitted to grow for a longer time before it solidifies. Overall the results are not overly sensitive to the choices made, but improving this solidification process should be the focus of future work.
3.4. Implementation in a 3-D coupled sea-ice ocean model
In order to test the applicability of our new parameterization for common 3-D sea-ice models we run the Massachusetts Institute of Technology’s coupled sea-ice ocean general circulation model (MITgcm) as described in Reference Losch, Menemenlis, Campin, Heimbach and HillLosch and others (2010) with settings similar to their control simulation C-LSR-ns. That is, sea-ice dynamics follow Reference HiblerHibler (1979), and for thermodynamics the so-called zero-layer model of Reference SemtnerSemtner (1976) is used with surface heat flux calculations as in Reference ParkinsonParkinson and Washington (1979) and Reference Manabe and BryanManabe and others (1979). For sea-ice dynamics, only two categories are considered, open water and ice, though for thermodynamic calculations a uniform ice thickness distribution over seven categories is used, which depends on the mean ice thickness. This version of the MITgcm employs the lead-closing parameter h0 of Reference HiblerHibler (1979) with a default value of 0.5 m. We apply the model to a regional grid of the Arctic Ocean and surrounding seas north of 55° N with a horizontal resolution of ∼36km. Atmospheric boundary conditions are prescribed and taken from the JRA25 reanalysis dataset (Reference OnogiOnogi and others, 2007).
Grease ice is implemented using the tracer module of the MITgcm sea-ice component. However, grease ice is not a passive tracer but interferes with the thermodynamic calculations. The tracer package is simply a convenient way to advect the grease-ice volume and to account for grease-ice melt, which is assumed to be proportional to solid sea-ice decay as in Eqn (3). In the sequence of thermodynamic processes in each time step, the new frazil ice volume formed due to heat loss over open water is added to the grease-ice tracer volume instead of the solid ice volume. The transition of grease ice to solid ice incorporates the delay described in Eqn (4). Lateral growth of solid ice is computed using the grease-ice layer thickness from Eqn (5) to derive a variable initial solid ice thickness following Eqn (7), which simply replaces Hibler’s constant h0.
3.5. Tests with the MITgcm
We present results from four simulations with the MITgcm. The first is a reference run applying the default setting with a lead-closing parameter of h0 = 0.5 m as originally suggested by Reference HiblerHibler (1979) (hereafter referred to as REF50), which is a comparatively high value and can be viewed as an upper bound. More common in state-of-the-art sea-ice models are values between 0.05 and 0.15 m. We run an additional experiment REF10 with h0 = 0.1 m and a third one (R1) mimicking (almost) instant lead refreezing by choosing h0 = 0.01 m setting a lower bound. Finally, the new grease-ice parameterization is used in a fourth experiment named GRS. All four simulations begin on 1 January 1979 without any initial sea-ice cover. Ocean temperature and salinity are initialized using the World Ocean Circulation Experiment Global Hydrographic Climatology (WGHC) (Reference GouretskiGouretski and Koltermann, 2004). The simulated sea-ice cover is in equilibrium after ∼10 years. In the following we discuss results averaged from 1990 to 1999.
Figure 5a shows the annual cycle of Northern Hemisphere (NH) total sea-ice volume for each simulation, with the typical maximum in April and minimum in September. As expected, REF50 yields the greatest total sea-ice volume. The ice volume of R1 is 17% less, corresponding to a difference of 2.5-5.1 x10³ km3 in monthly mean total ice volume between these two reference runs. The total solid sea-ice volume of GRS ranges in between, exceeding that of REF10 by 5%. The annual cycle of the GRS run is in good agreement with estimates from the Pan-Arctic Ice Ocean Modeling and Assimilation System (PIOMAS) (Reference Schweiger, Lindsay, Zhang, Steele, Stern and KwokSchweiger and others, 2011) (Fig. 2 at http://psc.apl.uw.edu/research/projects/arctic-sea-ice-volume-anomaly/), which are often used as a reference. The NH total grease-ice volume has a pronounced annual cycle as well (dashed bold black line in Fig. 5a) but with a maximum of 40 km3 in December and a minimum in July, when it melts completely. While the total solid sea-ice volume shrinks further due to continued melt in the marginal ice zone (MIZ) of the Arctic marginal seas through August and into September, new grease ice begins to form within the pack ice of the high-latitude central Arctic Ocean, where a net heat loss already dominates. At its peak the total grease-ice volume is just 0.2% of the solid sea-ice volume and thus is negligible in terms of its contribution to NH ice mass.

Fig. 5. (a) Annual cycles of simulated monthly mean Northern Hemisphere (NH) solid sea-ice volume from MITgcm experiments R1 (dotted gray line), REF10 (solid gray), REF50 (dash-dotted gray) and GRS (bold black), as well as grease-ice volume from GRS (dashed black; y-axis on the right). (b) Annual cycle of simulated NH mean grease-ice thickness h g of Eqn (5) from 31 day running-mean filtered daily instantaneous output; the dashed line depicts + 2 standard deviations indicating both spatial and interannual variability. (c) Map of summer mean (31day mean: 16 August to 15 September) grease-ice layer thickness h g from daily instantaneous model output; note the logarithmic color scale. (d) Same as (c) but for winter (13 February to 15 March). All results are averaged over 10 model years after 10 years of model spin-up, which, with respect to the applied forcing, resembles 1990–99.
The overall NH mean thickness of the grease-ice layer varies between 0.09 and 0.32 m (Fig. 5b, bold line). Particularly in midwinter the layer thickness can exceed 1.10 m in some locations for short instances, as indicated by the dashed line of + 2 standard deviations. In general, loose-ice conditions favour a thick grease-ice layer, because, on the one hand, the continuous presence of open water due to prevailing divergent ice motion stimulates frazil ice formation and, on the other hand, grease ice can be quickly compacted into solid ice dynamically during events of strong convergence in the pack ice. At the end of summer, such loose-ice conditions prevail in large parts of the Arctic Ocean and monthly mean grease-ice layer thicknesses of 0.30–0.40 m are dominant (Fig. 5c). We present 31 day averages from mid-August to mid-September because the timing of peak early-fall grease-ice formation does not match exact months, as can be seen by the peak in mean grease-ice layer thickness at the end of August (Fig. 5b). These averages also exclude dates without any grease ice present. We find that grease-ice growth, peaking in late August, dips in September, when the interior Arctic solid pack ice becomes compact and significant amounts of frazil ice are then only formed in the MIZ, which migrates south during fall. In winter, the Arctic Ocean features a grease-ice layer of only 0.20 m and less on average (Fig. 5d). In this season, the thickest grease-ice layers are found in the Labrador, Greenland and Barents seas, where thicknesses reach 1.20 m and more in some instances. The simulated range of grease-ice layer thickness is in good agreement with observational data presented in Reference SmedsrudSmedsrud (2011).
A greater h 0 is associated with thicker but less extensive newly formed solid ice, i.e. slower lead refreezing and extended presence of open water. Accordingly, we find that the heat loss from open water leading to new ice formation is greater in REF10 than in R1 by up to 5 and 10Wm 2 in late summer and winter, respectively. The signature of a generally reduced sea-ice compactness due to a greater h 0 is clearly seen in enhanced heat loss all over the Arctic Ocean at the end of summer (Fig. 6a), whereas in winter the effect is limited to the MIZ (Fig. 6d). In fact, the oceanic heat loss over leads within the pack ice of the interior Arctic Ocean is near zero in R1 (not shown). A solid ice cover prevents turbulent heat exchange between ocean and atmosphere, and the conductive heat flux through solid ice is one to two orders of magnitude smaller than this exchange. Therefore, REF10 (and REF50) has a greater total sea-ice volume despite the compensating effect of enhanced bottom ice growth due to generally thinner ice in R1 (Fig. 5a).

Fig. 6. Differences in simulated ocean heat loss (Wm 2) associatedwith sea-ice growth in open water between MITgcm experiments R1 and REF10 (a, d), R1 and GRS (b, e), and REF10 and GRS (c, f) in summer (mid-August to mid-September, top row) and winter (mid-February to mid-March, bottom row). All panels show 30 day averages derived from 5 day mean model output averaged for 1990–99. Each row of panels has a common color bar on the right; note that scales differ for summer and winter.
In GRS grease-ice layer thickness is relatively small in the Arctic Ocean throughout the year, with values <0.40m. We suspect low wind speeds in summer and small grease-ice volume within the winter pack ice to be the reason. Although GRS features enhanced heat loss over open water in the interior Arctic in late summer compared to R1 (Fig. 6b), it is limited to the eastern sector and +3.5W m 2. This is significantly less than the increase in heat loss provoked by increasing h 0 to 0.10 m (cf. Fig. 6a and c). This shows that a constant parameter such as h 0 is rather powerful, as even a small frazil ice volume at very low winds is prescribed to form thick solid ice. In contrast, the grease-ice parameterization needs persistent strong winds to form thick solid ice: first to form a larger amount of frazil ice that accumulates in a grease-ice layer and then, 1–2 days later, to compact the grease ice to a thick layer. Otherwise, the grease-ice parameterization is likely to produce rather thin new solid ice similar to R1.
During winter the simulated grease-ice layer thickness exceeds 0.20m only in the MIZ. There, however, average layer thicknesses of >1.00 m are forced by strong winds, particularly in the Labrador and Nordic Seas. Note the simulated grease-ice layer thickness corresponds to about three times the thickness of solid ice formed from this grease ice (Eqn (7)). Thus, differences between GRS and both R1 and REF10 are tiny in the interior Arctic in winter, but GRS features greater open-water heat loss in the MIZ of the Atlantic side than any other experiment (Fig. 6e and f). Interestingly, GRS simulates a smaller grease-ice layer thickness on the Pacific than the Atlantic side, resulting in a smaller heat loss than in REF10 (but not R1). Simulating such regional differences is an advantage of the new grease-ice parameterization.
Finally, our results indicate that assuming a mean thickness of h 0 = 0.5m for newly formed solid sea ice in leads would be an overestimation. Based on our simulations we suggest that a value of 0.05–0.15m is much more appropriate for the interior Arctic. However, unlike our new grease-ice parameterization, a constant h0, despite yielding a reasonable total ice volume, does not take into account regionally varying sea-ice cover characteristics and changing wind forcing.
4. Conclusions
A new parameterization of grease ice for general circulation models with a sea-ice component has been presented and tested. Our new parameterization represents the major characteristics of grease ice: (1) a non-instantaneous transition from frazil to solid sea ice; (2) a delayed refreezing of leads within the pack ice that enables greater oceanic heat loss; and (3) an initial thickness of solid sea ice that depends on surface stress and grease-ice volume. Note that our parameterization only simulates the mean grease-ice properties over several square kilometers and hence cannot resolve the high spatial variability of observed grease-ice layer thickness (Reference Smedsrud and SkogsethSmedsrud and Skogseth, 2006). Observations that are incorporated into our parameterizations are instant frazil ice growth governed by surface heat loss, a ∼25% volume fraction of frazil in grease ice, a grease-ice layer surface temperature at the sea-water freezing point, and a delayed solidification of the frazil ice to solid pancake ice. The latter also delays the salt flux to the ocean as brine rejection only occurs during solidification.
The transfer rate of ice from grease to solid ice is prescribed so that ∼50% of the grease-ice volume is converted within 24 hours. This qualitatively resembles growth of pancake ice, but has little observational support from the field. Sensitivity tests with transfer rates of 25-75% within 24 hours showed that this conversion rate has generally limited impact, but further observational constraint would be desirable.
Using a 1-D column sea-ice and ocean model, forced by Arctic atmospheric monthly means, indicates that the new grease-ice parameterization increases winter ocean heat loss by 0.5-7 W m 2 . The ocean to atmosphere heat flux during freezing conditions increases because of larger areas of open water. During mean winter Arctic conditions, changes are moderate, ∼1 W m 2 . This is caused by relatively small areas of open ocean. Under stronger ice divergence, as in a polynya, the new formulation further increases the heat flux.
A simulation with a regional Arctic 3-D coupled sea-ice ocean model yields a mean grease-ice layer thickness of 0.10-0.30 m for the interior Arctic Ocean, and 0.40-1.10 m for the MIZ. By comparing this simulation to reference experiments with the same model but using a constant lead-closing parameter instead, we demonstrate that the new grease-ice parameterization stimulates frazil ice formation in open water, particularly in the MIZ, compared to a simulation in which the lead area is (almost) instantly covered by solid ice. The heat flux over open water is enhanced by up to 3–10 W m 2. Further, the grease-ice parameterization is capable of pronouncing regional differences, such as thinner grease ice and smaller heat loss over open water in the Pacific MIZ compared to the Atlantic MIZ in winter.
Although our numerical experiments are focused on the Arctic, we believe that the new grease-ice parameterization has even greater impact in Southern Ocean simulations, because Antarctic sea-ice motion is generally more divergent. Pancake ice and granular ice have often been observed in Antarctic waters, and the suggested parameterization should be of importance for Antarctic sea ice.
With the continuous reduction of the Arctic summer sea-ice cover (Reference ComisoComiso, 2012; Reference JeffriesJeffries and others, 2013) and associated increased seasonal ice growth, granular ice will likely become more common in the Arctic. In this respect, Arctic and Antarctic sea-ice formation may become more alike in the future. This increases the importance of incorporating grease-ice processes in global climate models, which aim to predict the sea-ice cover in both hemispheres.
The effect of the new parameterization increases with larger open-water areas. Therefore, the new parameterization has a greater effect in the MIZ and is expected to be of importance for simulations of the 21st century. The main difference between grease ice and solid sea ice is that grease ice still enables a direct heat flux from the ocean to the atmosphere, whereas a solid ice cover intersects this exchange. Implementing a realistic delay of grease-ice solidification in large-scale sea-ice ocean models is thus important for coupled simulations of ice-covered seas, in particular with increasing model grid resolution.
Acknowledgements
This paper has evolved over a number of years. K. Barthel, E. Hunke, A. Sirevaag and J. Debernard have all given helpful advice and suggestions, while P. Heimbach, J.-M. Campin and M. Losch provided great help in setting up the MITgcm, and the Massachusetts Institute of Technology, Cambridge, MA, USA, provided computational resources to conduct the simulations. We also thank two anonymous reviewers for helpful suggestions and corrections, and P. Langhorne and P. Heil for their huge editorial efforts.


 Open access