1. Introduction
Climate change influences sea-ice distribution through energy exchange in the earth’s climate system, and air–ice–sea interaction is one of the most important processes in the high-latitude southern ocean. the antarctic pack ice consists mainly of a seasonal sea-ice zone that exhibits remarkable variability on seasonal and interannual scales. reduction in pack-ice concentration and the retreat of the ice edge through drifting of floes or warm-water upwelling form a deep-ocean polynya accompanied by sensitivity changes in the surface wind fields and oceanic structures (e.g. Reference Comiso and GordonComiso and gordon, 1996). spatio-temporal variations in the hemispheric distribution and duration of antarctic drifting pack ice have been fairly extensively studied using satellite passive-microwave data (e.g. Reference ParkinsonParkinson, 1994, Reference Parkinson2002). moreover, the characteristics of ice extent have been discussed in relation to the hemispheric oscillation or phase propagation of anomalous features and patterns of atmospheric circulation such as the antarctic circumpolar wave (Reference White and PetersonWhite and peterson, 1996) and el niño–southern oscillation (Reference Kwok and ComisoKwok and comiso, 2002).
While much attention has been paid to antarctic pack ice, relatively little is known about landfast ice. landfast ice differs from pack ice in that it remains stationary. in spite of its significance as a possible sensitive indicator of climate change/variability, with the exception of Reference Murphy, Clarke, Symon and PriddleMurphy and others (1995) few studies have been carried out on long-term landfast ice variations near the antarctic continent. coastal landfast variability is closely associated with, and possibly reflects, the state of the wider antarctic cryosphere, including the ice sheet; the coastal ice environment interacts closely with ice shelves and floating glacier tongues (Reference F., Watanabe, Cho, Okamoto, Kikuchi and MuraiNishio and others, 1991). long-term and broad-scale monitoring of landfast ice distribution and behaviour, as well as the extent of drifting pack ice, is an important prerequisite for a better understanding of the antarctic climate and global change/variability.
In the present study, we investigate landfast ice variations in the lützow-holm bay (hereinafter denoted lh) region of east antarctica using satellite and in situ data. this is located at around 69˚ s, 38˚ e in east dronning maud land. possible factors responsible for observed drastic changes in ice conditions are discussed.
2. Data and Methods
The long-term distribution and break-up behaviour of landfast ice in the lh region is determined here using time series of cloud-free us national oceanic and atmospheric administration (noaa) advanced very high resolution radiometer (avhrr) satellite images together with information from ground surveys and flight observations obtained during japanese antarctic research expeditions (jares). fast ice is distinguished from pack ice in sequences of avhrr channel 4 thermal infrared images (wavelength 10.3–11.3 μm) with a spatial resolution of approximately 1 km. these data have been obtained by the receiving station at syowa station (69˚ s, 39.5˚ e) since 1980. pack-ice conditions and its distribution to the north have been derived from special sensor microwave/imager (ssm/ i) images of sea-ice concentration provided by the us national snow and ice data center (NSIDC; http://nsidc.org), and ice charts from the us national ice center (NIC). the nasa-team algorithm has been used in this paper to create the SSM/I ice-concentration images.
Other information has been obtained from ship navigation logs. the japanese icebreaker Shirase routinely makes the voyage to syowa at almost the same time every year: the outward voyage is made in mid-december, with the homeward leg in the second half of february in lh. furthermore, her cruise tracks are extremely similar for each mission, enabling estimates of interannual variability of the ice conditions in lh (Reference UshioUshio, 2004). information on ice thickness, snow depth and icebreaker ramming action are routinely collected in a standard fashion and recorded in the ship’s navigation log, with data extending back to 1983. in the present analysis, only data from the outward legs, or the early summer season, are used because ice conditions from the preceding winter season may be a remnant and are reflected in the subsequent summer data. although visual observations made by the crew are subject to observational variability and are of insufficient accuracy for absolute estimates, these data are useful when discussing ice-condition variability. regarding the icebreaker ramming data, the total number of rams for each cruise and the daily mean distances penetrated per ram action have been recorded for each cruise. the total number of recorded rams will probably include a bias due to factors such as perseverance in the trial ramming process and the choice of the ship’s course through heavy or light ice conditions as determined from high-resolution satellite data such as from the radarsat. therefore, only penetration distance data are used for the analyses here.
Variations in snow depth on the fast ice have been estimated from continuous measurements using snow stakes at syowa. the snow data are shown as relative increases from the initial surface for each year. surface wind and air-temperature data at syowa station have been analyzed in order to assess their impacts on fast-ice break-up events observed in the satellite data.
3. Results and Discussion
3.1. History of fast-ice break-ups
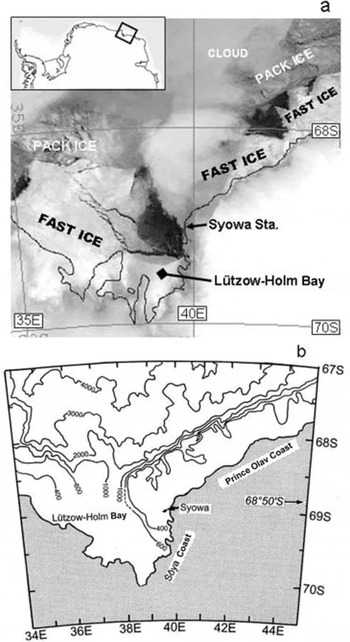
Under calm conditions the fast ice that forms in lh is almost flat, and the ice can grow to significant thicknesses, with a deep snow cover, when it remains in place over an extended period. in addition, the fast-ice region has many entrapped icebergs that drift from offshore and/or from the terminus of shirase glacier located at the southernmost point of lh. an example of a major fast-ice break-up event in lh, as detected in noaa avhrr imagery, is shown in figure 1. such a break-up usually occurs in late autumn to early winter, when the regional pack ice retreats to its minimum extent and new ice has yet to form over the broader region. almost all break-ups to date have occurred locally within the north-central to eastern areas inside the bay. the boundary between broken unstable areas and stable fast ice is approximately consistent with the location of the continental-shelf break, as shown by comparison with the general bathymetric chart of the oceans (fig. 1b). particularly stable fast ice, or perennial ice, occurs in shallow regions. dynamic effects associated with ocean currents might affect the stability/instability of the fast-ice field. however, quantitative analysis of this ocean-dynamic effect is beyond the scope of this paper due to the lack of in situ measurements of water currents in and around lh.

Fig. 1. (a) An example of a large-scale break-up of fast ice in the Lützow-Holm Bay (LH) embayment, East Antarctica, as detected in a NOAA AVHRR image from 3 August 2003. Break-ups of similar magnitude have occurred frequently since the late 1990s. The inset map of Antarctica indicates the imagery area. (b) Bathymetric chart in the imagery area. Isobathymetric lines are in metres. The chart was drawn by referring to Reference Moriwaki and YoshidaMoriwaki and Yoshida (2002).
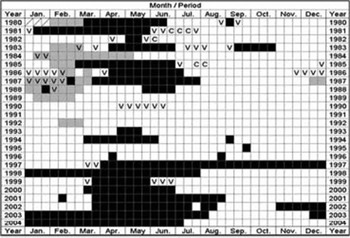
figure 2 summarizes the history of fast-ice break-ups in lh during the last 25 years. ‘break-up’ is defined here as the appearance of a southward advance in the disintegration and offshore drift of fractured ice floes beyond the latitude line of 68˚50' s inside lh. according to the historical chart in figure 2, the early to mid-1990s was a stable period. conversely, the 1980s and the time since the late 1990s have been unstable periods. in the summer season of january–february during the 1980s, vigorous melting or ice divergence (open-water formation) occurred at the eastern end of the bay, as shown in the chart in figure 2. break-ups take place frequently in autumn, and at least 20 have occurred during the current analysis period. it is striking that major break-ups have continued every year since 1997. moreover, break-up durations in recent years are slightly longer than those of the 1980s. new ice formation and discharge were repeated through to july of mid-winter 1998, from the commencement of the break-up in july 1997. the 1997/98 case shows a long-term duration of 16 months in total. periods of stability/instability have appeared with sub-decadal frequency during the past 25 years, as shown in figure 2.

Fig. 2. A tabulated history of fast-ice break-up events in the LH region, 1980–2004. Black demarcates break-up in the central part of the bay; hatched boxes show periods of water opening or large melting that occurred restricted to the Sôya Coast; V indicates periods when a V-shaped crack appeared; and C demarcates periods during which a north–south crack appeared.
3.2. Interannual variations in relation to ice navigation
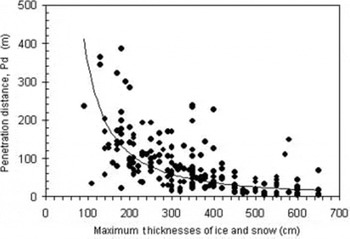
To seek corroborative evidence for the fast-ice variability described above (fig. 2), recorded values of penetration distances made during each ship ramming event have been examined as an index of the difficulty of ice navigation. these data are useful as a proxy of ice conditions, as ramming penetration distance is taken to reflect ice-thickness and snow-depth distributions. figure 3 shows the relationship between penetration distance, pd, and the maximum total thickness of ice and snow combined. here the penetration distances are presented as daily mean values per individual ramming action, and maximum values are adopted for the ice and snow thicknesses during the ramming. not surprisingly, a negative correlation is found, i.e. thick snow and/or ice offers more resistance to the icebreaker ramming and consequently reduces the pd. Reference Schultz, R.W. and DaiSchultz and others (1994) described a similar relationship between the penetration distance and ice/snow thicknesses from the ship (rv Nathaniel B. Palmer) performance test.

Fig. 3. Plot showing the relationship between icebreaker-ramming penetration distance, Pd, and combined ice and snow thickness. The solid curve is an exponential approximation.
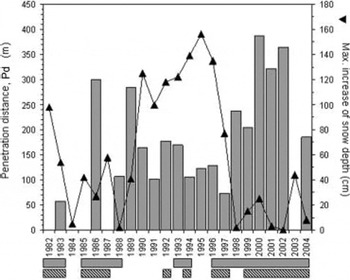
figure 4 shows the maximum pd values for each year since 1983. no ramming data are available for 1984, 1985, 1987 and 2003, which are light ice years. in the mid-1980s and since the end of the 1990s through 2004, pd values appear to be relatively high. the continuation of periods of relatively long pd (relatively easy navigation) coincides well with periods of break-up occurrence, as indicated in figures 2 and 4.

Fig. 4. Interannual variations in maximum values of Pd (bar chart) and of the relative increase in snow depth (line graph with triangles). The horizontal grey belt at the bottom indicates years in which ice break-up events of >10 days occurred. The hatched periods show the appearance of the embayment pattern in the offshore pack-ice region, likely to be formation of the Cosmonaut polynya.
3.3. Snow depth variations and their effect on ice condition
Snow cover on sea ice plays an important role in air–sea–ice interaction and the climate system (Reference MassomMassom and others, 2001). where the snow depth is large and the ice relatively old, melting and the subsequent refreezing of percolated meltwater causes superimposed ice to form (Reference Kawamura, Ohshima, Takizawa and UshioKawamura and others, 1997). in this way, snow metamorphism influences the mechanical properties of fast ice by ‘hardening’ the latter and making it less susceptible to break-up during storms or ocean-swell propagation events.
The snow-depth change on fast ice has been recorded at syowa station since the 1960s. maximum values of the relative increase of snow depth for each year are plotted in figure 4. during the early and mid-1990s, heavy snow years (defined here as >60cm increase) coincided with relatively stable ice conditions, or a ‘no break-ups’ era. for the other period, frequent break-ups coincide with light snow years (<60cm increase). when snow depth is small, the significant absorption of solar radiation in the ice that occurs from spring to summer negates upward growth by superimposed ice formation. this results in a mechanically weak fast-ice cover, as compared to the ice condition in heavy snow years.
Furthermore, there is a conspicuous negative correlation between snow-depth increase and icebreaker penetration distance, pd, as shown in figure 4. this relationship means that heavy snow causes difficulty in navigation by hardening the ice through superimposed-ice and/or snow-ice formation. these results support the large-scale variability in the fast-ice distribution observed in the satellite imagery as tabulated in figure 2. although the exact mechanisms responsible for the observed sub-decadal snow-cover variability have yet to be understood, the atmospheric environment probably affects snowfall and accumulation processes around the east dronning maud land area including the present study region.
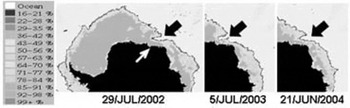
3.4. ‘Barrier’ effect of surrounding pack ice on fast-ice break-up
We examine the possible effect of variability in seasonal pack-ice conditions to the north of the fast ice on the breakup patterns of the latter. the hypothesis is that a more extensive and compact pack-ice cover affords more protection to the fast ice from the destructive impacts of ocean swell. figure 5 shows an example of an embayment pattern (black arrows; appearance of a deep-ocean polynya) that forms in the pack ice north of lh (white arrow), detected in SSM/I-derived ice-concentration images. the occurrence of this feature, termed the cosmonaut polynya, in the mid-1980s was reported by Reference Comiso and GordonComiso and gordon (1987, Reference Comiso and Gordon1996). the embayment pattern resulting from the occurrence of this polynya is defined here as a local southward retreat of the ice edge by >2˚ of latitude compared with the surrounding ice edge, based on the analysis of satellite passive microwave images from the NSIDC and ice charts from the NIC. frequencies of the embayment pattern determined in this way are marked in figure 4. a close coincidence exists between fast-ice break-up events and embayment occurrence, with an increased tendency in recent years. this is thought to be associated with enhanced swell intrusion to the coastal region during embayment periods.

Fig. 5. The characteristic embayment pattern of the pack-ice edge to the north of LH shown in SSM/I-derived ice-concentration images from the winters of 2002, 2003 and 2004. Black arrows indicate the unusual retreat of the edge, and the white arrow shows the location of LH. The color scale is quoted from the NOAA Marine Modelling and Analysis Branch (MMAB) Sea Ice Analysis Page (http://polar.ncep.noaa.gov/seaice/Analyses.html).
Reference Higashi, Goodman, Kawaguchi and MaeHigashi and others (1982), for example, showed that ocean swell effects were largely responsible for the major fast-ice break-up event in lh in mid-march 1980. they mentioned that swell features prior to the event have been detected in the tidal record at syowa station. Reference Squire and MooreSquire and moore (1980) made in situ measurement of wave attenuation by pack ice with distance from the ice edge in the bering sea. these previous studies suggest that swell will penetrate inside the fast-ice region of the lh through the offshore pack zone when the pack ice is limited in spatial extent. as such, it is speculated that the offshore pack ice constitutes a barrier that protects coastal fast ice from disintegration by ocean swell. as mentioned in section 3.1, break-ups occur in autumn to early winter since the regional pack-ice extent is at its seasonal minimum at this time, not in the warmest season during mid-summer. tides can also contribute to the initial disintegration of the fast ice near the coast. if tidal ranges are high, mechanical deformation will occur along the coast, where the fast ice is attached to the shore or is firmly fixed to some grounded icebergs. thus, the characteristics of fast-ice stability/instability are closely related to the action of ocean wave and tides.
3.5. Surface wind and air-temperature effects
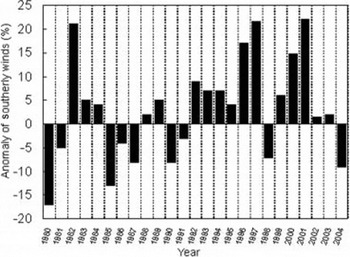
Particularly effective northward transport of fractured ice occurs from lh when frequent southerly (offshore) winds prevail, although the southerly wind speeds are not so high as the prevailing northeasterly winds. figure 6 shows the interannual variation of the frequency anomaly of southerly winds at syowa. the frequencies are slightly low in the late 1980s and early to mid-1990s as compared with those of the other periods. such an anomalous wind field contributes to floe transportation, and results in occurrences of fast-ice break-ups. the anomalous persistence of such winds again contributed to the large break-up event in 1997. winds with a dominant southerly component occurred from may to july in 1997, with high anomalous frequencies twice as large as normal (Reference S.Ushio, 2003).

Fig. 6. Interannual variation of anomaly (%) of southerly winds frequency measured at Syowa station. These values are derived as monthly anomalies (total of March–July) from normal values by averaging from 1967 through 1995.
Furthermore, mechanical weakening of the fast ice by melting contributes to its disintegration from late summer to autumn. mechanical strength depends amongst other things on the brine volume ratio within the ice (Reference Schwarz and WeeksSchwarz and weeks, 1977); this increases with increasing ice temperature (Reference Frankenstein and GarnerFrankenstein and garner, 1967). it follows that low fast-ice strength and higher susceptibility to break-up is expected during warm periods. the thermal condition of the sea ice follows the rising air temperature in the spring/summer season. then it is likely that the ice properties change and weakening occurs during warm periods following air-temperature changes. the record of monthly mean air temperatures measured during the cold season at syowa station shows that the case of 1996 was the highest during the past 25 years. the temperature anomalies for september and october 1996, derived by comparison with data from the normal value (the average for 1971–2000), are +6.2˚c and +2.6˚c, respectively. it is postulated that the anomalously mild winter in 1996 might have triggered the large break-up event that occurred in 1997 (Reference S.Ushio, 2003).
4. Conclusions
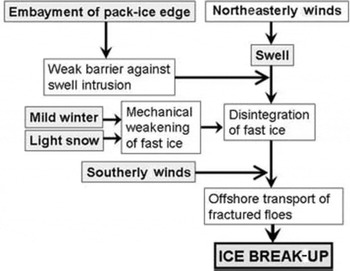
In this paper, we have presented evidence of strong temporal variability in the formation and break-up behaviour of fast ice in the lh region over the past several decades. there is a distinct correlation between break-up event occurrence and fast-ice ‘stability’, with instability predominating over the past few years. anomalous fast-ice snow-cover depths/accumulation and pack-ice embayment conditions appear to make a major contribution, together with a unique wind field (frequent wind direction). based upon results from the comparative analysis of satellite and in situ data, we propose a conceptual model for fast-ice break-up in the lh region as shown in figure 7. further work is required to quantify this model and its components.

Fig. 7. A conceptual model showing the major processes involved in the break-up of fast ice in the LH region.
In order to quantify and better understand interannual variability including fundamental ice growth/decay processes, long-term ice monitoring is required at several sites along the antarctic coast (e.g. the field measurements network proposed for the international polar year 2007–08). moreover, coastal ice conditions may effect a drastic change in the ocean environment (e.g. water/current structure and biological/chemical characteristics) in and around the bay. large-scale break-ups have the potential to form cold saline shelf water due to brine rejection associated with rapid refreezing through a large amount of heat flux to the cold air (e.g. Reference Ushio and WakatsuchiUshio and wakatsuchi, 1993). also, ocean surface circulation will probably be activated by the wind stress in the absence of fast ice. on the other hand, if major fast-ice break-ups result in the increased coastal intrusion of warm, salty offshore waters or modified circumpolar deep water, basal melting of floating glacier tongues may be enhanced. Reference Rignot and JacobsRignot and jacobs (2002) have described the strong sensitivity of antarctic glacier/ice-shelf melting to changes in ocean temperature. in this way, the patterns of fast-ice break-up and formation/persistence likely exert an important influence on the dynamics and thermodynamics of outlet glaciers and also the inland ice sheet. in future, field measurements linked with satellite remote sensing are required to detect glaciological responses to landfast ice stability in the form of the changing flow characteristics of floating ice tongues and the elevation/thickness of inland drainage basins.
Acknowledgements
The author thanks the japan meteorological agency for supplying snow-depth data on the landfast ice at kita-no-ura cove, syowa station. thanks are due to the jare members and the computing and communications center of the national institute of polar research, japan, for the reception and processing of noaa satellite images. SSM/I ice-concentration data were obtained from the nasa earth observing system distributed active archive center at the Nsidc, university of colorado at boulder (http://nsidc.org). the author thanks f. nishio for fruitful discussion. this work was partly supported by the ministry of education, culture, sports, science and technology, grant-in-aid for scientific research (c), 15510015, 2003 and by the sumitomo foundation, grant for environmental research 53299, 2005.