


Introduction
Radio-echo sounding (RES) is an active remote-sensing method that has become a major tool for glaciological investigations (Reference Bogorodsky, Bentley and GudmandsenBogorodsky and others, 1985). Whereas satellite-borne radar devices operating in the GHz bands yield information about the upper few centimetres to metres of the ice and snow surface, RES performed in the MHz to GHz bands is capable of penetrating up to several tens of metres to kilometres of ice.
RES devices are used to determine the inner state of the ice sheet (Reference FujitaFujita and others, 1999) and bottom topography (Stein-hage and others, 1999; Reference Nixdorf and GöktasNixdorf and Göktas, 2001); to separate certain thermal regimes (Reference MurrayMurray and others, 2000); to transfer datings from ice cores to electromagnetic reflectors (Reference Hempel, Thyssen, Gundestrup, Clausen and MillerHempel and others, 2000); and to obtain information about the accumulation (e.g. Reference Richardson, Aarholt, Hamran, Holmlund and IsakssonRichardson and others, 1997; Reference Nereson, Raymond, Jacobel and WaddingtonNereson and others, 2000; Reference Siegert and HodgkinsSiegert and Hodgkins, 2000) and strain history (Reference Vaughan, Corr, Doake and WaddingtonVaughanand others, 1999). Whereas some surveys try to make use of the frequency dependence of the dielectrical properties (Reference FujitaFujita and others, 1999), most applications analyze the depth and shape of internal reflectors. As the return signals are recorded as a function of travel time of the transmitted radar pulse, the latter application requires knowledge of the variation of the wave speed with depth in order to be able to convert the observed reflections from time to depth domain.
In this paper we compare the velocity of electromagnetic wave propagation in ice and the deduced travel-time– depth relationship derived from four common-midpoint (CMP) surveys carried out at various frequencies at site DML05 in Dronning Maud Land (DML), Antarctica, with results from new high-resolution dielectric-profiling (DEP) data and two simple density-based mixture models, the classical Reference LooyengaLooyenga (1965) model, which is based on theoretical considerations, and the empirical fit derived from field data given by Reference Kovacs, Gow and MoreyKovacs and others (1995).
Methods have been developed to determine the velocity– depth function of electromagnetic waves propagating through ice. The most direct method involves the measurement of dielectrical properties along ice cores by means of DEP (Reference Moore and J.G.Moore and Paren, 1987; Reference Wilhelms, Kipfstuhl, Miller, Heinloth and FirestoneWilhelms and others, 1998), from which interval velocities can be calculated directly. Instead of the dielectrical properties, density profiles of an ice core can also be used to determine the electromagnetic wave speed from mixture models (Reference Kovacs, Gow and MoreyKovacs and others, 1995; Reference Richardson, Aarholt, Hamran, Holmlund and IsakssonRichardson and others, 1997).
Indirect techniques are usually carried out with ground-penetrating radar (GPR) systems, using different approaches. The down-hole radar technique makes use of a borehole to record travel times as a function of depth of a reflecting target (e.g. Reference Jezek and RoeloffsJezek and Roeloffs, 1983; Reference Clarke and BentleyClarke and Bentley, 1994). Interval velocities can then be derived from the transmitter– target–receiver travel time as a function of depth. Although this type of measurement and the subsequent analysis is straightforward and less time-consuming than those referred to previously, it still makes use of an existing hole.
A special case of radar wide-angle and reflection measurements is the CMP survey technique, well known from reflection seismic exploration (Reference YilmazYilmaz, 1987). As an indirect method, this technique has been widely applied to single-and multichannel GPR measurements in recent years (e.g. Reference Fisher, McMechan and AnnanFisher and others, 1992; Reference Hempel, Thyssen, Gundestrup, Clausen and MillerHempel and others, 2000; Reference MurrayMurray and others, 2000). The CMP technique makes use of a special linear geometry set-up such that the points of reflection at a certain depth remain the same for all transmitter–receiver offsets. The velocity–depth function can be inferred from the increase of travel time with offset, assuming near-horizontal reflectors.
Whereas the errors involved in calculating the velocity– depth profile from DEP and density models are rather small, a fair amount of time and logistic support for retrieving and processing the core is required. CMP measurements, on the other hand, can be carried out rapidly and with little logistic support. As the dielectric properties depend in principle on temperature, the CMP technique has the advantage of taking the in situ temperature into account, compared to ice-core data that are processed at an ambient processing temperature. However, wavelengths typically on the order of metres result in lower resolution, and theoretical assumptions for CMP analysis introduce errors, when establishing a travel-time–velocity profile from GPR measurements. The results of our investigations are used to evaluate the accuracy of the CMP travel-time– velocity and travel-time–depth functions with regard to the other methods, and to assess if the lower expenditure in the field justifies CMP application to determine the depth of electromagnetic reflectors.
Data, Equipment And Methods
Data basis and GPR system
The European Project for Ice Coring in Antarctica (EPICA) aims to retrieve deep ice cores from two different regions of the Antarctic ice sheet (Dome Concordia and DML). During the 1998/99 EPICA pre-site survey in DML, GPR measurements were carried out simultaneously at two different frequencies on a traverse connecting the locations of ice cores drilled in earlier seasons. In addition to >4000km of common-offset GPR profiles, six CMP measurements were obtained at different frequencies at several borehole locations along the traverse (Fig.1).Most CMP surveys were measured at site DML05, close to the location of the forthcoming ice coring, from which a 150 m ice core was retrieved during the 1997/98 season. The field processing of the ice core, hereafter referred to as B32, included high-resolution DEP and density measurements (Reference OerterOerter and others, 2000). Together with the CMP data they form the basis for the investigations carried out in this paper.

Fig. 1. Location map of the study area in DML. The 1998/99 traverse radar profiles are drawn as solid lines. The locations of firn cores at which CMP surveys were carried out are in bold typescript. The inset displays the location of the study area in the Antarctic continent.
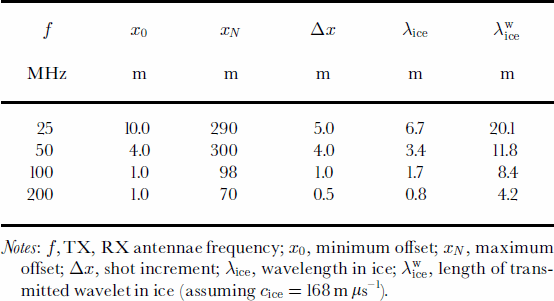
The radar measurements were performed with a commercial RAMAC GPR set of the Swedish company Malå Geoscience. The GPR device is a monopulse bistatic radar system with a maximum sample rate of 200 scan s–1, a dynamic range of 150 dB, and can be operated at several frequencies. The data acquisition is organized by software from the same company, using a Husky PX5 personal computer. The antennae are connected to the control unit via fibre-optics cables, thus avoiding disturbing interferences of the transmitted wave with ohmic connectors. For all field measurements discussed here a linear profile line was set up with an azimuth of approximately 130˚ and ~100m southeast of the location of core B32. Four CMPs were carried out with anntenna frequencies of 25, 50, 100 and 200 MHz, using 512 stacks per trace and the geometric set-up as given in Table 1.
Table 1. Geometric set-up and wavelet characteristics of the CMP surveys
CMP method with GPR
The CMP recording technique is usually employed to improve the signal-to-noise ratio with redundant recording during reflection seismic-data acquisition (Reference Garotta and MichonGarotta and Michon, 1967; Reference YilmazYilmaz, 1987), and has also been applied successfully to GPR surveys (Reference Fisher, McMechan and AnnanFisher and others, 1992; Reference Greaves, Lesmes, Lee and ToksözGreaves and others, 1996). In addition, multifold coverage with nonzero-offset recording yields velocity information about the subsurface. In the case of single-channel GPR, the redundancy is achieved by multiple-offset coverage of the same subsurface point with one transmitter–receiver pair, positioned at the same distance from the centre of a linear rprofile. Since the geometry of the set-up is essential for the analysis, the offset x between both antennae is, for the sake of simplicity, usually increased in N equidistant intervals Δx, starting from a minimum offset x0 up to a maximum offset xN = x0 + N Δx. At a given offset x from the profile centre, the travel time t(x) along the ray path from the transmitter to the depth point and back to the receiver at the surface is
where v is the velocity of the medium above the reflecting interface, and t(0) is twice the travel time along the vertical path. Equation (1) describes a hyperbola in the plane of two-way travel time (TWT) vs offset. The difference between the two-way time t(x) at a given offset x and the two-way zero offset time t(0) is called normal move-out (NMO). When t(x) and t(0) are known, the velocity v can be calculated from Equation (1).With an estimated NMO velocity the travel times can be corrected to remove the influence of the offset, thus turning the reflection hyperbola in the radargram into a flat reflector.
To derive an expression for the vertical velocity distribution, assume a lateral homogeneous medium consisting of J horizontal layers of constant interval velocities v1; v2; . . . ; vJ. The travel time from the transmitter to the depth point at the jth layer and back to the receiver then becomes a function of layer thickness, velocity and higher orders of the offset x. The root-mean-square (rms) velocity vrms down to the jth reflector is defined as (Reference YilmazYilmaz, 1987)
where ![]() is the travel time through the ith layer and
is the travel time through the ith layer and ![]() When the offset is small compared to depth, the travel time can be approximated by
When the offset is small compared to depth, the travel time can be approximated by
Comparing Equations (1) and (3), it can be seen that, in the so-called small-spread approximation, the velocity required for NMO correction is equal to the rms velocity.
CMP data processing
Data processing is carried out using Paradigm Geophysical FOCUS version 4.2 software. The processing stream for all measurements includes bandpass filtering and automatic gain control. An example for the CMP measured with the 200 MHz antennae after these processing steps is shown in Figure 2. These steps are followed by the definition of the trace geometry and a first estimate of the TWT–rms-velocity profile from the velocity spectrum using a stacked amplitude contour plot (Fig. 2). Velocity estimates are not reliable at times greater than that at which the last coherent reflection occurs (e.g. below 1.2 ms in Fig. 2). To improve the velocity model, reflection hyperbolae are manually fitted to prominent reflectors in the radargram by selecting points in the vrms vs TWT domain. A final check of the velocity distribution is performed by investigating the NMO-corrected radargrams in the offset vs TWT domain, i.e. if all hyperbolic reflectors are transformed into flat events. As the final step we use the TWT–rms-velocity distribution to successively invert Equation (2) to obtain the interval velocities (Reference DixDix, 1955), which in turn are used to perform the travel-time-to-depth conversion of the prominent horizons.

Fig. 2. Radargram of a CMP, carried out with the 200 MHz antennae, after bandpass filtering and applying an automatic gain control, and the corresponding spectrum of the rms velocity, calculated from stacked amplitudes. The direct wave, the ground wave and more than 20 reflectors consisting of several phases are clearly visible in the radargram. In the velocity spectrum, the upper 0.18 ns are muted to avoid errors in the calculation from the overlapping of the first reflection and the ground wave.
High-resolution DEP
The complex relative dielectric constant (DC) can be written as
where the real part °0 is the ordinary relative permittivity of the medium. The imaginary part °00 is the dielectric loss factor and can be expressed as a function of conductivity σ, circular frequency ω and the permittivity of vacuum є0. The DC can be determined along an ice core by means of DEP (Reference Moore and J.G.Moore and Paren, 1987). An improved DEP device developed by Reference Wilhelms, Kipfstuhl, Miller, Heinloth and FirestoneWilhelms and others (1998), essentially a calibrated guarded scanning capacitor, was used at a frequency of 250 kHz to determine the complex DC along the ice core in 5 mm increments. The new version of the DEP device has a systematic accuracy of about 1% for each complex permittivity component. Sections with poor core quality, such as cracks or missing pieces, were removed from the dataset.
The electromagnetic wave speed c in snow and ice obeys the general equation
where c0 is the electromagnetic wave speed in vacuum. The DEP measurements indicate that the conductivity is of the order of 10–5 Sm–1, implying that the imaginary part of the DC calculated from Equation (4) is about two orders of magnitude smaller than the real part. It can thus essentially be neglected for determining c from Equation (5) and the DEP data.
For each point of the DC–depth series we calculate the wave speed, resulting in a velocity–depth distribution. The linear interpolation of the velocity between the data points and the subsequent integration of the velocity distribution yields a propagation time for each data point, which, in analogy to the propagation of a transmitted radar pulse in ice, can be converted to aTWT.
γ-absorption density and mixture models
In dry ice, density is the main factor affecting the real part of the DC (Reference Robin, Evans and BaileyRobin and others, 1969). With the use of a mixture model that relates the ice density to the DC it is therefore possible to calculate the electromagnetic wave speed from the measured density. In addition to the DEP device, the measuring bench hosts a γ-densiometer, allowing quasi-simultaneous measurements of the DC and density. The density of the core, being an air–ice mixture, was recorded in 5mm increments with an accuracy of 10 kgm–3, corresponding to ~1.1% for solid ice (Reference WilhelmsWilhelms, 2000). To apply the γ-density to calculate the wave speed, two relations are considered that connect density and permittivity: the model by Reference LooyengaLooyenga (1965) and the relation given by Reference Kovacs, Gow and MoreyKovacs and others (1995).
Reference LooyengaLooyenga (1965) derived a relation that connects density and permittivity of a constant mixture from a theoretical model. Application to polar ice yields an expression for the permittivity of the mixture:
where °0ice = 3.17 is the permittivity and ρice = 917 kgm–3 is the density of ice (Reference Robin, Evans and BaileyRobin and others, 1969).
The empirical formula published by Reference Robin, Evans and BaileyRobin and others (1969) was improved by Reference Kovacs, Gow and MoreyKovacs and others (1995) by comparing field measurements of the DC with density. Their study leads to the relation
with a standard error of ±0.031 for °0 (~1% forє′ice).
Using the γ-density–depth series together with Equations (6) and (7) provides two series for °0 of the mixture. These are used to determine the velocity from Equation (5) and the TWT as explained for the DEP measurements.
Comparison Of The Electromagnetic Wave Speeds
The CMP-processing sequence is performed for each of the four CMP measurements. Together with the DEP- and density-based interval velocity distributions, this results in seven different datasets for the TWT–interval-velocity andTWT–depth distributions for the site of ice core B32. For the sake of brevity the interval velocity is referred to as velocity, as only the interval velocities are considered.
Interval velocity
The spatial resolution of the three methods, DEP, mixture model and CMP analysis, varies between 5 mm for the ice-core data and several tens of metres for the 25 MHz CMP measurement (Table 1). In order to estimate the accuracy of
The DEP and γ-density velocities are resampled with a linear interpolation on an equidistant sample interval of 1ns, and then smoothed with a cosine time-domain filter with a filter length of 0.2 μs. The CMP velocities are plotted on mid-interval points and connected by straight lines representing a linear velocity gradient. Except for the 25 MHz CMP, the course of the velocities with TWT shows a similar trend for all three methods, asymptotically approaching the wave speed of bubble-free ice of 168mμs–1 (Fig. 3). The velocities derived from the 25 MHz CMP are systematically higher by ~10mμs–1 than the core measurements. Although the 50 and 100 MHz CMPs differ from the core measurements by up to 10 m μs–1 as well, their agreement is better, as they approach the latter to within 5 m μs–1 below 1.1 ms. The 200 MHz CMP compares best with the core measurements, with maximum difference of 6m μs–1. However, its velocity gradient is systematically larger, the velocities being generally higher above 0.35 ms and smaller below. The velocities derived from the three different types of core measurements agree very well, with differences mainly in the upper 0.3 ms and below 1.1 ms.

Fig. 3. TWTvs velocity calculated from the CMP and ice-core data, as described in the text. The raw velocity profile calculated from DEP measurements is plotted in light grey to illustrate the different resolutions and the effect of the filtering procedure. The vertical line at 168 mms–1 indicates the electromagnetic wave speed in solid ice. the methods, it is appropriate to smooth the ice-core-based data series as follows.
To quantitatively estimate the differences of the seven datasets and to account for the different resolution of the methods it is useful to consider the rms differences of the velocity curves. As the DEP method has the highest accuracy and resolution, the filtered DEP velocity profile is used to define a standard velocity series vDEP int .The relative rms differences of the velocities σvint are calculated by the equation
where vint;j is the considered series of length N, and vDEP int;j is the standard velocity series which is again resampled at the locations j of the considered series.
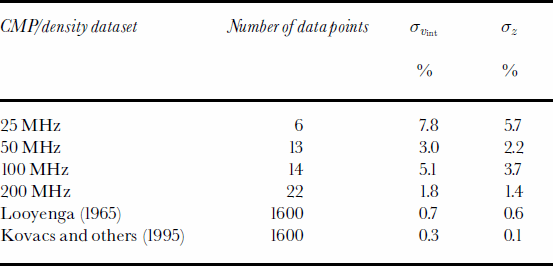
For the CMP velocities, the absolute rms differences vary between 7.8% and 1.8% for the 25 and 200 MHz CMPs, respectively (Table 2). The CMP rms differences show a trend to decrease with increasing frequency and number of data points. The relative rms differences between the averaged density-based velocities and the standard velocities are 0.7% and 0.3% for the Reference LooyengaLooyenga (1965) and the Reference Kovacs, Gow and MoreyKovacs and others (1995) mixture models, respectively.
Table 2. Root-mean-square differences of CMPand γ-absorption density datasets in relation to the standard DEP series
Time-to-depth conversion
The TWT–depth relation is needed to convert the picked travel times of prominent reflectors detected in common-offset profiles into depth domain. As the TWT–depth relation is calculated by integrating the interval velocities, minor differences between the different profiles are smoothed out (Fig. 4).

Fig. 4. TWT vs depth calculated by integrating the velocity profiles.
In analogy to Equation (8) we calculate the relative rms difference σz between theTWT–depth series of the different datasets and the standardTWT–depth series. To define the standard depth series zDEP as well as to calculate σz we apply the same resampling and filtering as described above. The relative rms differences of the CMP TWT–depth functions are smaller than those of the relative rms velocity differences (Table 2). They decrease from 5.7% for the 25 MHz CMP to 1.4% for the 200 MHz CMP. Although the general trend is still that the rms difference decreases with increasing frequency, the 50 MHz CMP shows smaller differences than the 100 MHz CMP. The rms differences calculated from the DEP and the Reference LooyengaLooyenga (1965) and Reference Kovacs, Gow and MoreyKovacs and others (1995) mixture models are 0.6% and 0.1%, respectively.
Discussion
There could be several reasons for the observed discrepancies in theTWT–velocity andTWT–depth profiles from the different methods. In order to provide a quantitative uncertainty for the GPR measurements, individual errors arising from theoretical approximations and measurement devices are estimated to explain the observed errors.
In general, the CMP velocities appear to be higher than the velocities calculated from DEP and γ-density data. A systematic overestimation of velocities has also been noticed in former investigations (Reference Jezek and RoeloffsJezek and Roeloffs, 1983; Reference Morey and KovacsMorey and Kovacs, 1985). Whereas instrument-related timing errors are made responsible for deviations from laboratory measurements carried out by Reference Jezek and RoeloffsJezek and Roeloffs (1983), Reference Morey and KovacsMorey and Kovacs (1985) attribute observed differences in travel time to curved ray paths, resulting from the refraction of the propagating radar pulse at boundaries of a changing DC, which is not accounted for in the hyperbolic Equation (3).
In our case, timing errors can be ruled out, as the device and the data were checked by various means. If a curved ray path were responsible, then a deviation of the same order should be observed for all CMPs. The good agreement of the 200 MHz CMP with the core-based profiles refutes this explanation.
When dipping layers are present, the observed reflections of a low-velocity event cannot be distinguished from a high-velocity event with horizontal layering without further information (Reference YilmazYilmaz, 1987). To check whether the assumption of a horizontal subsurface geometry is justified in our case, prominent reflectors were picked from two common-offset GPR surveys carried out with the 200 MHz antennae, crossing at location B32. The detected reflectors are found to dip by some 4˚ relative to the surface around 1.1 ms and 51˚ near 0.6 ms within 2 km of B32. As the CMP profiles were obtained approximately perpendicular to the gradient of the internal layers, dips of 4˚ and 1˚ cause the rms velocities used for NMO correction to be 0.25% and 50.1% higher than the true velocities, respectively (Reference YilmazYilmaz, 1987) (i.e. the interval velocities are slightly overestimated). These changes are smaller than the rms differences calculated above and only affect velocities below ~60m. We therefore conclude that the slight dipping of the internal reflectors does not significantly alter theTWT–depth function.
The derivation of the hyperbolic Equation (3) presumed that the small-spread approximation is valid, i.e. that the offset is small compared to depth. However, this prerequisite is violated for all CMP analyses for the uppermost reflectors, and above 100m for the 25 and 50 MHz CMPs, thus explaining the observed trend that differences between CMP and DEP velocities are larger for smaller depth.
Other contributions to the observed differences arise from the CMP surveys. Due to the decrease in resolution with increasing wavelength, the best agreement with the DEP profile results from the fitting of 22 individual hyperbolae in the 200 MHz CMP, whereas only 6 hyperbolae are available for the 25 MHz CMP. Lateral variations of the physical properties in the upper few metres of the ice sheet could contribute to deviations, as might the simple separation of the borehole location B32 and the CMP centre point by 100m. However, the quantitative influence of lateral inhomogenities can only be investigated by time-consuming multichannel GPR survey geometries (Reference Fisher, McMechan and AnnanFisher andothers, 1992; Reference Greaves, Lesmes, Lee and ToksözGreaves and others, 1996).
The differences in the various TWT–depth functions result directly from the time-to-depth and depth-to-time conversion of the interval velocities from the CMP and core measurements, respectively. Because of the smoothing effect of the velocity integration, the rms differences decrease (Table 2). To determine the accuracy of the depth of a reflector observed in the time domain, it is important to consider the errors involved in the picking of reflector phases. Different phases of prominent reflectors can be separated in the radargram, making it possible to determine the time at which the first phase occurs to within one half-cycle. Investigations of the direct waves show that the transmitted radar-pulse wavelets at all frequencies consist of more than eight half-cycles, each of which is about λ/2 long. Most of the energy of the wavelets is located in the first four half-cycles, except for the 25 MHz pulse, where the main energy is distributed among six half-cycles. During propagation, however, the transmitted wavelet is distorted due to several mechanisms, the most important being interferences at different, closely spaced thin layers (Reference CloughClough, 1977). In addition, especially at longer travel times, the energy decay due to geometric spreading and absorption is too large to be able to resolve the most energetic part of the wavelet. Considering these factors, we conclude that the accuracy of the travel time at which a reflector occurs can only be determined to about half the length of the energetic half-cycles of the wavelet. For the system used in this study, this means that the realTWT of a reflector detected with the 200,100 and 50 MHz antennae is accurate to within~ λ (0.8,1.7,3.4 m), and ~3/2λ for the 25 MHz antennae.
The TWT-to-depth conversion on the basis of CMP surveys yields additional errors of 1.4–5.7%. For a reflector at 100m depth detected at 200 MHz, this corresponds to an error of 1.4m because of the uncertainty of the 200 MHz CMP, and 0.9 m due to the shape of the wavelet and the processes involved during reflections. For the 25 MHz measurements, these errors increase to 5.7 and 10.5m, respectively. Applying the relation by Reference Kovacs, Gow and MoreyKovacs and others (1995) to density profiles to calculate the TWT–depth relation produces a slightly better agreement with the DEP data than using the theoretical model by Reference LooyengaLooyenga (1965). Although the high-resolution DEP technique is the most direct and accurate way to determine the permittivity, the systematic nature of the measurement error implies that the error of a single data point of 1% remains valid for the whole TWT–depth profile (Reference WilhelmsWilhelms, 2000).
Conclusion
The uncertainty involved in the time-to-depth conversion accuracy of electromagnetic reflectors by state-of-the-art methods has been determined to result in a minimum error of 1%. Maximum errors depend on the method used, and range between 1% for DEP, 1–2% for density-based mixture models and 1.5–6% for CMP surveys. In general, it can be stated that the errors introduced by the time-to-depth conversion with a CMP analysis are of the same order as those related to the picking of reflection times.
The overall accuracy in depth of a reflector is determined by the wavelength and the shape of the wavelet of the transmitted pulse and the uncertainty of the method used for time–depth conversion. With the choice of an adequately high resolution of the GPR system, <4m in our study, total errors are 2–6% for depths around 100m. However, errors could be as high as 12% when the wavelength is increased and the transmitted wavelet reaches a considerable fraction of the observation depth. This implies that higher frequencies should be used for the CMP surveys to resolve the velocity changes, most of which take place in the upper 60–80m of the ice column. To gain better insight into the processes involved in electromagnetic reflections, it is necessary to carry out further investigations (e.g. by means of numerical calculations based on the measured complex DC). The comparison with real radargrams will provide the opportunity to derive more accurate estimations of the errors involved.
We conclude that the CMP method is suitable for estimating the depth of radar reflectors with sufficient accuracy. Compared to ice-core measurements, it is a time-saving technique, simple to implement, and does not require extensive logistics. CMP surveys are thus a useful tool to acquire region-wide information on velocity distributions and time–depth relations, and should become a standard application for glaciological GPR investigations.
Acknowledgements
We thank I.R. Joughin, M. J. Siegert and one anonymous reviewer for their useful comments. The important contribution of the field parties during data acquisition is gratefully acknowledged. The data would not have been acquiredwithout the maintenance of the radar system by G. Stoof. Preparation of this work was supported by the Deutsche Forschungsgemeinschaft grant Ni493/1 and two scholarships of the Studienstiftung des Deutschen Volkes. This is Alfred Wegener Institute for Polar and Marine Research Publication No. AWI-N10124.


