Introduction
Due to lack of snowfall data in the Arctic, many previous thermodynamic sea-ice models have used monthly climato-logical snowfall rates. The prescribed snowfall rates assumed by Reference Maykut and UntersteinerMaykut and Untersteiner (1971) (hereafter referred to as MU) have been widely used (e.g. Reference SemtnerSemtner, 1976; Reference Parkinson and WashingtonParkinson and Washington, 1979). These accumulation rales were chosen to represent the annual cycle of snowfall in the central Arctic, but did not include precipitation during the melt season. Reference Ebert and CurryEbert and Curry (1993) used monthly snowfall rates derived from climatological data from stationary and drifting stations (Reference Vowinckel, Orvig and OrvigVowinckel and Orvig, 1970) (hereafter referred to as VO). These data included summertime precipitation.
Previous models that have included an ice-thickness distribution have ignored snowfall (e.g. Reference Thorndike, Rothrock, Maykut and ColonyThorndike and others, 1975; Reference HiblerHibler, 1980; Reference Thomson, Sykes and McKennaThomson and others, 1988). Reference BjörkBjörk (1992), while including an ice-thickness distribution, neglected the thermal inertia of snow cover. More recently, Reference Flato and HiblerFlato and Hibler (1995) have included a snow-thickness distribution, with monthly averaged snowfall rates. They note that varying these snowfall amounts by ±50% increases or decreases the mean ice thickness by <25 cm, while completely eliminating the snowfall increased the mean ice thickness by about 50 cm.
In a study emphasizing inter-annual variability, Reference Ross and WalshRoss and Walsh (1987) compared the results of a dynamic thermodynamic sea-ice model run with monthly snowfall fields from 1977 and 1979 to the same model run with the climatological MU snowfall. They found that with the variable snowfall, the model could simulate large portions of the inter-annual variability in the summer surface albedo. The MU snow fall resulted in a thinner snow cover at the end of winter, and an earlier onset of the melt season. Thitmer ice occurred at the end of the melt season.
In this study, we examine the effects of the VO and MU snowfalls on the snow ice thickness distribution A randomly varying annual cycle of snowfall is also introduced to simulate individual snowfall events as well as the intervening snow-free periods. First, the three annual cycles of snow fall and their effect on the area-averaged ice properties are discussed. Second, the effect of snowfall on the ice-thickness distribution is examined, and the annual cycle of snow cover for each ice-thickness bin is discussed. Finally, the processes affecting snow-cover mass balance and their dependence on ice thickness is examined.
Model Description
In general, the sea-ice-ocean model is a single-column representation of an ice sheet at about 80°N, with a domain large enough to represent an ice-thickness distribution. The ice-thickness distributions of level and ridged ice are calculated from a 100 year model run, and separated into 25-level and 15-ridged ice-thickness categories. Both ice-thickness distributions include first-year ice (FYI) at the thin end, and multi-year ice (MVI) at the thick end. Here, FYI is defined as ice that has not Survived a melt season. Each ice category is described by surface characteristics (area, snow-cover, pond fraction and depth, surface temperature, and age) and interior ice properties (ice thickness, ice temperature, salt content and brine pockets), with each category evolving thermodynamieally and independently from the others. The model also includes parameterizations of export and ridging (Reference BjörkBjörk, 1992), an interactive bulk ocean-mixed layer (Reference CasparGaspar, 1988), and melt-pond and albedo parameterizations (Reference Ebert and CurryEbert and Curry, 1993). A more detailed description of the ice-thickness distribution model and the ocean mixed-layer model can be found in Reference Schramm, Holland and CurrySchramm and others (in press) and Reference Holland, Curry and SchrammHolland and others (in press).
Particular to this study are the processes acting to remove the snow cover from the ice-thickness distribution. These processes and the modeling of the snow cover will be described briefly. The direct and diffuse albedos of the snow cover depend on whether the snow is dry or melting, and are calculated following Reference Ebert and CurryEbert and Curry (1993). The snow density is assumed to be 330 kg m−3 all year. The snow cover has one interior temperature point to allow for the storage of heat (Reference Ebert and CurryEbert and Curry, 1993). Snow falls evenly on all ice-thickness categories; snow redistribution by wind is not included. Reduction of the snow cover by sublimation is proportional to the latent heat flux at the surface. It is assumed that the snow cover on the thin ice being ridged falls into the ocean mixed layer. The snow cover on any ice that is exported is also exported. If the weight of the snow cover causes the ice-snow interface to sink below the water level, this saturated snow becomes ice.
When snowmelt begins, 85% of the melt water is allowed to run off into the ocean while the other 15% is held in a reservoir until the entire snow cover has melted. This reserved water is then available to form melt ponds. Any snow that falls during the melt season melts upon contact with the surface, and runs off or is ponded in the ratio described above. Evaporation removes the snow cover in proportion to the latent heat flux but, due to the short period in which snow cover exists while the surface temperature is above the melting point, evaporation removes little snow mass during the year.
Sensitivity to the Annual Cycle of Snowfall
To examine the sensitivity of the single-column ice-ocean model to snowfall, three annual cycles of snowfall are considered. The first animal cycle is derived from climatological data obtained from drifting stations in the vicinity of 80°N (Reference Vowinckel, Orvig and OrvigVowinckel and Orvig, 1970). These values are multiplied by 1.6 to account for the gauge measurements that underestimate the snow fall by about 60% (Reference Ebert and CurryEbert and Curry, 1993). This annual cycle of snow fall produces a total annual snowfall of about 50 cm a−1 (Fig. 1a, solid). In this case, snowfall continues throughout the summer, melts upon contact with the surface, and increases ponded and runoff melt water.
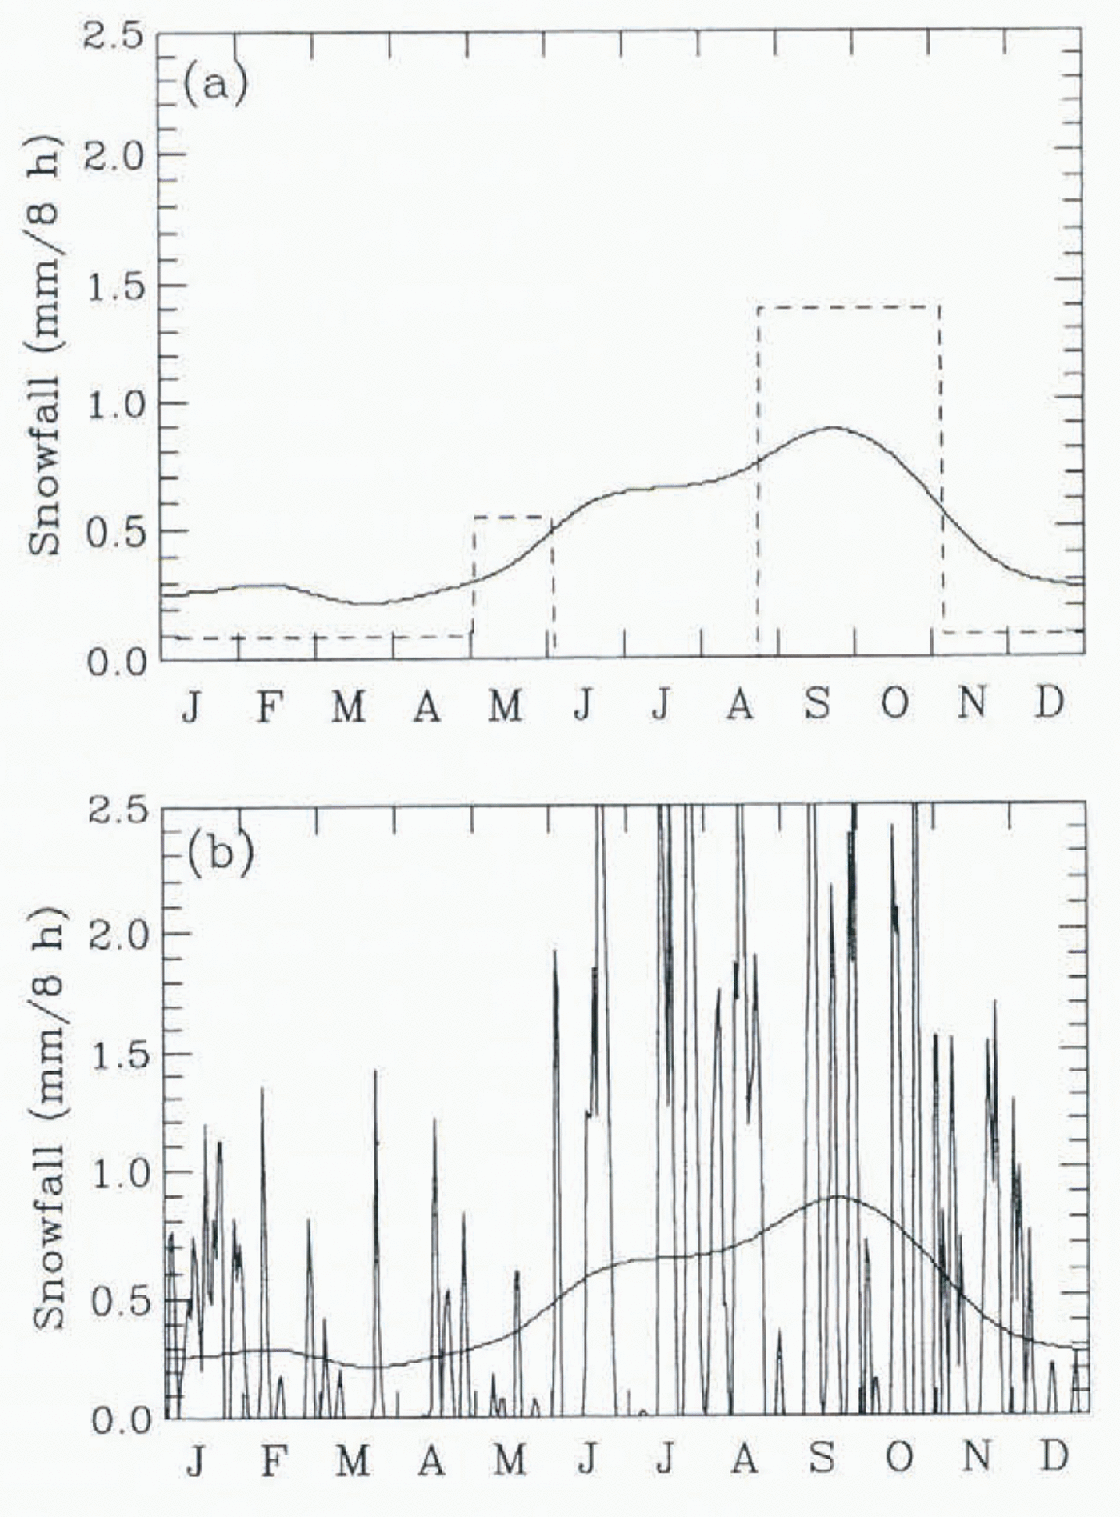
Fig. 1. Annual cycle of snowfall in mm/8 hour from (a) Reference Vowinckel, Orvig and OrvigVowinckel and Orvig (1970) (solid) and Reference Maykut and UntersteinerMaykut and Untersteiner (1971) (dashed) and (b) a randomly varying snowfall.
The second pattern of snowfall is described by Reference Maykut and UntersteinerMaykut and Untersteiner (1971). The values of MU snowfall were chosen to represent the annual cycle of surface snow cover, and capture the rapid autumn accumulation of snow as well as the onset of the melt season (Fig. 1a, dashed). There is no snowfall during the inch season, and the total annual snowfall is 40 cm a−1. With the onset of MU snowfall fixed from August 20, the length of the bare-ice season is extended when compared to the VO model. For the third annual cycle of snowfall (hereafter referred to as RV), random variation was applied to the VO snowfall to capture better the snowfall events and snow-free periods that are more representative of a realistic annual cycle of snowfall ( Fig. 1b). This annual cycle gives a total annual snow fall ol 55 cm a−1.
Area-averaged ice properties
The area-averaged annual cycles of various ice-surface properties for the three different snowfalls are shown in Figure 2. The largest variation in ice thickness (Fig. 2a) is about 20 cm between VO (solid) and MU (dashed) snowfalls. This is due to the rapid accumulation of snow from the MU snowfall, which produces a thicker snow cover and has an insulating effect on the ice (Fig. 2b). The RV snowfall (bold) allows the snow cover to increase as rapidly as the MU snowfall, due to a large snowfall event in mid-August. By late autumn, the rate of change of the snow cover is between that of the VO and MU snowfalls. The surface temperature is relatively unchanged by snowfall, except for minor variations before and after the melt season.
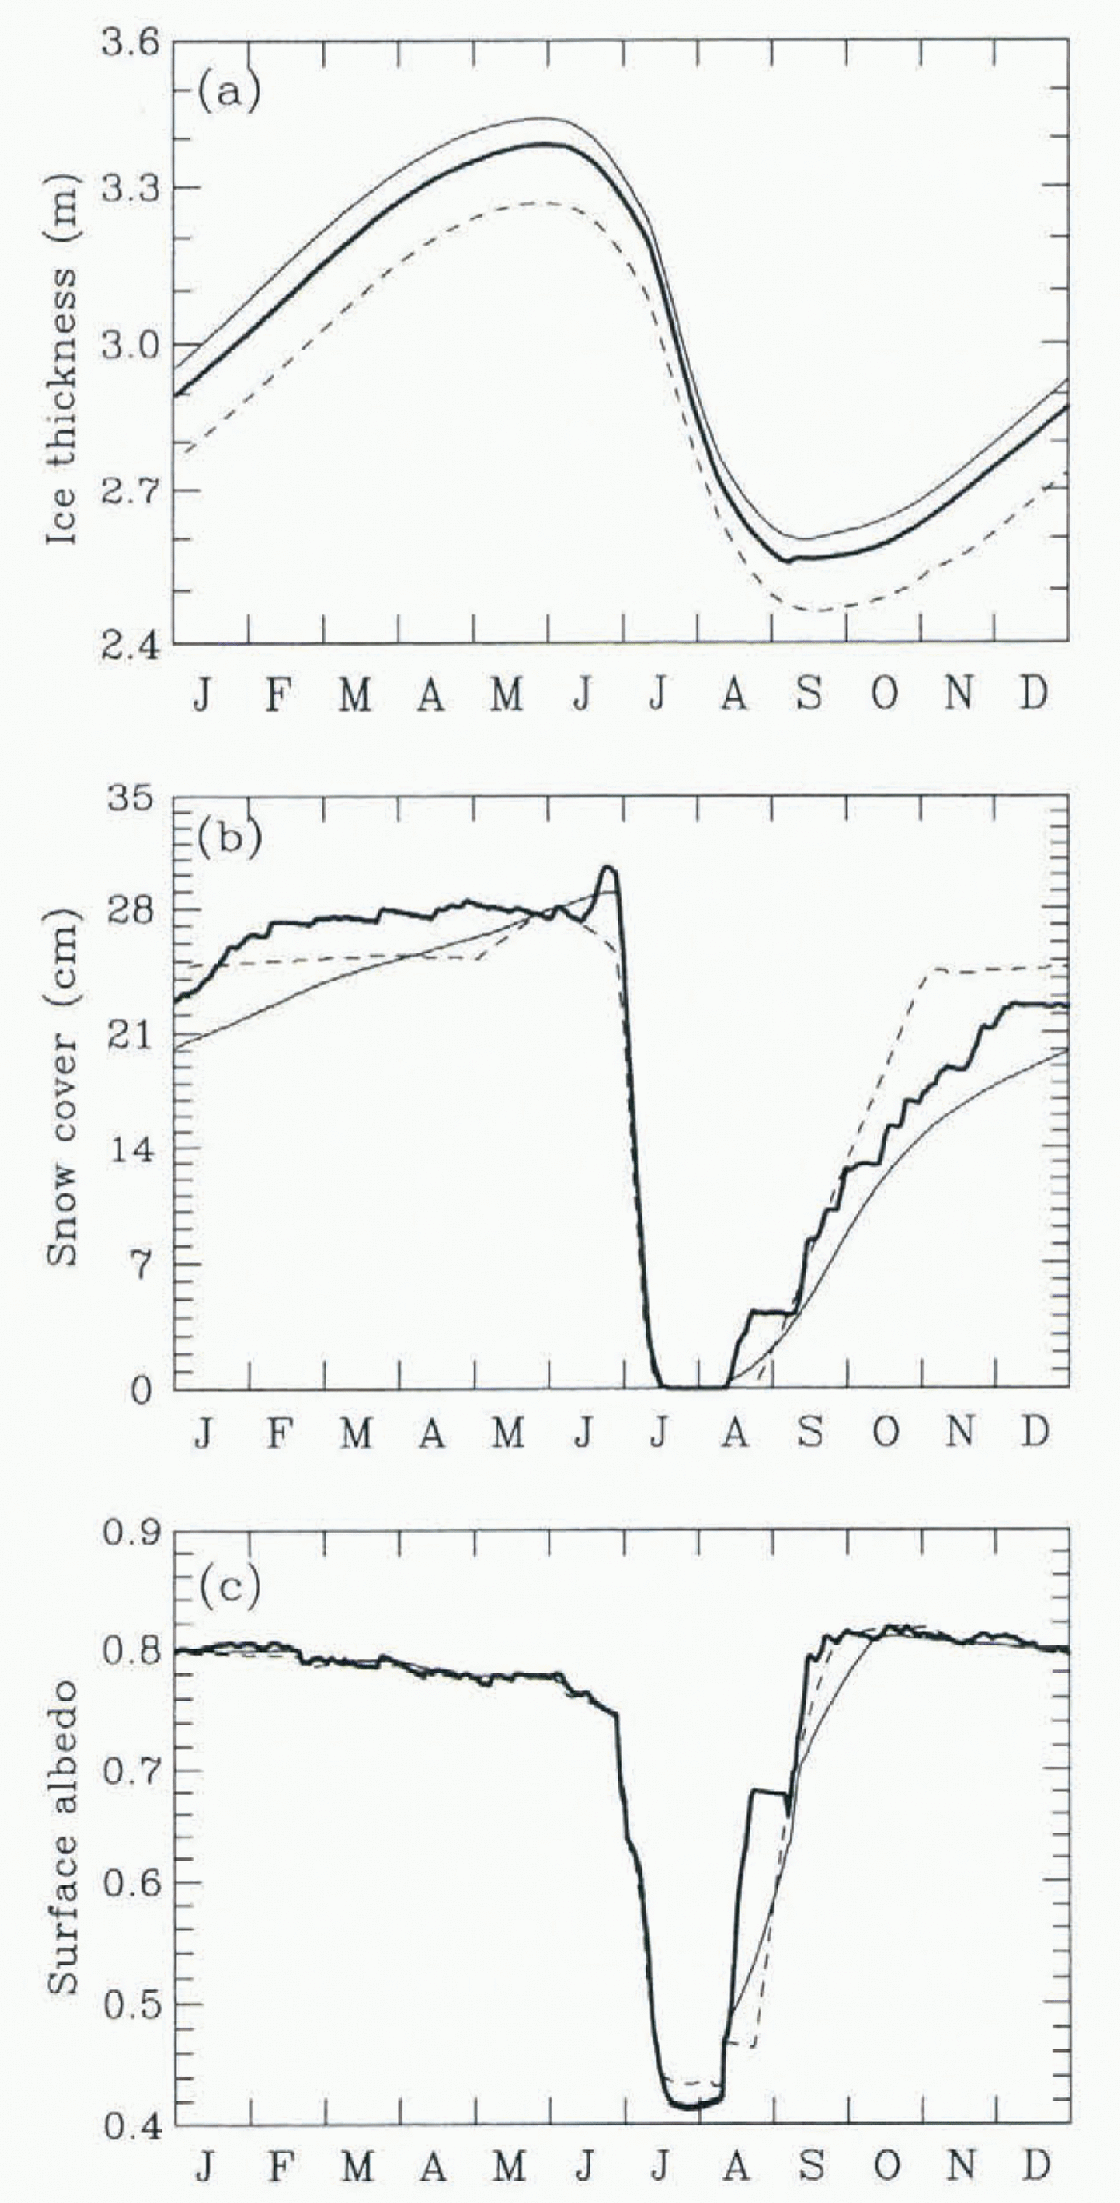
Fig. 2. The area-averaged annual cycles of (a) ice thickness, (b) snow cover and (c) surface albedo for the Reference Vowinckel, Orvig and OrvigVowinckel and Orvig (1970) snowfall (solid), the Reference Maykut and UntersteinerMaykut and Untersteiner (1971) snowfall (dashed) and the randomly varying snowfall (bold).
The surface albedo is very sensitive to the liming of the ousel of snow accumulation, and to the freezing of melt ponds and leads (Fig. 2c). MU snowfall, which allows a longer melt season, shows a distinct period of bare ice in late August, when the melt ponds are frozen over but the snow is not yet accumulating. The area-averaged albedo of this bare ice is about 0.47. This period of bare ice is notably absent for the VO and RV snowfalls, since the onset of snow accumulation coincides with the freezing of melt ponds. The gradual increase in surface albedo for the VO snowfall coincides with the gradual increase in snow cover. The albedos for the three snowfalls are similar when the leads freeze over in early September.
Ice-thickness distribution
Whereas snowfall affects is the area-averaged ice properties, it is not clear how the effects of snow fall vary with ice thickness. Considering a distribution of ice thicknesses makes these effects more apparent, especially in the thinner ice. The annually averaged ice-thickness distributions for the three snowfalls are shown in Figure 3. For presentation purposes, the 25-level and 15-ridged thickness categories have been sorted into a single set of thickness bins, arranged so as to provide greater resolution in the thin ice where surface properties change most rapidly with thickness. The ice in each bin is also separated into open water (OW), FYI, MYI, and ridged ice (RI). Ice thinner than hi l = 0.5 cm is considered to be open water. For all snowfalls, the next four bins are mainly FYI. The area and thickness of this ice are determined mainly by the freezing of OW and ice growth. Some of this thin ice is ridged and creates the ridged ice in the last five bins. The ridged ice-thickness distribution is also not sensitive to the annual cycle of snowfall.
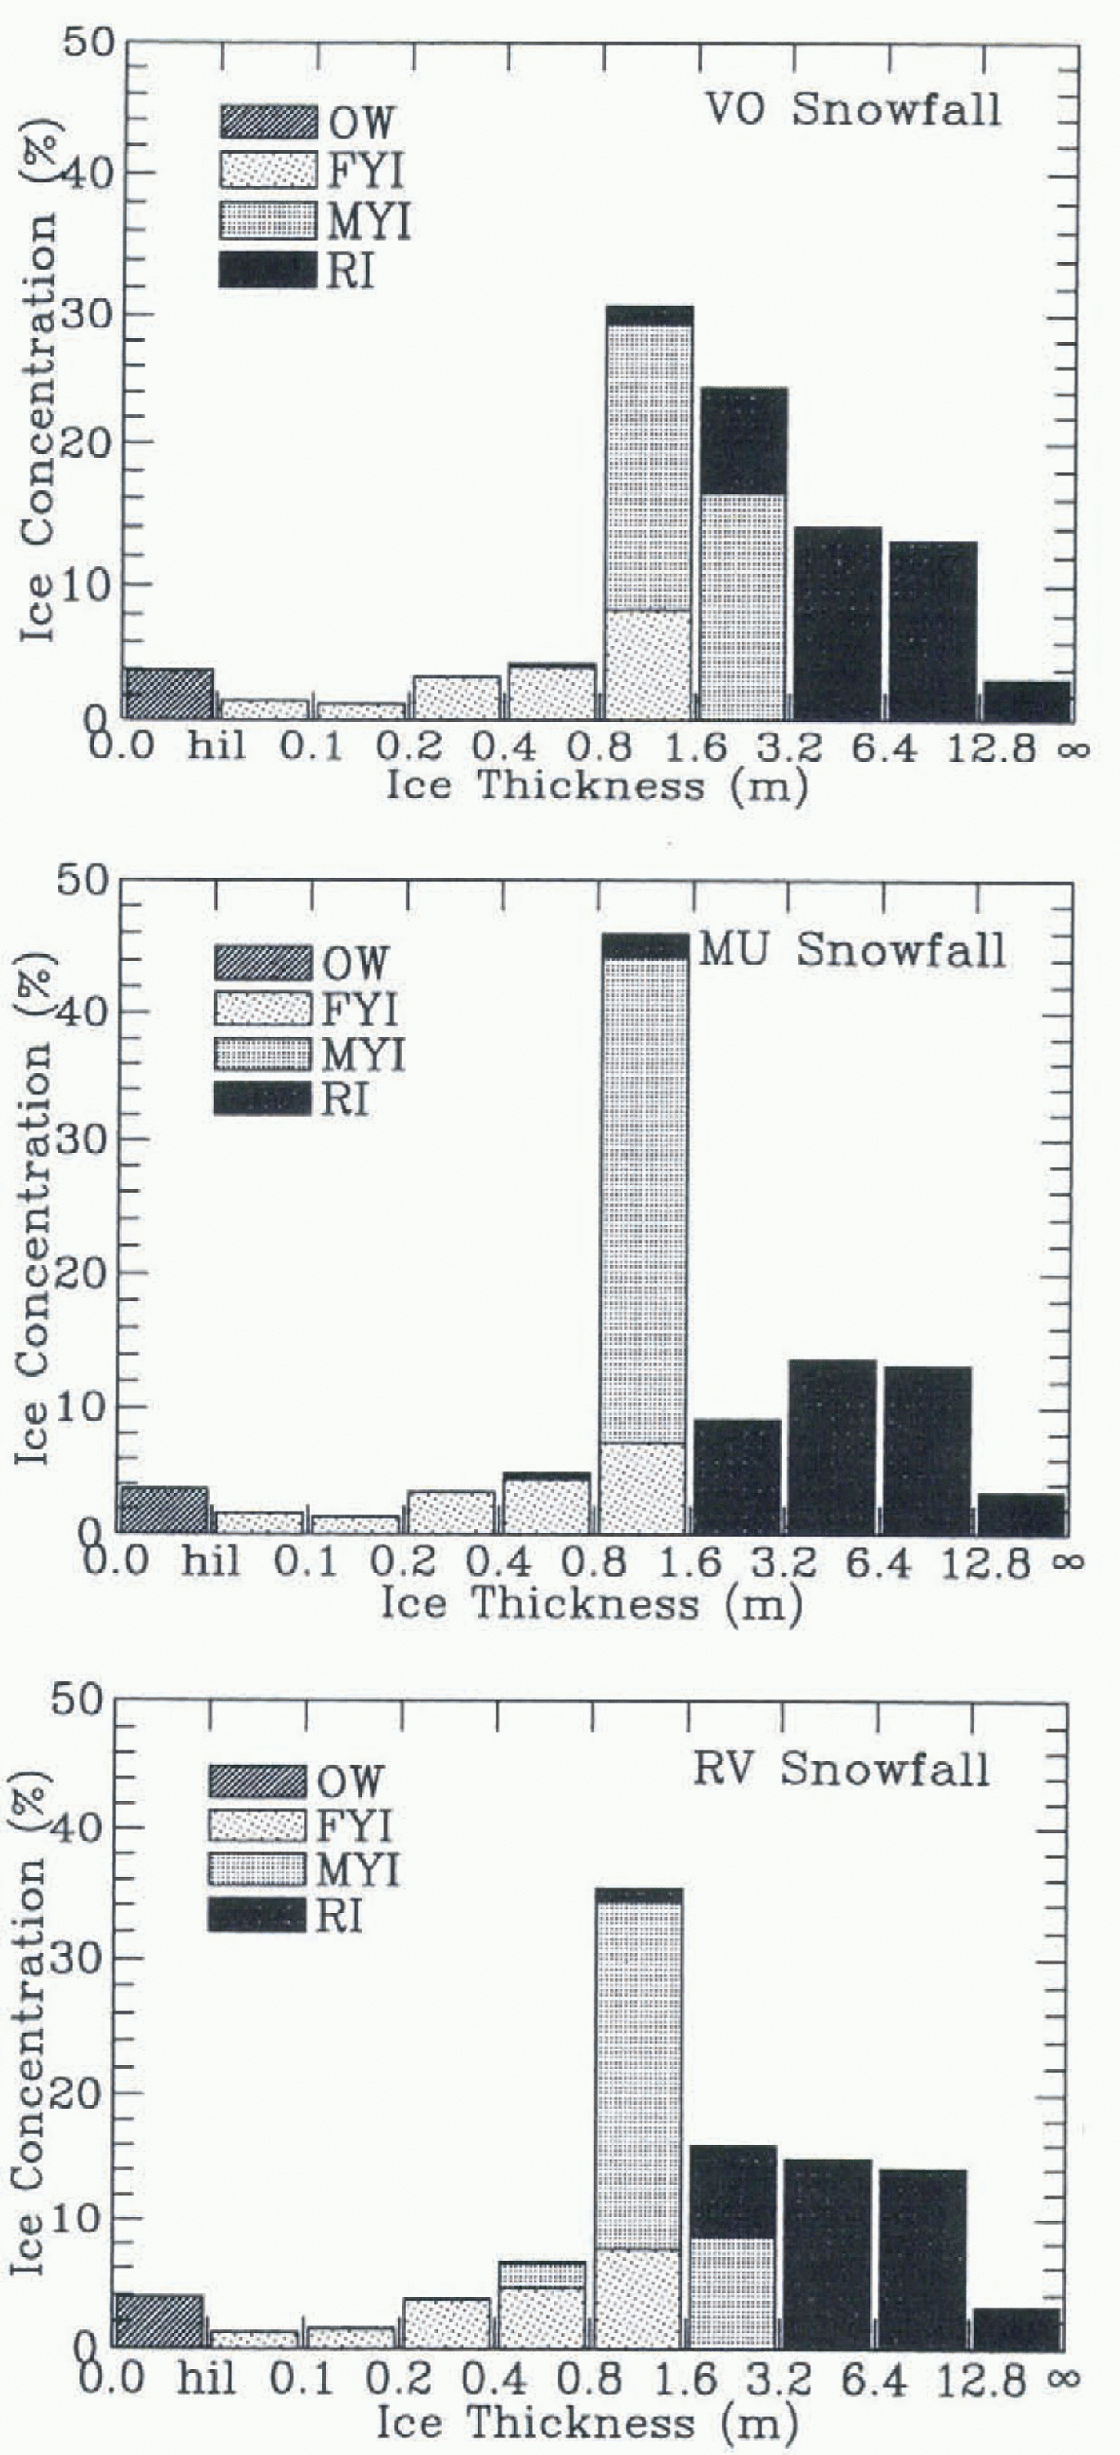
Fig. 3. Annually averaged ice-thickness distribution for (a) the Reference Vowinckel, Orvig and OrvigVowinckel and Orvig (1970) snowfall, (b) the Reference Maykut and UntersteinerMaykut and Untersteiner (1971) snowfall and (c) the randomly varying snowfall. The ice types include open water (OW), first-year ice (FYI), multi-year ice (MYI), and ridged ice (RI). Ice thinner than hil = 0.5 cm is considered to be open wetter.
Snowfall has the largest effect on the MYI distribution. The ice bins in this thickness range (80–320 cm) exchange area all year due to melting and freezing, and are not affected by ridging. The MYI from the VO and RV snowfalls covers a large range of thicknesses, indicating a significant change in thickness due to freezing and melting. The larger snow cover resulting from the MU snowfall limits ice growth, limiting the areal exchange between these bins. In the next section, the annual cycle of snow cover for each of these bins, and the snow-cover mass sinks are examined.
Snow-cover mass sinks
The annual cycles of snow cover resulting from the VO, MU, and RV snowfalls are shown in Figure 4 for selected ice-thickness bins, with ice thicker than 80 cm averaged into a single bin. There is a distinct difference in the annual cycles of ice thicker than 80 cm (bold solid line) and those thinner than 80 cm; the snow cover does not increase continuously with ice thickness. While all ice thicknesses begin to accumulate a snow cover in the autumn, snow is depleted so rapidly from ice thinner than 80 cm that by the end of December, there is no discernable snow cover.
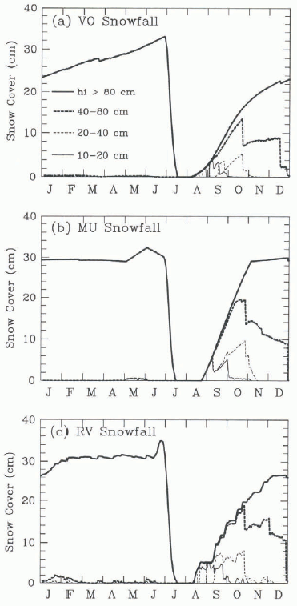
Fig. 4. Annual cycle of the area-averaged snow cover over selected ice-thickness bins resulting from (a) Vowinckel and Orring (1970) snowfall, (b) Maykut and Untersteiner (1971) snowfall and (c) randomly varying snowfall.
As the open water freezes over in the fall and throughout the winter, thin rapidly growing ice is created. As this ice grows enough to move into the adjacent thickness bin, the overlying snow cover is also transferred. We refer to this process as “snow transfer”. Figure 5 shows the most important snow mass sinks for the three snowfalls. Due to the similar thermodynamics of the thicker ice (>160cm), the snow sinks are only shown for ice thinner than 160cm. Processes removing <2% of the annual snow cover are not shown, but include evaporation, and lateral melting and Freezing. For the VO snowfall, sublimation is very efficient at removing snow from the thinnest ice due to the slow accumulation (Fig. 5a). This indicates that the rate of mid-winter sublimation is greater than the VO snow fall rate of 1 mm/8 hours, which would require a latent heat flux greater than 11 W m−2. Latent heat fluxes of this magnitude are present on ice thinner than 40cm, and are in agreement with those calculated by Reference MaykutMaykut (1978) over various ice thicknesses. Snow transfer becomes more important for the first four thickness bins, where ice grow this largest, then reaches a maximum for the 40-80 cm thickness bin. This is where the ice is still thin enough to be growing, but thick enough to have a substantial snow cover to transfer. Most snow is lost to the ocean via ridging for ice 20-80 cm. For ice thicker than 80 em. surface melting becomes an important process for snow removal as it has a substantial snow cover.
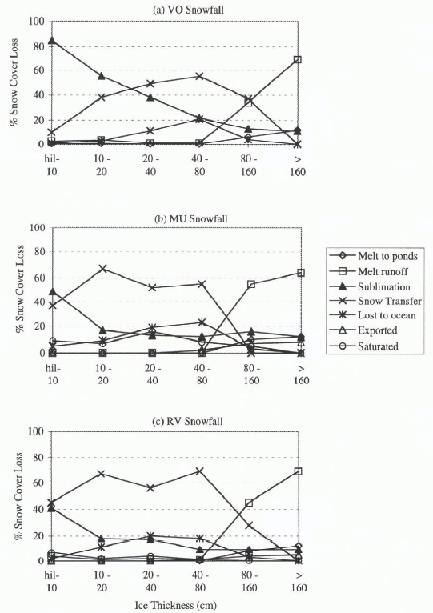
Fig. 5. Variation of snow-cover mass sinks with ice thickness for (a) Vowinckel and Orvig (1970) snowfall, (b) Maykut and Untersteiner (1971) snowfall and (c) randomly varying snowfall.
The thicker snow cover resulting from the MU snowfall reduces the latent heat flux at the surface by moving the snow surface away from the relatively warmer snow–ice interface and decreasing the difference between air- and surface-specific humidities. This reduces sublimation and allows more snow lo be transferred as the ice grows (Fig. 5b). The weight of the thicker snow submerges the snow ice interface, saturating this snow. Saturation is insignificant for the VO snowfall. The thicker snow cover also allows more snow to be lost to the ocean via ridging. More meltwater is produced for the 80-160 cm bin due to the thicket-snow cover present at the onset of the melt season. Less meltwater is produced for ice thicker than 160 em due to the lack of summer precipitation. The snow mass sinks for the RV snowfall, and their variation with ice thickness, are between those of the VO and MU snowfalls due to the rapid growth of snow cover in autumn and the more gradual snow accumulation that follows.
Conclusions
The snow ice-thickness distributions resulting from three different annual cycles of snowfall have been examined. It was found that the annual cycle of the area-averaged ice thickness was sensitive to the rate of autumn snow accumulation. The MU snowfall, with the most rapid accumulation, has the thinnest area-averaged ice thickness. This is due to the insulating effect of the thicker snow cover, which limits ice growth, particularly for MYI.
The surface albedo is sensitive to the timing of the onset of snow accumulation and melt-pond freezing. There is a 13 day period between these two events for the MU snow fall, maintaining the albedo at that of bare ice. These events are simultaneous for the VO and RY snowfalls, causing the surface albedo to increase immediately to the dry-snow value. The timing of the onset of snow accumulation can considerably lengthen or shorten the length of the melt season.
Processes acting to remove the snow cover vary with ice thickness. For thin ice (<80 cm), snow cover is rapidly removed by sublimation and via growth of the underlying ice to a thicker bin. The rapid accumulation of the MU snow cover allows the saturation of 10-20% of the snow cover on thin ice. Snow cover on the thicker ice (>80 cm) is removed mainly by melting. Although snow redistribution by wind was not included in this study, this process would further reduce the snow cover on the thinner ice by transferring it to the thicker ice. Wind and snowfall measurements on a variety of temporal and spatial scales an- necessary to model properly the annual and inter-annual variability of surface albedo, melt season, and snow cover, and accurately to simulate the ice-thickness distribution.
Acknowledgements
This research was supported by NSF OPP-9504261. We would like to thank G. Flato for his helpful comments and suggestions on the manuscript.


