

Schlosser E, Anschütz H, Isaksson E, Martma T, Divine D and Nøst O-A (2012)
Surface mass balance and stable oxygen isotope ratios from shallow firn cores on Fimbulisen, East Antarctica
Ann. Glaciol. 53(60), 70–78
The captions for Figures 2 and 3 were transposed and should have appeared as follows.
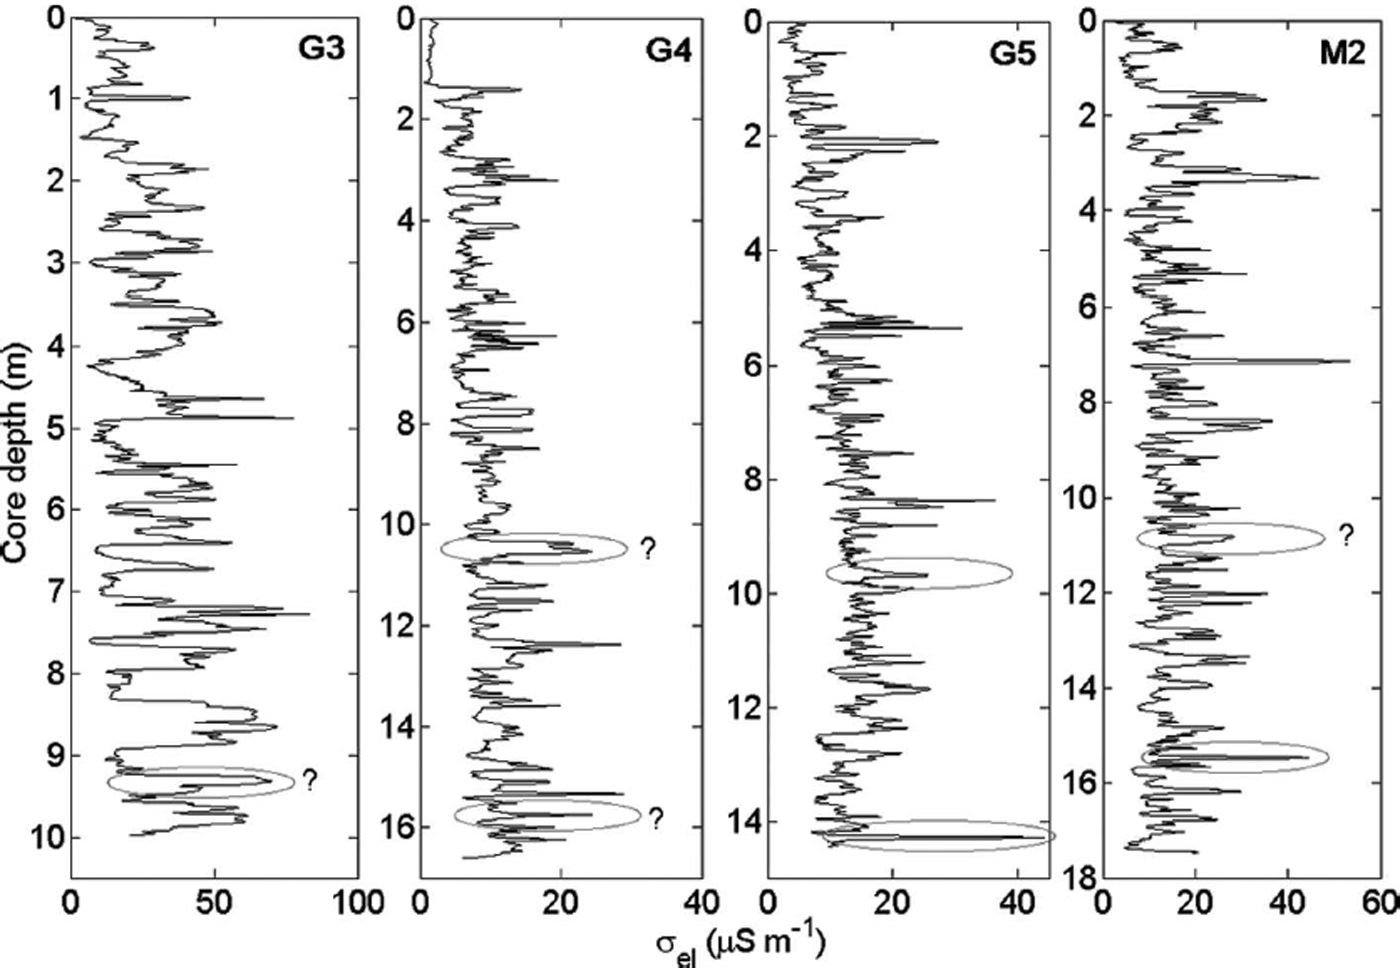
Fig. 2. Electrical conductivity from DEP from firn cores G3, G4, G5 and M2. Suggested volcanic horizons due to eruption of Pinatubo and El Chichón used for dating are marked with circles.

Fig. 3. δ18O–depth profiles of firn cores G3, G4, G5 and M2.
An error in the MATLAB programming resulted in the reproduction of incorrect data in Tables 2 and 3. Corrected tables are provided here.
Table 2. Comparison of SMB of firn cores G3, G4, G5 and M2 for different time periods related to the suggested volcanic time markers (uncertainties in parentheses)
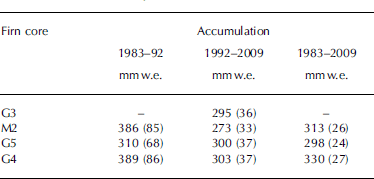
Table 3. Mean annual SMB for G3, M2, G5 and G4 together with the respective standard deviations (in parentheses). Magnitudes of linear trends fitted to the data and their standard deviations (in parentheses); the trends are calculated for the periods before 2007. Bold highlights the trend estimate for G4 core series, which was detected statistically significant at the 5% significance level
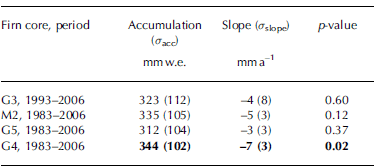
Notes: For testing procedure we used F test with 1 and n–2 degrees of freedom (Draper and Smith, 1998), where n is for the length of the respective time series. The test assesses utility of the proposed model using F statistic defined here as F=R 2/[(1–R 2)/(n–2)], where R is the correlation coefficient between the model and the data. This is essentially a ratio of the ‘explained’ by the model to ‘unexplained’ variance of the data. P-value of the testing for ‘no-trend’ null hypothesis (H 0: slope = 0) is the probability of obtaining the F statistic at least as high as was calculated purely by chance. If the value is <0.05, the hypothesis of ‘no trend’ can be rejected at the 5%significance level.


