


INTRODUCTION
Interest in the brittle behaviour of ice shelves leading to fracture, iceberg calving and even disintegration, presents a challenging observational task because the tangible effects of fracture and calving are often difficult to discover until long after they occur. Fractures are hard to observe because they are often: (1) hidden from view (e.g., below surface snow, on the bottom of the ice shelf and/or below pixel size in imagery); (2) difficult to anticipate; and (3) difficult to address with sensors operating on periodic time schedules. Nevertheless, progress in understanding ice-shelf changes caused by brittle behaviour is needed, which motivates observational attention to brittle behaviour whenever and wherever it occurs. Ultimately, better understanding of ice-shelf brittle behaviour will allow assessment of the probability for imminent iceberg calving and ice-shelf break-up, such as that which occurred on the Larsen B Ice Shelf in 2002 (e.g., Glasser and Scambos, Reference Glasser and Scambos2008; Banwell and others, Reference Banwell, MacAyeal and Sergienko2013).
Examples of observational studies addressing ice-shelf brittle behaviour include the multi-year view of rifting on Pine Island Glacier and the Amundson Sea coast (MacGregor and others, Reference MacGregor, Catania, Markowski and Andrews2012; Jeong and others, Reference Jeong, Howat and Bassis2016), the study of rifting and calving on the Ross Ice Shelf leading to iceberg C19 (Joughin and MacAyeal, Reference Joughin and MacAyeal2005) and study of the ‘loose tooth’ rift system on the Amery Ice Shelf (Bassis and others, Reference Bassis, Fricker, Coleman and Minster2008; Walker and others, Reference Walker, Bassis, Fricker and Czerwinski2013, Reference Walker, Bassis, Fricker and Czerwinski2015). Although extremely valuable, these previous studies exemplify that typically only one observational system (e.g., a satellite remote-sensing platform) is involved in recording the rifting/calving process, meaning that it has often been hard to pin down the exact timing and potential cause(s) of the events. In the present study, we report on a calving and rifting event of the McMurdo (McM) Ice Shelf (Fig. 1) that fortuitously (due to its location near the US National Science Foundation McM Station and the Antarctica New Zealand Scott Base) happened at a time and in an area where different types genres of observations, ranging from satellite imagery to ground survey, could be used to assess its causes. The goals of this study are to present this context and to seek the cause of the calving and rifting event so as to better inform similar studies in the future.

Fig. 1. McM Ice Shelf (red star in the top-left inset) in vicinity of Cape Armitage. Fast ice (orange), portions of the ice-shelf calved (blue), and the rift that propagated (solid red line, pre-existing rift; dotted red line, propagated rift), are indicated on a 15 December 2015 Landsat 8 image. The black arrow indicates the local ice flow direction and speed (~335° True at ~28 m a−1), based on our own GPS velocity data from the 2016/17 austral summer. Green boxes indicate the locations of the satellite imagery shown in Figures 2a and b. Yellow letters indicate locations of photographs shown in Figure 6.
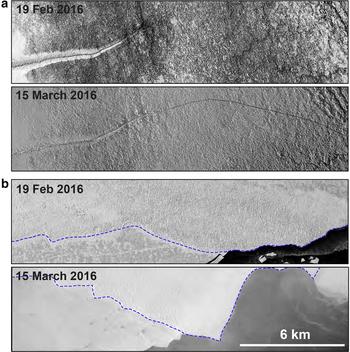
Fig. 2. Worldview imagery (see Table 1 for image IDs) on the dates indicated of: (a) the rift, and (b) the ice front, in the areas of the McM Ice Shelf indicated by green rectangles in Figure 1. (a) Shows the extension of the rift to a terminus beyond the right-hand edge of the frame; and (b) shows the change in the ice front position (indicated by a blue dashed line) due to iceberg calving.
FIELD AREA, DATA AND METHODS
The area of the McM Ice Shelf where the calving/rifting event occurred is located in the extreme southeast corner of McM Sound, <15 km from Scott Base and McM Station (Fig. 1). The McM Ice Shelf is an unusual Antarctic ice shelf for five of its properties: (1) low thickness (~20 m to ~50 m in the study area (Rack and others, Reference Rack, Haas and Langhorne2013)); (2) extensive debris cover; (3) slow ice flow in an oblique direction to the ice front (~28 m a−1, heading in ~ 335° true in the study area); (4) small size (~1500 km2); and (5) unusual oceanographic and meteorological setting, supporting strong basal freezing that balances surface ablation by summer surface melting and year-round sublimation (Glasser and others, Reference Glasser, Goodsell, Copland and Lawson2006). Despite these peculiarities, there are good reasons for studying rifting and calving on the McM Ice Shelf, which may contribute to a greater understanding of ice-shelf stability more generally. The reasons are fourfold and produce glaciological simplifications that remove ambiguity and uncertainty prevalent in other ice-shelf settings. First, the McM Ice Shelf is too thin to present strong gravitational driving stresses that could otherwise influence the calving/rifting process. Second, it has relatively uniform thickness and is confined within a small area where atmospheric and sea-state environments are relatively well documented and, to the degree possible, uniform. Third, it is relatively free of crevassing that usually accompanies rifts on thicker ice shelves. And fourth, although neither the calved icebergs nor the rift are very large relative to features on other ice shelves that bear on Antarctica's stability, the scale of the icebergs and rift measured relative to the overall size of the McM Ice Shelf is comparable with those produced by other, larger ice shelves.
Observations used here to study the calving/rifting event were obtained from diverse sources. Satellite imagery is used to determine the spatial geometries of calving/rifting and to constrain the timing of events within the schedule of satellite overpasses. For example, Worldview-1 and -2 satellite imagery of the rift and the ice front before and after the calving events is shown in Figure 2, and a summary of all satellite imagery used is presented in Table 1. Additionally, due to the proximity of the calving/rifting area to the permanently staffed Scott Base and McM stations (Fig. 1), various additional observations were obtained from ground-based sensors. These provided: (a) photographic and video documentation from various ground-based cameras operated by Scott Base personnel (Fig. 3); (b) weather records from an automatic weather station (AWS) (Fig. 4), located ~4 km south of the ice front where icebergs calved (Fig. 1); (c) broadband seismic data (Fig. 5) from a seismometer located immediately next to Scott Base; and (d) ground observations of the rift made by ourselves (Fig. 6). These four ground-based data sources are described in more detail below.
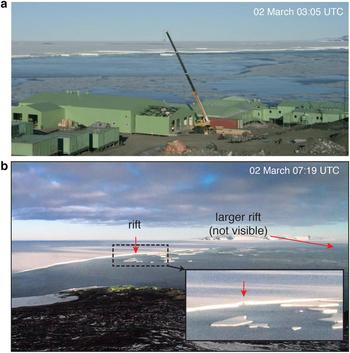
Fig. 3. Tabular icebergs seconds (a) and ~4 h (b) after the calving of icebergs from the McM Ice Shelf, southeast of Scott Base (green buildings, foreground, both images). (a) is a still taken from Frozen South: ice breakout’, by A. Powell (https://vimeo.com/159039693). (b) was taken from a vantage point ~200 m above Scott Base by A. Powell, and shows a remnant rift (vertical red arrow) intersecting the ice front that failed to fully detach any icebergs. The large rift that this study focuses on is not visible in the scene, however its relative location is represented by the sub-horizontal red arrow. The inset in (b) depicts a close up of a remnant rift (vertical red arrow).
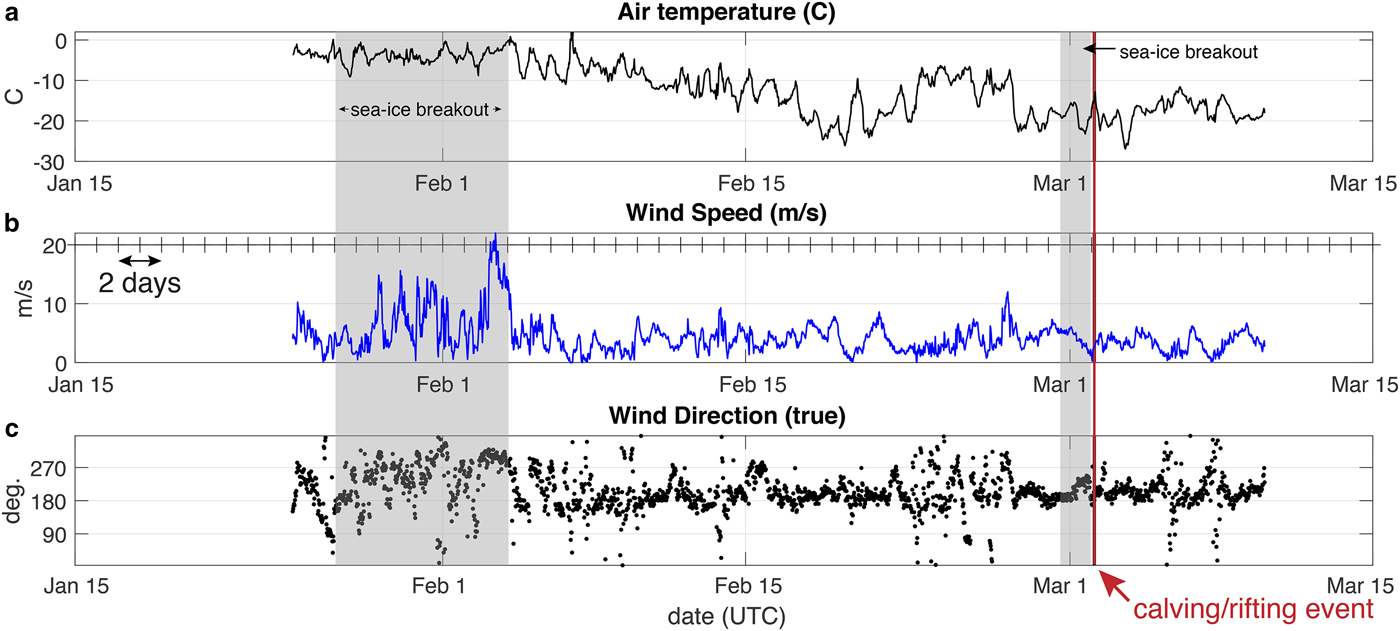
Fig. 4. Meteorological conditions: (a) temperature (°C); (b) wind speed (m s−1); (c) wind direction (degrees True), at 2 m above the surface from 15 January to 15 March 2016, measured at an AWS ~4 km from the calving/rifting site (see Fig. 1 for location). Thirty minute averages of 30 s sample rate data are shown. Vertical shaded zones indicate times of fast ice breakout. Red vertical line indicates the time of the main calving/rifting event.
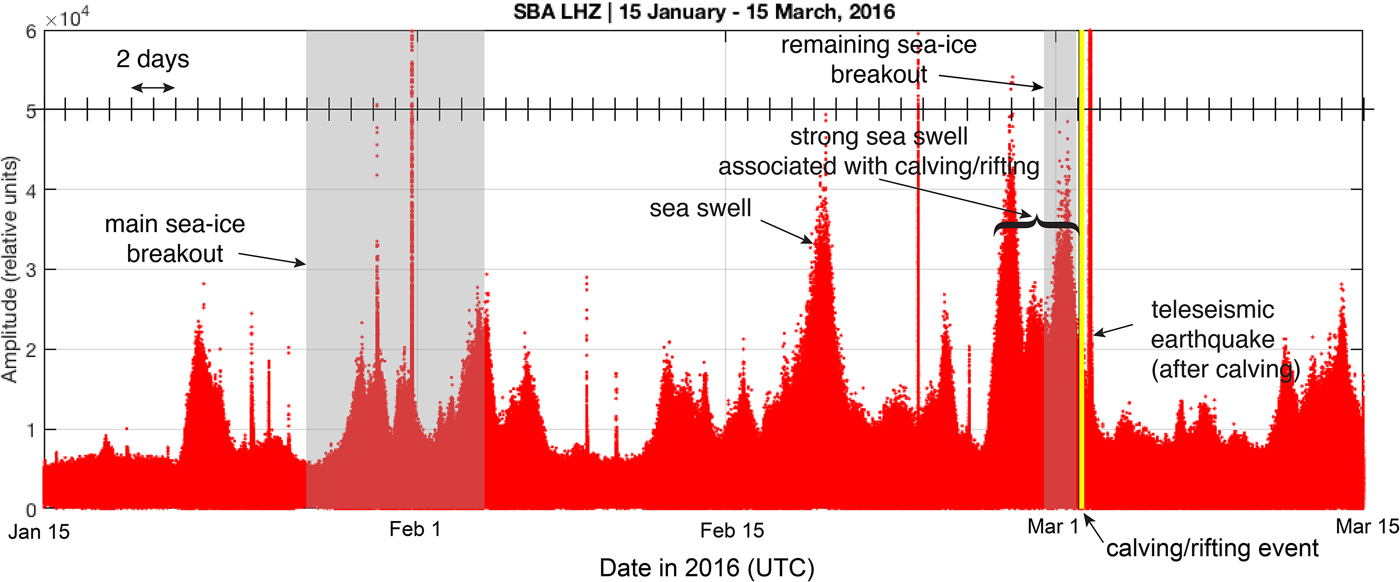
Fig. 5. Seismometer signal amplitude envelope (amplitude of the Hilbert transform of the LHZ time series) from 15 January to 15 March 2016 (amplitude represents ground displacement in relative units) from the SBA seismometer. The two time-periods of fast ice breakout are indicated by the vertical shaded zones. The yellow vertical line indicates the time of the calving/rifting event. Broad zones of increased amplitude are caused by sea-swell associated microseism. Sharp, short-duration spikes of increased amplitude are teleseismic earthquakes, with the most notable occurring on 2 March, ~11 h after the calving/rifting event.

Fig. 6. The widening and extension of the ice-shelf rift discovered by the field party on 10 November 2016 (~8 months after it opened). (a) Here the rift was ~11 m wide and filled with snow (Fig. 1, loc. A). (b) ~1.5 km west of (a), the rift was ~3 m wide and where not snow-filled, the rift side freeboard was ~2 m (consistent with ~20 m ice thickness) and showed little lateral displacement (Fig. 1, loc. B). Icicles draping the sides of the rift indicate that an active sub-surface water system may have been breached at the time of rifting. (c) 500 m northwest of (b), the rift opening was only ~0.2 m wide and ~0.4 m deep (Fig. 1, loc. C).
Table 1. Table of relevant observations. The sensor/methods are listed, with IDs for satellite images
The video footage produced by a time-lapse camera deployed in the heights surrounding Scott Base recorded the exact moment of iceberg calving (Fig. 3). This photographic record was the primary inspiration for this study. (The video is entitled Frozen South: Ice Breakout, by Anthony Powell, and can be seen at https://vimeo.com/159039693.) Observations from this camera also provide documentation of land-fast sea ice (hereafter simply referred to as fast ice) conditions in the bight that forms the extreme eastern end of McM Sound, where the tabular icebergs were calved, as well as of ocean currents and drift patterns associated with the movement of ice floes and bergs once the sea ice was absent. Separate camera equipment from what was used to document the calving was used to assess the presence and periodicity of sea swell in McM Sound. Videos, both time-lapse and with normal frame capture rate, were taken of the vertical heaving motions of sea-ice rubble along the shoreline in front of Scott Base (Fig. 7). The video with the normal frame capture rate was analysed to corroborate the periodicity of sea-swell driven heaving motion inferred from microseism (indicative of sea swell) recorded by the Scott Base seismometer (see below).

Fig. 7. Analysis of sea-ice heave (up and down motion driven by sea swell) along the shore of Scott Base on 22 February 2016, ~8 days before the calving/rifting event. (a) Single frame of the video (Video S2). (b) Inferred vertical motion (in relative, uncalibrated units) of the sea-ice particle indicated by red box in (a). The video was taken at ~17:00 UTC with a 25 frame per second frame rate. The periodicity of the heaving motion, as suggested by the time series in (b) is 15–20 s.
The AWS recorded wind speed and temperature at 2 m elevation with a 30 min averaging rate (30 s sample rate) (Fig. 4), in addition to other meteorological variables that are not used in this study. Although weather data are also available from Scott Base, these data were not used as they are influenced more by microscale wind variations associated with the hilly topography of Cape Armitage.
The main set of seismic observations, which are known to be sensitive to oceanic conditions affecting ice shelves (e.g. Hatherton and others, Reference Hatherton and Evison1962), is the 1 Hz sample rate vertical channel, referred to as LHZ, of the principle seismometer operated at Scott Base, SBA (Fig. 5). SBA is part of the Global Seismic Network, an array of over 150 seismometer stations that operate state of the art digital seismic instrumentation; see: http://www.iris.edu/hq/programs/gsn. SBA is a broadband CMG3-T, located at −77.849°N, 166.757°E and operated by the NZ Institute of Geological and Nuclear Sciences. It is installed on a pier attached to bedrock at the bottom of a 2 m deep vault, so the instrument records directly the accelerations of the solid earth. Since our analysis involves inferring sea swell in the McM Sound from these motions, we work with the relative-scale amplitude of the LHZ channel and do not convert to ground motion (which will be in the micrometre scale for vertical displacement). Instead, we use the LHZ data to identify the time episodes where microseism displaying the characteristics of sea swell (either direct or double frequency, e.g., Longuett-Higgins (Reference Longuett-Higgins1950)) are significantly above ambient background noise, and we also use the frequency dispersion characteristics to determine the likely source of swell propagating into McM Sound from storms beyond Antarctica. For further information about SBA as a record of sea swell in this area, refer to Okal and MacAyeal (Reference Okal and MacAyeal2006) and Bromirski and Stephen (Reference Bromirski and Stephen2012).
During early November, 2016, ~8 months following the calving/rifting event, a field team explored the length of the newly propagated rift on foot. They conducted visual inspection and took photographs that could be compared with those of the stagnant rift taken from the previous austral summer by the same field team. This enabled the rift geometry, the degree of motion along the rift and other physical conditions before and after the rifting event to be determined.
CHRONOLOGY OF EVENTS
A chronology of events and conditions leading up to and culminating in the calving/rifting event can be established from the various modes of satellite and ground-based observations described above. The chronology begins in late January, 2016, when the sea ice in McM Sound began to breakout in several stages, and ends in mid March, 2016, when sea ice returned to McM Sound and no further calving/rifting activity on the ice shelf was observed by satellite imagery (Table 1). The two time-series obtained from the nearby AWS (Fig. 4) and the seismic record of SBA (Fig. 5) provides a continuous record of environmental conditions. Indicated on these two chronologies are the various episodes of sea-ice breakout and the main rifting/calving event.
Throughout January 2016, the majority of fast ice in McM Sound west of the narrow bight located adjacent to Cape Armitage began breaking out and drifting northward under the influence of prevailing winds and currents. This early loss of sea ice constituted the largest change to sea-ice conditions prior to the calving/rifting event in early March, but did not immediately precipitate a change in the ice shelf. About a month later, on 1 March 2016, the small area of fast ice in the narrow bight adjacent to Cape Armitage rapidly broke up and drifted away. Soon after this final sea-ice breakout, early in the day on 2 March 2016 (UTC), the main calving/rifting event on the ice shelf occurred.
The ground-based camera looking at the eastern most section of ice front that calved caught the exact moment of the calving as a time-lapse video (Anthony Powell's, ‘Frozen South: Ice Breakout’) (Fig. 3). At 03:05 (UTC) on 2 March 2016, this video documents a series of icebergs breaking off, en échelon, from the seaward front of the McM Ice Shelf. The icebergs originated in three sections, each ~3 km long, from the outer 200 m of the eastern part of the ice shelf where the ice front curves (Fig. 1). These tabular icebergs were then seen to drift away through the narrow bight between the ice shelf and Cape Armitage, along with remnant sea-ice floes, until they exited the area after ~24 h. Sea ice began to refreeze in the narrow bight and elsewhere in McM Sound in the several days following the calving/rifting event, and was documented both by ground-based cameras and satellite imagery.
The most notable rifting occurred where a large ice-front-parallel rift, which had been static since at least December 1992, reactivated, widened and lengthened westward by >3 km. The timing of this rift extension was not determined by direct observation, although satellite imagery, shown in Figure 2a, restricts the event to a time-interval that contains the calving event. Henceforth, we shall assume that the rift extension occurred simultaneously with the calving, but warn that there is no further means for us to be completely sure of this. Towards the end of the new rift extension, it eventually curved northward toward the ice front but narrowed to a point of un-rifted, intact ice <1 km from the ice front (Fig. 1). This small section of un-rifted ice shelf is therefore preventing the complete detachment of an iceberg. Overall, the ice-front zone over which tabular icebergs detached is ~15 km long, and the section of ice shelf remaining as a nascent iceberg, awaiting the connection of the large rift to the ice front at both ends, is ~15 km long, ~1 km wide and with an area of ~14 km2.
The weather measurements at the AWS through this period (Fig. 4) suggest that several periods of strong wind during late January and early February may have contributed to the first phase of sea-ice breakout from McM Sound that left only the area immediately in front of Scott Base filled with fast ice. At the time of the second, smaller period of sea-ice breakout, occurring on 1 March (as seen in the video Frozen South: Ice Breakout referenced above), the day before the calving/rifting event, winds at the AWS site were calm to mild (Fig. 4). Air temperature at the AWS site in early March was sufficiently cold (−15 to −22°C) to promote freezing of surface water on the ice shelf, so this suggests that if surface hydrology contributed to the rifting/calving process, any water movement would likely have been beneath a surface ice crust or within sub-surface slush layers.
The seismic time series of SBA's LHZ channel (Fig. 5) contains many signals, ranging from arrivals of teleseismic waves generated by earthquakes (most notably, the arrival of Raleigh waves from a M7.8 earthquake, which occurred ~800 km southwest of Sumatra in the Indian Ocean at 12:49 (UTC), 2 March 2016) to microseism associated with sea-swell episodes in McM Sound (Okal and MacAyeal, Reference Okal and MacAyeal2006; Bromirski and Stephen, Reference Bromirski and Stephen2012). Sea-swell microseism (Longuett-Higgins, Reference Longuett-Higgins1950) results from the gentle pulsing of the sea floor and shoreline by the dynamic pressure of water through which surface gravity waves (and flexural gravity waves, if in ice-covered water) propagate. The prominent periods of high amplitude sea swell in McM Sound are visible as gentle swelling and waning of the amplitude envelope shown in Figure 5 over multiple day intervals.
One of the several prominent sea-swell microseism episodes in SBA's LHZ channel occurs as a double peaked amplitude envelope during the 4 days prior to the strong earthquake signal on 2 March (Fig. 5, indicated by a horizontal bracket immediately before 2 March). Considerable effort was made to establish that the relative timing of the rifting/calving event documented by the ground-based cameras and the arrival of the Rayleigh waves associated with the M7.8 earthquake in the Indian Ocean. The calving/rifting event occurred ~11 h prior to the arrival of the earthquake waves, ruling out motions caused by the earthquake as a main cause of the event.
GROUND SURVEY OF THE RIFT
The unusual advantage provided by the McM Ice Shelf setting, where the presence of the rift did not pose major hazards to local ground travel, allowed us to inspect the full length of the rift in November 2016, 8 months after its widening and propagation, and shortly before a subsequent melt season began to alter its surface expression. Conditions along the old rift segment (that widened during the calving/rifting event) and the new rift segment (that propagated during the event) were noted in three places and documented photographically (Fig. 6).
There was no obvious boundary where the old and new rift segments met (Figs 1 (loc. A) and 6a). The floor was exposed at the seaward (north) side in one location and consisted of clear, largely bubble-free ice. Here, the rift wall was ~2 m high, consistent with an ice shelf thickness of ~20 m (Rack and others, Reference Rack, Haas and Langhorne2013). The exposed south-facing rift wall was relatively clean, suggesting no influence of melting since the time it had been exposed. Here, the old part had widened to ~11 m compared with ~2 m observed prior to the rifting event. Ice-shelf features were continuous across the rift, suggesting there was no vertical or lateral shear displacement during rifting.
Approximately midway along the new rift extension and ~1.5 km west of A (Fig. 1, loc. B), the rift was ~3 m wide (Fig. 6b). The walls and floor were exposed in places on both sides of the rift, and the rift walls were ~1.5 m high. The north-facing wall contained many icicles emanating from just below the ice-shelf surface at what appeared to be the boundary between lower density snow/firn above, and higher density firn/ice below, and which contained debris layers. There were also what appeared to be frozen puddles of water at the base of the rift beneath the icicles. Again, there was no evidence of vertical or lateral shear displacement across the rift.
Towards the end of the new rift segment (Fig. 1, loc. C), the field team completed a ~500 m traverse, following the rift feature on foot towards its tip. At the start, the rift was ~0.8 m wide and 1 m deep, and narrowed progressively to ~0.2 m wide and 0.4 m deep (Fig. 6c). There was some evidence of a vertical offset, with the landward (east) side of the rift ~0.15 m higher than the seaward (west) side, an observation that has also been noted by previous studies of rifts on ice shelves (Fricker and others, Reference Fricker, Bassis, Minster and MacAyeal2005; Khazendar and others, Reference Khazendar, Borstad, Scheuchl, Rignot and Seroussia2015). The end of the rift was likely hidden by snow, and therefore its exact location was not obvious.
Our findings are consistent with the rift having widened and propagated in March at the onset of winter, but this occurred too soon after the previous melt season for all subsurface meltwater to have refrozen. The icicles and frozen puddles at B suggest that an immediate effect of the rifting was for subsurface ice-shelf water to weep out of the rift walls where it then froze. The ice floor (>3 m thick at B) is almost certainly sea ice, which froze between the rift walls after the rift widened/opened, as it is unlikely that enough fresh water flowed off the ice shelf into the rift and subsequently froze. However, an augured ice core and specific fabric and chemical analysis would be required to rule out the possibility of fresh water having frozen in at least the upper part of the void. The rift appears to have formed from simple extension, with little evidence for vertical or lateral shear displacement and no evidence of transverse faults or blocks having broken off the rift walls.
ANALYSIS OF SEA SWELL
As described in the chronology of events above, episodes of sea swell in McM Sound were conspicuous in the seismic record of station SBA and, as we shall show below, in a video of the shoreline around Scott Base over the time period leading up to the calving/rifting event. Here we discuss the details of these sea-swell episodes recorded by SBA, and further make the connection of the seismic record with a visual record, obtained by the cameras operating in the vicinity of Scott Base at the time.
Sea swell viewed by seismometer
The spectrogram of the SBA 1 Hz LHZ data shown in Figure 8 shows a distinct separation of the microseism (both direct and double frequency) characteristics at ~0.1 Hz (10 s period) threshold. Below this frequency, the microseism displays various linear swaths, for example, the deep red-coloured areas that tilt from lower left to upper right (Fig. 8c), which are indicative of high-energy, long-period swell generated by single storms at a great distance from McM Sound (MacAyeal and others, Reference MacAyeal2006; Okal and MacAyeal, Reference Okal and MacAyeal2006; Cathles and others, Reference Cathles, Okal and MacAyeal2009; Bromirski and others, Reference Bromirski, Sergienko and MacAyeal2010; Bromirski and Stephen, Reference Bromirski and Stephen2012). Apparently the SBA seismic station is located in a place where the microseism introduced into the solid earth by the effects of sea swell is efficient, as these storm event swaths record the primary swell and not the double frequency microseism observed at other, more inland seismic stations (Longuett-Higgins, Reference Longuett-Higgins1950).
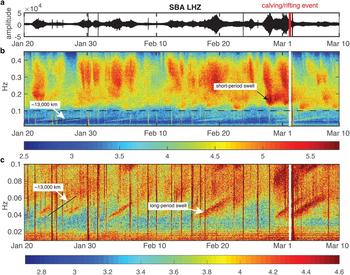
Fig. 8. The SBA seismogram of vertical displacement (a) (relative amplitude units), and spectrograms for the (b) 0.01–0.45 and (c) 0.01–0.10 Hz bands (units log amplitude squared per second). Note that (c) is an enlargement of the lower part of (b) (i.e. below the dashed, black horizontal line). In (b), energy >0.10 Hz is caused by short-period sea swell that is likely local to McM Sound or the Ross Sea immediately N of Ross Island, and is generally broadband and un-dispersed, with sudden onsets likely due to local weather conditions. In (c), swaths of energy <0.10 Hz (i.e. the deep red coloured areas that tilt from lower left to upper right) indicate arrival of dispersed, long-period, sea swell. All of the sea swell arrivals in (c) have dispersion slope df = dt, where f is frequency and t is time, associated with storm centres ~13 000 km (slope indicated by black line) from the McM Sound, which would place the source in the Gulf of Alaska. The red (a) and white (b and c) vertical lines show the timing of the calving/rifting event (2 March).
The slopes of some of the tilted linear swaths (e.g., indicated schematically by the black line in Fig. 8c) are consistent with dispersion produced when the distance to the storm centre is ~13 000 km, which places the storms in roughly the Gulf of Alaska (MacAyeal and others, Reference MacAyeal2006). Transoceanic sea swell propagation of this long distance and from storms in the storm track covering the Gulf of Alaska is well known and has been observed before (Munk and others, Reference Munk, Miller, Snodgrass and Barber1963; Cathles and others, Reference Cathles, Okal and MacAyeal2009; Bromirski and others, Reference Bromirski, Sergienko and MacAyeal2010; Bromirski and Stephen, Reference Bromirski and Stephen2012). This previous work also suggests that it is not common for swell generated by storms in the Indian Ocean or Atlantic Ocean to propagate into the Ross Sea. (The distance is given by x = (g/4π)(df/dt)−1, where g is the acceleration of gravity, t is time and (df/dt) is the observed slope of the frequency, f, swath on the spectrogram.)
Above the 0.1 Hz (10 s period) threshold, the microseism appears in >15 distinct blotches of high energy (i.e. concentrated red areas at ~0.15–0.40 Hz in Fig. 8b) that show very little dispersion (i.e., do not align along a rightward sloping line as does the microseism generated by sea swell from distant storms discussed above). This short-period swell often corresponds with episodes of high-enegy, long-period swell (Fig. 8c), but there are also many episodes of short-period swell that have no long-period component. It is notable that short-period swell and long-period sea swell are both particularly intense in the 4 days before the calving/rifting event (Fig. 8b), suggesting the possibility that both types of swell may have contributed to the calving and rifting events.
Sea swell viewed by ground-based camera
Several videos, both with time-lapse and normal frame capture sequences, were obtained by one of us along the shoreline in the vicinity of Scott Base over the weeks preceding the calving/rifting event (Videos S1–S3). When these videos were viewed with the hindsight that sea swell may have had a role in causing the calving/rifting event, the sea ice along the shoreline depicted in the videos was inspected to see if there was evidence of periodic vertical motion consistent with swell. Periodic vertical motion of the sea ice was found in each video (Figs S1 and S2), and the normal capture-rate video obtained on 22 February 2016 (Video S2) was quantified to deduce the periodicity and the approximate amplitude of vertical motion. To do this, a frame-by-frame analysis was done to measure vertical position of a bright particle of sea ice (location indicated by the red box in Fig. 7a). As the sea ice moved up and down, the numbers of bright and dark pixels changed as the image of the sea ice vertically traversed the small rectangular sub frame. The result, shown in Figure 7b, indicates a 15 to 20 s period, which is consistent with the presence of long-period swell identified in the spectrogram of the seismic data (Fig. 8). Although it is not possible to quantify the amplitude of the up and down motions of the sea-ice particle in the video (the geometry of the camera's position and size of the particle were not recorded), intuitive, experiential interpretation of the video suggests that it was in the centimetre to decimetre range. The result of this video analysis confirms the presence of long-period sea swell affecting the ice cover of the McM Sound in front of the ice shelf, which occurred during the time that the SBA data suggest that high-energy long- and short-period sea swell was impacting the area.
DISCUSSION AND PROPOSED CAUSE OF RIFTING/CALVING
Of all the environmental conditions documented prior to the calving/rifting event, the one that shows the greatest change around the time of the event is the high-energy sea swell (both short- and long-period) recorded by the SBA seismometer and the cameras looking at the sea ice along the shoreline of Scott Base. The alternatives (i.e., occurrence of fast ice, surface (or basal) melting, wind conditions (e.g., Walker and others, Reference Walker, Bassis, Fricker and Czerwinski2013, Reference Walker, Bassis, Fricker and Czerwinski2015)) simply do not show extraordinary change or development over the days leading up to and at the time of the calving/rifting. The breakout of fast ice was complete except for a small area in the extreme eastern end of McM Sound by the time of the event. Air temperatures were below freezing, ruling out surface melting, and basal melting, possibly introducing basal-cut channels leading to weaknesses in the ice shelf, can also be ruled out by the ice-shelf's basal accumulation rates (e.g., Glasser and others, Reference Glasser, Goodsell, Copland and Lawson2006). Nor was there an unusually period of strong wind at the time. Cracks and fractures signifying a response to precursor stress in the ice shelf were not developing in advance of the event. The seismic record and the time-lapse imagery both show the gradual build-up of sea swell immediately leading up to both the calving of numerous small tabular icebergs and the rifting, which plausibly happened together. Therefore, we suggest that sea swell in McM Sound caused the sequence of remnant sea-ice breakout on 1 March (e.g., Squire, Reference Squire1995; Squire and others, Reference Squire, Dugan, Wadhams, Rottier and Liu1995; Langhorn and others, Reference Langhorn, Squire, Fox and Haskell1998; Kohout and others, Reference Kohout, Williams, Dean and Meylan2014), and calving and rifting of the ice shelf on 2 March, 2016.
In various studies (e.g., Bromirski and others, Reference Bromirski, Sergienko and MacAyeal2010; Sergienko, Reference Sergienko2010), long-period sea swell is identified as being more likely than short-period swell to influence an ice shelf by transmitting energy across the ice front into the ice-shelf interior. This likelihood has been an implicit assumption in much of the previous work cited here because the thickness of the ice-shelves under study have been assumed to be ~10 times larger (e.g., >300 m) than the thin McM Ice Shelf (<30 m in thickness in our field area). Swell with short period has short wavelength (e.g., ~30 m for swell with 4 s period); and short wavelength implies greater difficulty transmitting into the ice shelf across the cliff-like ice front. For deep-water waves, the wave motion decays exponentially with depth with an e-fold decay scale on the order of the wavelength. Thus, for a 300 m thick ice shelf with an ice front draft of ~270 m, a wavelength of >270 m is needed for the pressure perturbations induced by the wave to be ‘felt’ at water levels below the bottom of the ice front. This consideration is what has limited attention to long-period swell in studies of conditions on the Ross Ice Shelf and elsewhere. For the McM Ice Shelf, however, the ice-front draft is on the order of <27 m, and this allows waves of shorter wavelength, shorter period, i.e., < 4 s period, to influence the ice shelf. We are thus unable to identify whether it was the long-period swell (period >10 s) generated from storms far from the McM Ice Shelf, or the short-period swell (period <10 s) generated locally in McM Sound and the Ross Sea, that had the greatest effect in introducing the flexure/fracture that likely drove the calving/rifting event.
We suggest that the 4-day episode of high-energy sea swell, both the short- and long-period components, immediately before the main calving/rifting event (Fig. 5) did a combination of things. First, it broke out the sea ice in front of Scott Base, removing any remnant stabilizing force to the ice front that was possible from such a small section of remaining fast ice. Second, it introduced elastic flexure to the ice shelf itself. This flexure could have taken a form such as simulated by Sergienko (Reference Sergienko2010), where it propagates as coupled ice-flexure/water-gravity waves into the region covered by the ice shelf. Third, the repeated flexure of the ice, over a period of days, fatigued the ice shelf, causing fractures to build up on the underside of the ice shelf (e.g., Banwell and MacAyeal, Reference Banwell and MacAyeal2015). Fourth, and stated somewhat speculatively, the combined effects of fractures extending parallel to the ice front and repeated at various distances from the ice front toward the east may have allowed a band gap (range of frequency where wave propagation is not possible) to develop in the flexural gravity wave modes of the ice shelf (Freed-Brown and others, Reference Freed-Brown, Amundson, MacAyeal and Zhang2012). Fifth, with such a band gap, the wave energy impinging on the ice front from the open McM Sound failed to propagate into the ice-shelf covered region, but instead piled up (became evanescent toward the interior of the ice shelf) along the ice front (Freed-Brown and others (Reference Freed-Brown, Amundson, MacAyeal and Zhang2012), their Fig. 4), causing further fracture and fatigue. Sixth, once this fatigue became great enough, and in light of the break-up of the supporting sea ice, the ice shelf simply gave way in the vicinity of the wave pile-up, releasing a series of tabular icebergs and widening and extending an existing dormant rift. Soon after the calving and rifting events on 2 March, the highly energetic sea swell in McM Sound died out (Fig. 5) and fast ice soon reformed in McM Sound, meaning that no further calving or rifting occurred in 2016.
We speculate that breakout of the fast ice (likely aided finally by the presence of short- and long-period sea swell) made the ice shelf more vulnerable to the impact of sea swell. When the fast ice was present, especially in the period prior to January when the main elements of fast ice in McM Sound broke out, its presence would damp the sea swell. An additional factor supporting our speculation is that fast ice, even the small remnant in the bight near Scott Base, would maintain some stabilizing effect on the ice front (e.g. MacAyeal and Holdsworth, Reference MacAyeal and Holdsworth1986; Robel, Reference Robel2017), which would limit its response to all forms of swell, short to long period. The timeline of our observations does not contradict this explanation, however, we cannot say whether it would have been possible for calving and rifting event to have occurred if the small area of fast ice in front of Scott Base had not broken out on 1 March.
CONCLUSION
The purpose of this work has been to document the calving/rifting event that occurred on 2 March 2016 on the McM Ice Shelf using both routine seismic, weather and satellite data, as well as data gleaned from various ground-based cameras and survey. The timeline of events suggests that the calving and rifting occurred over a month after the main breakout of sea ice in McM Sound, and a day after the breakout of a small remaining area of sea ice in the extreme eastern part. This coincidence motivates us to suggest that the agent that triggered the calving/rifting event on 2 March was the same as that which triggered the remainder of the fast ice to breakout on 1 March.
The cause of the calving/rift event on 2 March was high-energy sea swell, however we do not know which type of swell, short or long-period, was more important. Just before the main calving/rifting event, the McM Sound was subject to a double-peaked long-period sea-swell episode associated with storms (highlighted with the bracket on Fig. 5) in the Northern Hemisphere, most probably, the Gulf of Alaska, which had occurred earlier in February. Additionally, short-period sea swell was also particularly intense in the 4 days before the calving/rifting event, suggesting the possibility that this also contributed to the events in addition to the two episodes of intense long-period swell during the same time.
Having offered our best argument for sea swell as the cause of a calving and rift propagation event on the McM Ice Shelf, we conclude with a reminder that the overall theory of what causes propagation and calving remains only fragmentary and incomplete. There may be many factors which drive ice-shelf instability that are dominant in different places and/or at different times of the year. Our study represents one case where a thin ice shelf without significantly strong glaciological stresses to introduce fracture on its own, displays calving and rifting at a time when weather conditions are cold with no surface melting, wind stresses are low and when sea-ice conditions were generally open. To establish a theory of calving and rifting that can cover these conditions and more, and provide predictive power for the evaluation of Antarctic ice-shelf stability in general, further observations of specific calving/rifting cases such as ours should be undertaken.
Supplementary material
The supplementary material for this article can be found at https://doi.org/10.1017/aog.2017.12.
ACKNOWLEDGEMENTS
We thank many scientists at the Polar Geospatial Center for supporting our acquisition of satellite imagery, and the various people associated with the Antarctica NZ research program, the Scott Base winter-over staff, and the U.S. Antarctic Program, and staff of McM Station, who have made our study, particularly our presence in the field, possible. This work was supported by U.S. National Science Foundation grant PLR-1443126 and by Antarctica NZ. AFB also acknowledges support from a Leverhulme Early Career Fellowship, and GJM acknowledges support from a NASA Earth and Space Science Fellowship. We are also very grateful to the Editor, Christina Hulbe, and two reviewers (Ala Khazendar and anonymous) whose helpful comments enabled us to considerably improve the paper.
AUTHOR CONTRIBUTION
AFB, BG, GJM, DRM and ICW conducted the ground traverses of the rift and maintained the AWS on the McM Ice Shelf. BG and AP conducted the ground-based video studies through February and March 2016 during their winter-over stay. DRM conducted the seismological analysis. DM performed the satellite image analysis. AFB, ICW, GJM and DRM were involved in conceiving and writing the manuscript.


 Open access