Introduction
Amid the rapid advent of smart applications and smart electronic goods, there has been increasing interest in smart interfaces. Recent development in technology is push driving the integration of natural and intuitive sensors into everyday consumer devices such as Kinect in our homes. The use of such devices in commercial applications is setting the scene for the development of intuitive, natural, and people-centric applications over the next decades. Such people-centric devices combined with the ability of computational pipelines that can process information emanating from such devices in real-time to provide natural interaction portends a revolution for next-generation interfaces. Natural and intuitive interfaces based on hand gestures in the form of sketches and symbols can replace WIMP (windows, icons, menus, pointer)-based user interfaces. The present work is focused on developing an efficient and accurate system for hand gesture-based interfaces.
Sketches and symbols are rapidly executed freehand drawings. A sketch or symbol serves a number of purposes, such as recording something seen by a person, recording or developing an idea for future use, graphically and quickly demonstrating an image, idea, or principle, or specifying a command. Typically, there are several levels of implementations of user interfaces based on sketching. Such interfaces can be divided majorly into three categories (Shpitalni & Lipson, Reference Shpitalni and Lipson1995).
The categories are based on the amount of information the interfaces attempt to collect from the input sketches: (a) Drawing pads: These are the most basic form of sketchers available. They do not intend to interpret the sketches; however, they smooth the input sketch and provide some general graphics tools, such as copy, paste, resize, and color. (b) 2D sketchers: 2D sketchers interpret the input sketches and classify them into 2D primitives, such as lines, arcs, and splines. Relationships between input strokes, such as parallelism and orthogonality, are also inferred by some 2D sketchers (Pavlidis & Van Wyk, Reference Pavlidis and Van Wyk1985; Durgun & Özgüç, Reference Durgun and Özgüç1990; Jenkins & Martin, Reference Jenkins and Martin1992; Eggli et al., Reference Eggli, Brüderlin and Elber1995; Lank et al., Reference Lank, Thorley and Chen2000). These functions generally provide users better experience and ease of use than the basic drawing pads, especially in computer-aided design (CAD) domain. (c) Three-dimensional (3D) sketchers: These sketchers can be considered advancement over 2D sketchers. 3D sketchers aim to represent the projections of 3D scene using sketches. They also interpret the input strokes as basic geometrical primitives, such as lines, arcs, and corners. Such sketchers address more complex problems because of the inherent ambiguity in projections of 3D scenes (Lamb & Bandopadhay, Reference Lamb and Bandopadhay1990; Martí et al., Reference Martí, Regincós, López-Krahe and Villanueva1993; Lipson & Shpitalni, Reference Lipson and Shpitalni1995).
The systems mentioned above have a reasonably high accuracy of sketch classification. However, they are all built for touch-based interfaces. The proposed non-contact system allows the user to draw 3D sketches with bare hands in the air. Consequently, our objective can be defined as “to develop a novel trainable user-dependent symbol recognizer for single stroke sketches in the air”. The system (1) requires a non-contact depth-sensing device such as an RGB-D (color and depth) camera for user input, (2) has fast training capabilities, and (3) is adaptable for symbols and sketches of any shape, size, and orientation. We present a supervised learning approach for accurately predicting labels for sketches or symbols drawn in the air. Support Vector Machines (SVM) (Cortes & Vapnik, Reference Cortes and Vapnik1995), a feature-based classifier, is used for classification purposes. Additionally, to widen the applicability and functionality of our system, we have also developed and incorporated a static hand pose recognition algorithm.
The most important factor in the success of any machine learning task is the selection of features (Domingos, Reference Domingos2012). Features are quantifiable properties of the observed data that maps it into an informative and discriminating feature space. It is crucial to select relevant feature representation of the data for effective algorithms in recognition, classification, and regression. Features provide a compact and concise representation, which is necessary for computationally efficient algorithms. It conserves computation, storage, and network resources in the training phase and for future use of the classifier (Forman, Reference Forman2003). Additionally, features transform the raw data into a form that is more amenable for learning task. A well-chosen feature set should be robust to accommodate intra-class variations and also provide good inter-class discriminativeness (Maji, Reference Maji2006). Few other properties of good feature descriptors are locality, pose-invariance, scale-invariance, and repeatability (Tuytelaars & Mikolajczyk, Reference Tuytelaars and Mikolajczyk2008). Note that a very large number of features can be extracted from the data. However, increasing the number of features would increase the computation time for extracting the features, time of training the classifier, and time spend in predicting the labels after training. A good algorithm with real-time performance should extract a small set of relevant features and concurrently provide good classification accuracy (above 98%). Hence, it is important to choose a set of features, where each feature provides some new and relevant information. Taking the importance of feature selection into consideration, we define three types of features, including both geometric and statistical features.
The main contributions of the presented work can be summarized as follows.
1. We developed a novel and real-time hand gesture-based system for natural and intuitive interfaces.
2. We have identified a set of novel features for efficient and accurate recognition of 3D sketches and symbols.
3. A novel and real-time static hand pose recognition algorithm was also developed.
4. Multiple interfaces were created for different applications to demonstrate the applicability of our system.
In the next section, we discuss related work. The section ‘Overview’ gives a brief overview of our system architecture. In the section ‘Sketch classification’, we elucidate the steps used in the sketch classification process. Hand pose recognizer is explained in detail in the section ‘Static hand pose recognition’. The section ‘Experiments and results’ presents the results obtained from the evaluation procedure used for assessing our system. Conclusions and future work are described in the section ‘Conclusion and future work’.
Related works
In the recent past, gesture recognition has gained a lot of attention in human–computer interaction (HCI) research community. For instance, in 3D CAD modeling domain, the existing user interface (UI) devices such as the keyboard, mouse, and joystick are not convenient and natural to use in a virtual modeling environment (Pavlovic et al., Reference Pavlovic, Sharma and Huang1997). Gestures, on the other hand, form an intuitive and natural interaction platform for users to work within a 3D environment (Thakur & Rai, Reference Thakur and Rai2015). In order to exploit the use of gestures in HCI, it is necessary to develop methods to help computers recognize and interpret them more efficiently. Various methods have been proposed to recognize gestures efficiently and accurately, such as shape and color cues (Bretzner et al., Reference Bretzner, Laptev and Lindeberg2002), disparity in stereo pair of images (Jojic et al., Reference Jojic, Brumitt, Meyers, Harris and Huang2000), accelerometer-based algorithm (Liu et al., Reference Liu, Pan and Xiangcheng2010), gloves, and markers-based methods (Baudel & Beaudouin-Lafon, Reference Baudel and Beaudouin-Lafon1993; Sturman & Zeltzer, Reference Sturman and Zeltzer1994; Nishino et al., Reference Nishino, Utsumiya and Korida1998), orientation histograms (Freeman & Roth, Reference Freeman and Roth1995), depth data (Liu & Fujimura, Reference Liu and Fujimura2004; Muñoz-Salinas et al., Reference Muñoz-Salinas, Medina-Carnicer, Madrid-Cuevas and Carmona-Poyato2008; Suryanarayan et al., Reference Suryanarayan, Subramanian and Mandalapu2010; Keskin et al., Reference Keskin, Kiraç, Kara and Akarun2011; Shotton et al., Reference Shotton, Fitzgibbon, Cook, Sharp, Finocchio, Moore, Kipman and Blake2011; Doliotis et al., Reference Doliotis, Athitsos, Kosmopoulos and Perantonis2012), etc. In addition to the gesture-based input, other modes of input, such as voice commands and brain–computer interface (BCI) have been used for creating a more natural and intuitive user interface. Nanjundaswamy et al. (Reference Nanjundaswamy, Kulkarni, Chen, Jaiswal, Shankar, Verma and Rai2013) developed a multi-modal CAD interface using gesture, voice, and BCI commands as inputs. Similarly, BCI and touch-based gesture inputs were used by Bhat et al. (Reference Bhat, Deshpande, Rai and Esfahani2013) and non-contact 3D gesture inputs were used by Jaiswal et al. (Reference Jaiswal, Bajad, Nanjundaswamy, Verma and Rai2013) for manipulating 3D objects in CAD environment. A detailed user study on the use of hand gestures in 3D CAD modeling is presented in Thakur & Rai (Reference Thakur and Rai2015).
Identifying gesture through depth data is an active area of research. It provides fast and efficient recognition and thus allows for natural and intuitive interaction (Suryanarayan et al., Reference Suryanarayan, Subramanian and Mandalapu2010; Vinayak et al., Reference Vinayak, Piya and Ramani2012). The gesture has been utilized as a primary modality of interaction in the outlined research. Although great progress has been made in the published literature, the present state-of-art techniques have limitations when applied to real-time applications. Few methods try to first fully reconstruct the 3D hand structure from the input surface, followed by optimization or inverse kinematics-based framework for hand gesture recognition (Lien & Huang, Reference Lien and Huang1998; Stenger et al., Reference Stenger, Mendonça and Cipolla2001; Oikonomidis et al., Reference Oikonomidis, Kyriazis and Argyros2011). However, a common problem for this kind of method is the high cost of the computation, which leads to poor real-time performance. Other methods include fingertip detection (Li, Reference Li2012), finger-direction detection (Wen et al., Reference Wen, Hu, Yu and Wang2012), and Finger-Earth Mover's Distance (FEMD) (Ren et al., Reference Ren, Yuan and Zhang2011; Ren et al., Reference Ren, Yuan, Meng and Zhang2013). All the methods mentioned have their shortcoming in recognizing complex gesture shapes with minor differences, such as the hand poses shown in (d) and (o) in Figure 13. The approach developed in this paper recognizes gestures, in the form of 3D sketches and hand poses, using depth-sensing cameras, such as Kinect and DepthSense. The implemented gesture recognition system avoids the use of cumbersome and not-so-natural to use hand-held peripherals, gloves, and markers on user's hand. The developed system, which recognizes sketches, symbols, and hand poses, is used for interacting with interfaces in real-time. There are few existing commercially available non-touch 3D gesture-based systems, such as Kinect for Xbox. Kinect interface focuses on mapping pre-defined dynamic hand gestures to a limited set of system commands. In contrast, our system can be trained to recognize a broad range of static hand poses and dynamic hand motions. Users also have the flexibility to create new gestures to re-train the system and map them to the various commands on the interface. In addition, our system can also be integrated with a multitude of applications.
There has been a significant amount of work that has been carried out in developing user-dependent symbol and sketch recognition systems for touch-based interfaces. Each of these systems has a different algorithmic approach for classifying inputs (Plamondon & Srihari, Reference Plamondon and Srihari2000). For example, the Rubine classifier (Rubine, Reference Rubine1991), a statistical classifier, uses single stroke sketches or symbols to define a set of geometric and algebraic functions as a feature vector. Classification is carried out by determining the class that gives the largest value for a linear combination of the features. The 13 features used by Rubine focused on how the sketch was drawn rather than what the final sketch looks like. This necessitates that the sketches are drawn in the same way and at the same scale every time for accurate classification. The $1 recognizer (Wobbrock et al., Reference Wobbrock, Wilson and Li2007), on the other hand, carries out classification using a template-based approach (Connell & Jain, Reference Connell and Jain2001). In a template-based approach, an input sketch or symbol is compared with multiple templates provided by the user. Similarity metrics like Euclidean distance and Hausdorff distance are then used to determine which class the input belongs to. Other classification algorithms include decision trees (Belaid & Haton, Reference Belaid and Haton1984), neural networks (Dimitriadis & López Coronado, Reference Dimitriadis and López Coronado1995), principal component analysis (Deepu et al., Reference Deepu, Madhvanath and Ramakrishnan2004), SVM (Bahlmann et al., Reference Bahlmann, Haasdonk and Burkhardt2002), Gaussian classifiers (Matsakis, Reference Matsakis1999), and hidden Markov models (HMMs) (Koschinski et al., Reference Koschinski, Winkler and Lang1995). Ensemble approach could be adopted to combine classification output from multiple classifiers to enhance predictive performance (Rokach, Reference Rokach2010). Rubine classifier, $1 recognizer, and voxel-based classifier were integrated into a classification scheme developed by Babu et al. (Reference Babu, Jaiswal, Esfahani and Rai2014) for single stroke 3D sketches.
Development of classification algorithms for 2D sketches has been considerable to the point where classifiers on an average attain accuracies of 95% or greater. However, when it comes to classifying sketches drawn in 3D space, many of these existing methods are left wanting. These methods perform poorly on 3D sketches due to their inability to account for the third dimension in the sketch. Moreover, input data from a non-contact depth sensing device that tracks the user's palm position in 3D space is invariably noisier than that from conventional touch-based devices. In this paper, we classify dynamic hand movements of users by representing the trajectory of hand motion in 3D space using a novel set of features. There has also been previous work on classifying static hand pose from 3D data using techniques like arm segmentation, and hand pose estimation (Malassiotis et al., Reference Malassiotis, Aifanti and Strintzis2002). In the presented work, a novel and real-time static hand pose recognizer is augmented with efficient and powerful 3D sketch classifier algorithm to develop a robust and accurate system for interacting with natural and intuitive non-contact interfaces.
Overview
Our goal in this paper is to develop a natural and intuitive interface based on 3D sketches/symbols drawn in the air. Figure 1 shows the architecture of our system with both learning and operation phases. The static hand poses and dynamic hand motions of the user were recorded for off-line training in the learning phase. A part of the learning dataset was used in operation phase for testing and tuning the parameters of the trained model. During learning and testing, the users were not provided with any feedback regarding recognition success or failure. This was done to avoid any possibility for the participants to learn and gain experience inclined to the preference of the system and inducing a bias in the learned model. In the operation phase, the recorded template and trained model from learning phase was used to perform hand pose and gesture recognition on-the-fly. The recognition output was then employed to invoke specific commands on the corresponding interface being used.
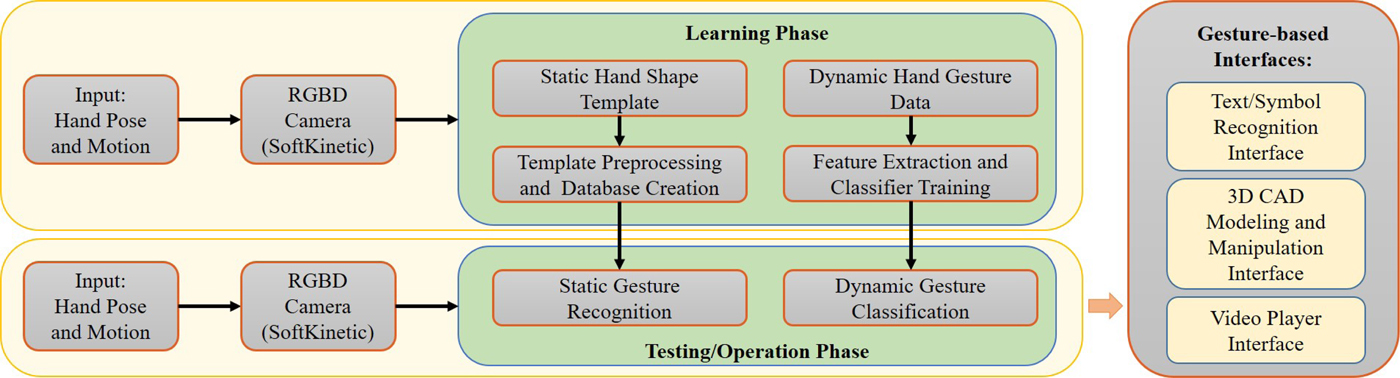
Fig. 1. Flowchart showing both learning and operation phases of the developed system.
The data pertaining to user's palm and its movement was captured using the depth-sensing camera, SoftKinetic DepthSense (DS325). The output from the camera is a gray-scale image containing information of the depth of each pixel in the scene. We use an inbuilt API to record and store user's palm position in 3D Cartesian coordinate system, along with the timestamp at each position. One major challenge of using non-contact depth-sensing cameras for sketch input is that the start and end of the sketch are not well defined. Start and end of sketches in case of tablet-based input devices is explicitly determined by touch input. However, while tracking hand position with a 3D camera, every point is recorded as part of the sketch. To overcome this issue, we have used static hand poses to alternate between an active and inactive state of sketching mode. When the palm is open, the points are recorded as part of the sketch (sketching mode active), and when it is closed, the points are discarded (sketching mode inactive). Using open/close pose of hand provides an easy and convenient way to identify the start and end of strokes (see Fig. 2).
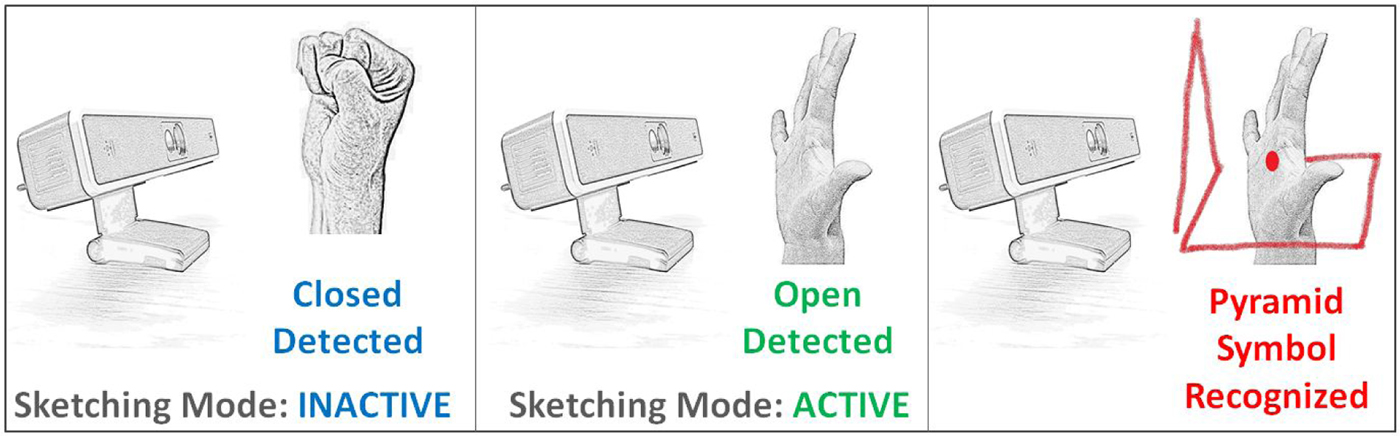
Fig. 2. System setup.
The usage of static hand pose was not limited to identifying the active/inactive state. Sketch classifier application was augmented with static hand pose recognition system to enhance the capability of the developed interface. Several static hand poses were defined to perform various tasks in different applications. SoftKinetic's 3D depth sense camera has inbuilt API to recognize few static hand poses, but the number and types of poses it can recognize is limited and suffers from issues like occlusion. To counter this issue, we developed a novel hand pose recognition algorithm, described in the section ‘Static hand pose recognition’, which can work on a larger number of unique hand-pose classes. Users have the freedom to define their own templates, intuitive, and convenient to them for performing different tasks. To demonstrate the applicability of our static hand pose recognition algorithm, we defined a set of hand poses and used it for CAD model manipulation application (see the section ‘Static Hand Pose Recognition Results’).
With regard to the sketch classification algorithm, the raw sketch data obtained in the sketching mode from the DepthSense camera was first preprocessed. Preprocessing was carried out mainly to eliminate noise in the input sketch and resample the sketch with equidistant points. The Preprocessed sketch was then used to extract 154-dimensional feature vector. The feature vector consists of six speed and curvature features, 120 distance features, and 28 angle features (see the section ‘Geometric and Statistical Features’). A user study was conducted to build a database of 3D sketches (freely available online at the following webpage: https://github.com/madlabub/Sketch-Data). The database of sketches was used to evaluate the performance of the system. In total, 4000 sketch samples were recorded. The sketch database was randomly split into training and test sets. SVM classifier was trained using the features computed on the sketch samples in training datasets. Parameters of the classifier were tuned using fivefolds cross-validation. Finally, the test dataset was used to obtain an objective assessment of the performance of our system.
To demonstrate the applicability of our system, we also developed multiple interfaces for various tasks. Interfaces, such as 3D CAD modeling and manipulation interface was built, in which users can create and manipulate few primitive 3D shapes using predefined sketches. Also, manipulation of those shapes, like orientation, translation, and scale can be adjusted using the static hand pose recognition system. A video player control interface was also developed. Users can use freehand 3D sketches to control the video player. Commands, such as play, pause, stop, fast-forward, and rewind, can be inputted using hand-drawn symbols in the air. A short video abstract of the developed interfaces can be viewed on the following link: http://youtu.be/ExpPFZGPdYw.
Sketch classification
We employ feature-based classification scheme to classify 3D sketches into different classes. The sketch data captured using depth-sense camera is a discrete trajectory of user's palm center in the active (open) state. Each data point of the sketch comprises of three spatial coordinate (x i, y i, z i) and one temporal coordinate t i, where i denotes the index of the data points. We compute several features from the sketched data to build a classifier. Multiple kinds of features are used to ensure robustness of the classifier. However, the number of features was limited based on the trade-off between classification accuracy and real-time performance. Before computing the features, the raw sketch data was passed through a series of preprocessing steps described below.
Preprocessing
Raw sketch data obtained in sketching mode from the DepthSense camera is extremely noisy and non-uniformly sampled. Artifacts are mainly present in the form of outliers and unwanted self-intersections that are created at the beginning of a stroke when users unknowingly draw over initial stroke points while switching between inactive/active gestures. In such cases, it would be extremely difficult to carry out processing without filtering the data first. Smoothing the whole sketch was not considered as a possible solution to the issue as apart from reducing noise, it would also smooth out sharp turns in the sketch. Sharp turns are defining aspect of the sketches and tremendously affect the feature values, which in turn reflect on our classifier's performance. Hence, we perform three steps to eliminate artifacts. The first step involves dehooking the stroke by eliminating the first three points. Dehooking is important because of finite human response time error that happens when the camera records an open palm and switches to active sketching mode, and when the user receives the feedback about it and starts to sketch. Based on the frame rate of the camera used (25 fps), it was noticed that removing first three points usually eliminates the hook created due to finite response time without significantly affecting the shape of the sketch. The second step involves smoothing the start and end of the sketch by convolving the sketch with a Gaussian filter. In this step, the first five and last five points are updated along with their temporal coordinate. The Gaussian filter of size 11 and standard deviation of 5 is used for this purpose. In the third step, we eliminate the outliers using the same Gaussian filter. To determine if a point is an outlier, the sketch is compared with its smoothed version. The smoothed sketch is obtained using the filter, and the spatial coordinates of each point on the original sketch is compared with corresponding new point on the smoothed sketch. If the Euclidean distance between the smoothed point and the original point is within a threshold, the point is retained. Otherwise, it is eliminated. The value of the threshold is empirically defined in terms of the length of the diagonal of the bounding box enclosing the 3D sketch. The bounding box is defined as the smallest box enclosing the sketch with edges along the principal directions of the sketch. The principal directions are computed using Principal Component Analysis (PCA) (Jolliffe, Reference Jolliffe1986). In our implementation, a threshold equal to 0.06 times the length of the bounding box diagonal is used. This value works really well in eliminating outliers and recognizing different gestures used to create demonstrative applications. It is not a critical factor for the accuracy of our system and a range from 0.04 to 0.12 gives acceptable performance. Figures 3a and b shows a plot of a sample sketch before and after the refining step.
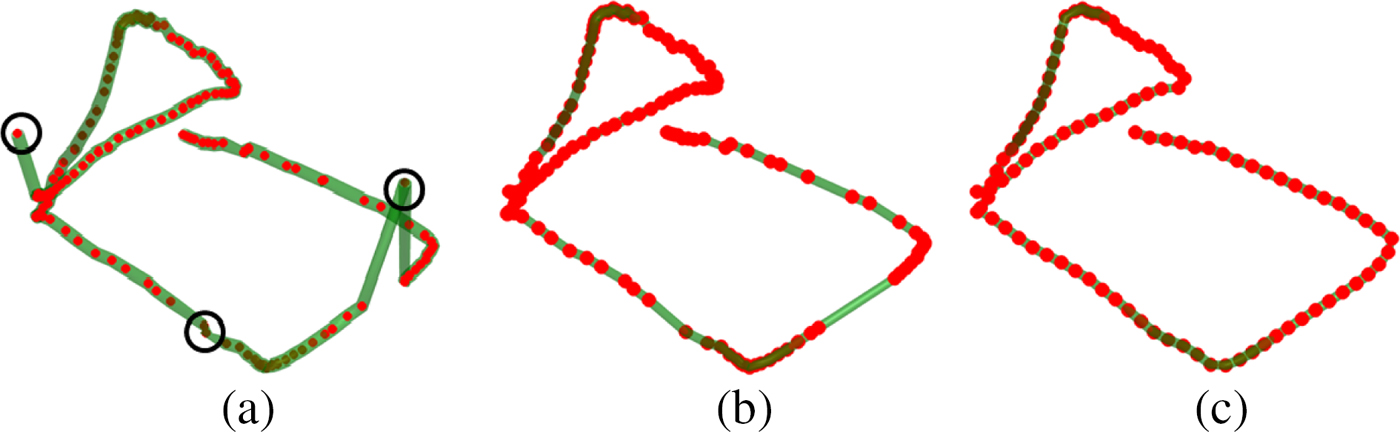
Fig. 3. (a) Raw 3D input sketch, (b) Refined sketch, and (c) Preprocessed sketch after resampling.
The refined sketch consists of non-uniformly sampled points based on the sampling rate of the depth camera and the movement of user's hand. The sketches contain a different number of points which are non-uniformly spaced. Features defined in this paper, to be used by our classifier, require sketches to be uniformly sampled and have an equal number of data points. Hence, after refinement, the sketches were resampled. Each sketch was resampled to consist of N equidistantly spaced points. The resampling algorithm was adapted from the $1 recognizer (Wobbrock et al., Reference Wobbrock, Wilson and Li2007) for the 3D case. The resampled points are generated using linear interpolation between original point set. The resampling process also ensures equal distances between resampled points. The time coordinates were also updated correspondingly using linear interpolation. In this paper, we use N = 64 as the number of resampled points. An example of the resampled sketch is shown in Figure 3c. After resampling the sketches were scaled using their path length. Path length (L) was calculated as follows:
 $$L = \sum\limits_{i = 1}^{N - 1} {\rm \parallel} {\bf p}_{i + 1} - {\bf p}_i{\rm \parallel} $$
where pi represents the spatial position (x i, y i, z i) of i-th data point and  ${\rm \parallel} \cdot {\rm \parallel} $ is the ℓ2-norm of a vector. This normalization was done to ensure that the total path-length of the sketch is unity. Scale invariance property of the classifier is maintained using this normalization step. After these preprocessing steps, several features were computed from the preprocessed sketch data. Details of various features and its computation are provided in the following sub-section.
Geometric and statistical features
Features are computed on each sketch in the database, and the classifier learns a model with these features. The most important factor for the success of any classification task is the features used (Domingos, Reference Domingos2012). Classification accuracy can be substantially improved and the amount of training data can be significantly reduced by using a well-chosen feature set (Forman, Reference Forman2003). The features map each sketch into a high-dimensional feature space. Discriminating between different sketches in a good feature space is easier for classifiers, which is not possible using the raw data. One of the major contributions of this paper is that we have identified a good set of novel features for efficient and accurate recognition of 3D sketches and symbols. Various sets of novel geometric and statistical features were defined for classification purpose. An important aspect of these features is that they are invariant to translation, rotation, and scale of the sketch. Since the indexes of the points are used to compute the features, the features are dependent on drawing direction. Detailed description of features is outlined next.
Speed and curvature features
Speed and curvature are discriminating properties of sketches. Sharp corners in sketches have large curvature and are tend to be drawn at slower speed due to abrupt change in direction. Whereas, curvy segments of the sketches have smaller curvature and are drawn at faster pace (Lacquaniti et al., Reference Lacquaniti, Terzuolo and Viviani1983). Therefore, speed and curvature properties can be used to distinguish between curvy sketches and sketches with more sharp corners. We define three statistical measures each for speed and curvature as features for our classification algorithm. These features are detailed below.
Each sketch contains data points with four coordinates (x i, y i, z i, t i), where the index i varies from 1 to N. First, the arc length l i is computed for each data point as follows:
 $$l_i = {\rm \parallel} {\bf p}_i - {\bf p}_{i - 1}{\rm \parallel} + l_{i - 1}\comma \,\quad 2 \le i \le N\comma \,$$
where pi represents the spatial position (x i, y i, z i) of i-th data point and  ${\rm \parallel} \cdot {\rm \parallel} $ is the ℓ2-norm of a vector. For i = 1, l 1 is defined to be zero. Central difference method is applied to compute the speed s i at each data point using the arc lengths:
 $$s_i = \displaystyle{{l_{i + 1} - l_{i - 1}} \over {t_{i + 1} - t_{i - 1}}}\comma \,\quad 2 \le i \le N - 1.$$
The speed at the first and last points is taken to be same as that of second and penultimate points, respectively. Because of inherent noise in the data, the speed computed has unwanted fluctuations. The speed is smoothed using a Gaussian filter of size 5 and standard deviation of 1 to remove the noise. Three features f s1, f s2, and f s3 are computed from the smoothed speed information of the sketch.
 $$\matrix{ {\,f_{{\rm s1}} = \sigma _{\rm s}/\mu _{\rm s}} \hfill \cr {\,f_{{\rm s2}} = s_{{\rm per90}}/\mu _{\rm s}} \hfill \cr {\,f_{{\rm s3}} = s_{{\rm per10}}/\mu _{\rm s}} \hfill \cr}\comma \, $$
where μ s represents mean of speeds, σ s represents the standard deviation of speeds, s per90 is the 90th percentile of speeds, and s per10 is the 10th percentile of speeds. It can be noticed that we normalized each feature with the mean of speeds. Normalization was done to take into account the fact that same sketch can be drawn at different speeds by the users.
The curvature at a point on the sketch can be calculated by fitting a circular arc in the local neighborhood of that point. The inverse of the radius of fitted arc provides the curvature. A window of seven data points centered at a particular point is considered as its local neighborhood. We then use PCA to transform the local points on a 2D plane. Linear least square fitting is used to fit an arc in 2D local neighborhood. The regression equation in matrix form is given as:
 $$\eqalign{& \left[ {\matrix{ {2\sum x_j^2} & {2\sum x_jy_j} & {\sum x_j} \cr {2\sum x_jy_j} & {2\sum y_j^2} & {\sum y_j} \cr {2\sum x_j} & {2\sum y_j} & n \cr}} \right]\left[ {\matrix{ a \cr b \cr c \cr}} \right] \cr& \quad \quad \quad \quad \quad \quad \quad \quad \quad \quad = \left[ {\matrix{ {\sum - \lpar {x_j^2 + y_j^2} \rpar x_j} \cr {\sum - \lpar {x_j^2 + y_j^2} \rpar y_j} \cr {\sum - \lpar {x_j^2 + y_j^2} \rpar } \cr}} \right]\comma \,} $$
where ( − a, − b) is the center of the arc, the radius 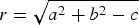 $r = \sqrt {a^2 + b^2 - c} $ and N is 7 in our case. Here, x j and y j correspond to the transformed 2D coordinates of points in the local neighborhood. Solving the matrix equation, we obtain the parameters (a, b, c), and the curvature C i is given by 1/r. Using the window of n = 7 data points restricts us from obtaining the curvature of first three and last three points. We obtain these curvatures by mirroring the values of next three and previous three points, respectively. Again, the curvature was smoothed to remove unwanted noise using Gaussian filter of size 5 and standard deviation of 1. Then, three features f C1, f C2, and f C3 are defined using curvature values:
 $$\matrix{ {\,f_{{\rm C}1} = \mu _{\rm C}} \hfill \cr {\,f_{{\rm C}2} = \sigma _{\rm C}} \hfill \cr {\,f_{{\rm C3}} = C_{{\rm per90}}} \hfill \cr}\comma \, $$
where μ C represents mean curvature, σ C represents the standard deviation of curvature, and C per90 is the 90th percentile of curvature. Contrary to speed features, the curvature features are not normalized because the sketches would have a similar curvature as long as their shape is almost identical. Note that we have already normalized the scale of the sketch with respect to its path length in the preprocessing phase.
Distance features
The distance features defined in this paper was inspired by D2 shape function proposed by Osada et al. (Reference Osada, Funkhouser, Chazelle and Dobkin2002). However, instead of the distribution of the distances between random points, we use the entries of averaged distance matrix as features, that were computed from the ordered set of resampled points on the sketch as described below.
To define distance features, we use the information pertaining to the location of each point, relative to all other points. We exploit the characteristic of the sketch that data points in the sketch are ordered. We utilize this ordering information to develop a robust descriptor called Distance Matrix D. The elements of the N × N distance matrix D is defined as:
 $${\bf D}_{ij} = {\rm \parallel} {\bf p}_i - {\bf p}_j{\rm \parallel}\comma \, \quad i\comma \,j \in 1\comma \,2\comma \, \cdots\comma \, N\comma \,$$
where pi represents the spatial position (x i, y i, z i) of i-th data point and  ${\rm \parallel} \cdot {\rm \parallel} $ is the ℓ2-norm of a vector.
The distance matrix is then subdivided into K × K sub-matrices of size M × M, where N = K*M. The entries of each sub-matrix were averaged to obtain a smaller K × K matrix, which we call Averaged Distance Matrix (ADM). Averaging was done for two main reasons. First, it shrinks the size of the matrix and decreases the number of features. It reduces the computational cost without compromising on the accuracy of the classifier. Secondly, the distance matrix captures local features of the points on the sketch. Locally, each sketch is very similar to each other, and hence a lot of entries in the distance matrix are relatively redundant and non-discriminative. Averaging portions of the matrix to create a smaller matrix reduces the redundancy and improves computational performance. The entries of ADM matrix  ${\bar {\bf D}}$ is given as:
 $$\eqalign{& {{\bar {\bf D}}}_{uv} = \displaystyle{1 \over {M^2}}\sum\limits_{i = (u - 1)M + 1}^{uM} \sum\limits_{\,j = (v - 1)M + 1}^{vM} {\bf D}_{ij}\comma \, \cr & \quad \quad \quad \quad u\comma \,v \in 1\comma \,2\comma \, \cdots\comma \, K.} $$
In this paper, values of 64, 16, and 4 are used for N, K, and M, respectively. A sample matrix with subdivisions and its averaged smaller matrix are shown as a color scaled image in Figure 4.
Fig. 4. Color plot of the distance matrix and average distance matrix.
The distance matrix D and average distance matrix  ${\bar {\bf D}}$ are both symmetric matrices. The entries in the upper triangular part of the ${\bar {\bf D}}$ is used to form the distance features. These entries are concatenated together in a specific order to create distance features. Hence, for K × K sized ${\bar {\bf D}}$, the number of distance features is K(K − 1)/2. It is not necessary to normalize the distance features as every sketch is already normalized with respect to its path length. Normalization with respect to path length restricts the distance features to be in the interval [0, 1].
Angle features
Similar to distance features, angle features was also inspired by the work of Osada et al. (Reference Osada, Funkhouser, Chazelle and Dobkin2002), and are defined using relative angles between directions at each resampled points in the sketch. The direction at each point on the sketch is defined as the direction of the vector joining the current to the next point. For the last point, the direction of penultimate point is considered. The angle between any two directions at point i and point j is calculated as:
 $${\bf A}_{ij} = \displaystyle{1 \over \pi} \mathop {\cos} \nolimits^{ - 1} \left( {\displaystyle{{{\bf q}_i \cdot {\bf q}_j} \over {{\rm \parallel} {\bf q}_i{\rm \parallel \parallel} {\bf q}_j{\rm \parallel}}}} \right)\comma \,\quad i\comma \,j \in 1\comma \,2\comma \, \ldots\comma \, N\comma \,$$
where qi represents the vector joining ith point to its next point i + 1. It is given as (x i+1 − x i, y i+1 − y i, z i+1 − z i), except for the last point, for which vector at a penultimate point is used. The range of inverse cosine function is [0, π]. Hence, the values of the angle features are always in the interval [0, 1].
Using the above expression, N × N dimensional Angle Matrix A is formed. Again, to prevent redundancy and improve computational performance, the M × M sub-matrices are averaged to obtain a smaller K × K dimensional Average Angle Matrix (AAM). The entries of  ${\bar {\bf A}}$ (AAM) is given as:
 $$\eqalign{& {{\bar {\bf A}}}_{uv} = \displaystyle{1 \over {M^2}}\sum\limits_{i = (u - 1)M + 1}^{uM} \sum\limits_{\,j = (v - 1)M + 1}^{vM} {\bf A}_{ij}\comma \, \cr & \quad \quad \quad \quad u\comma \,v \in 1\comma \,2\comma \, \ldots\comma \, K} $$
For angle features, values of 64, 8, and 8 are used for N, K, and M, respectively. The upper triangular entries of  ${\bar {\bf A}}$ are concatenated together to obtain angle features. The number of angle features is K(K − 1)/2 for K × K sized ${\bar {\bf A}}$.
Feature-based classifier
The features defined in the previous sub-section are concatenated together to form a feature vector for every sketch. The feature vector includes speed and curvature features, distance features, and angle features. In our implementation, the feature vector was of length 154 combining all the features discussed above. The feature vector is essentially a mapping of a sketch in a high dimensional feature space. The feature vectors calculated from the database of sketches with different classes of sketches were used to populate the feature space. Using the feature vector database, a SVM classifier (Cortes & Vapnik, Reference Cortes and Vapnik1995) was learned. An elementary implementation of SVM classifies linearly separable data into two classes ± 1, indicating whether that data point is in (+ 1) or out of (− 1) the set that we want to learn to recognize. SVM classifier learns a hyperplane model that separates the linearly separable data in N-dimensions with the largest margin (Press, Reference Press2007). A hyperplane in N-dimensions can be defined by the equation f(x) ≡ w.x + b = 0, where x is an N-dimensional feature vector, w is a normal vector to hyperplane, and b is an offset. The SVM learning problem can be formulated as a quadratic optimization problem:
 $$\matrix{ {\mathop {\hbox{min}}\limits_{\bf w}} \hfill & {\displaystyle{1 \over 2}{\bf w}.{\bf w}} \hfill \cr {\hbox{subjectto}} \hfill & {y_i({\bf w}.{\bf x}_i + b) \ge 1,\;i = 1, \ldots, m} \hfill \cr}$$
where y i are labels (± 1) and M is the number of training samples. This optimization problem can be solved using quadratic programming.
More advanced implementations of SVM can separate even linearly inseparable data. This is achieved by using kernels. Some popular kernels are quadratic, polynomial, radial basis function (RBF), and sigmoid function. Further, multi-class classification can be accomplished by training multiple one-versus-all classifiers. In this paper, we have used multi-class SVM classifier with RBF kernels. Preliminary experiments revealed that RBF kernels performed best among other choices of kernels, such as linear, polynomial, and sigmoid kernels. MATLAB library LIBSVM (Chang & Lin, Reference Chang and Lin2011) was used for building and using SVM model.
To train and evaluate the SVM classifier, first, the dataset was divided into two sets: training and testing. Fivefolds cross-validation on the training dataset was used to train the classifier and obtain an optimum value of several parameters required for the classifier. The testing dataset was used for generalization so as to get accuracy performance of the classifier on unseen data. The parameters obtained using validation include the parameter C and γ. The parameter C represents the inverse of the regularization parameter and γ is related to the standard deviation σ of RBF kernel (γ = 1/2σ 2). More details and results are highlighted in the section ‘Sketch Classification User Study’.
Static hand pose recognition
In addition to the 3D sketch classification algorithm, our system also incorporated static hand pose recognizer. The primary application of hand pose recognizer system was to switch between an active and inactive state of sketching mode. However, few hand poses were also used in 3D CAD modeling and manipulation interface. Template-based recognition approach was adopted for recognizing the static hand-pose. The poses were represented as an open surface in 3D space for the front view of the user's hand. We address the captured data as 2.5D hand model. The raw 2.5D data obtained for hand shape was preprocessed to ensure accurate and efficient recognition. The preprocessed hand models for different poses were saved as templates. The templates were later used for matching during the recognition process. The following subsections detail the steps involved in the generation of database and recognition algorithm.
Preprocessing and database creation
The principal objective of the database creation was to generate templates for hand poses so as to enable efficient matching of hand surfaces. Creating templates comprises of three main steps: (1) data acquisition, (2) data cleansing (segmenting off useless section in the 2.5D hand shape), and (3) reorientation. Apart from database creation, these steps were also used for preprocessing all input hand pose captured from the depth-sensing camera.
Data acquisition
Most of the model-based shape matching methods need a 3D reconstruction that relies on multiple 2.5D shapes captured at different viewing angles (Chang et al., Reference Chang, Bowyer and Flynn2006; Lu et al., Reference Lu, Jain and Colbry2006). Unlike these methods, we directly use the 2.5D hand shape captured by depth-sensing cameras as the template to create our database.
The 2.5D surface contains only partial information of the real hand model. Single 2.5D hand shape information might sometimes be insufficient to capture all the relevant information of a real hand to enable efficient recognition. Therefore, letting the system acquire multiple snapshots from slightly different orientations of the hand was considered as a solution to this issue. In doing so, our system was not only able to capture more information about a particular hand pose, but it was also able to compensate for the unexpected torsion caused by the low resolution of time-of-flight depth cameras. More the snapshots/templates acquired for a hand pose, more accurate the system would be. However, more templates also increase the computation time during recognition. Hence, multiple views of same hand pose were stored only for few hand poses. This process is explained in more detail in the section ‘Static Hand Pose Recognition Results’.
Data cleansing
The segmented hand shape taken from iisu™ SDK of DepthSense camera includes a small section of the forearm connected to the wrist, and the length of this section is uncertain (see Fig. 5). Preliminary tests indicated that this piece of data introduces errors that adversely affect the accuracy of the recognition process. Hence, we applied a simple data cleansing method to tackle this issue. It was assumed that the user's hand in front of the camera is always aligned such that the palm is facing the camera and the line joining the wrist center with palm center is roughly aligned with the upward y-axis as shown in Figure 5. This assumption is valid usually, as the users tend to use the camera in the similar fashion.
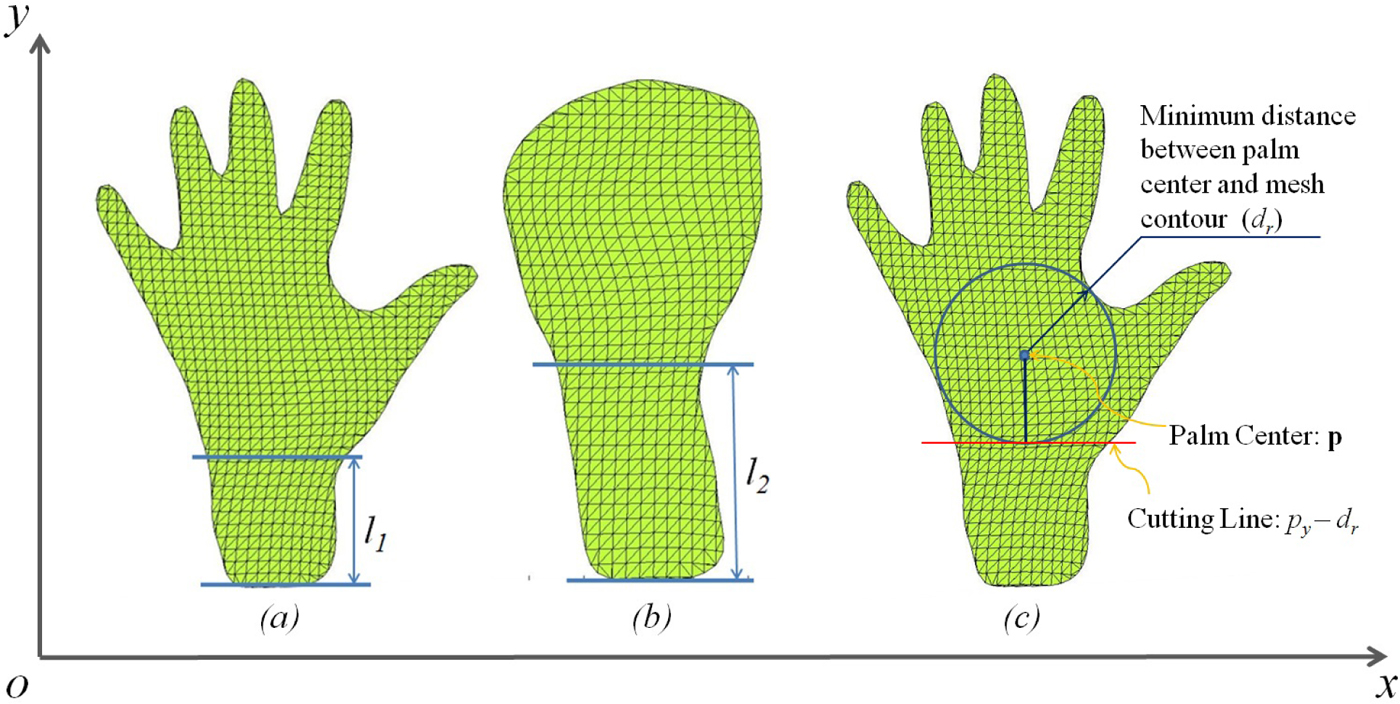
Fig. 5. (a) and (b) indicates the difference in length of forearm section in two poses (l 1 <l 2), and (c) illustrates the method used to segment off the forearm section.
For segmenting off the forearm data, we first found the minimum of Euclidean distances between the palm center p and each point on the contour of the hand ci. This calculation returns the radius of the largest inscribed circle within the palm of the user's hand, which can be written as d r:
 $$d_r = \mathop {\min} \limits_i ({\rm \parallel} {\bf p} - {\bf c}_i{\rm \parallel} ).$$
The y-coordinate for each vertex vi on the hand model was compared with the y-coordinate of the palm center p, and if v iy <p y − d r, the i th vertex was removed from the point set of hand model, as shown in Figure 5. Note that this method is scale invariant, thus insensitive to different hand sizes and the distance between hand and camera (provided the hand be within the detection range of the camera).
Reorientation
Reorientation of the hand model was required because the raw data of the hand model was in arbitrary orientation with respect to the camera's coordinate system. We extract several features of the captured hand shape to align it consistently with all the other template hand shapes. The objective of extracting these features is to calculate the rigid transformation for aligning the input model to the database models and center it at the origin. The palm center location and normal was extracted from iisu™ SDK of DepthSense camera, and two end points on the cutting line was obtained from the data cleansing step described in the section ‘Data cleansing’. The transformation of the database model included centering the model and alignment of the coordinate axis. Model centering is done by shifting the model palm center to the origin by simple translation operation. Centering is followed by aligning the palm center normal to the positive z-axis. This alignment constrains five degrees of freedom of the model, which are translation along x, y, and z axes, and rotation about x and y axes. The rotation about z axis, the only degree of freedom, was constrained using the end points of the cutting line, pstart(x 1, y 1, z 1) and pend(x 2, y 2, z 2). The hand model was rotated about the z-axis by an angle θ to make the cutting line's projection on x − y plane parallel to the x-axis. The rotation angle θ between the cutting line's projection and x axis is given as:
 $$\theta = \mathop { - \tan} \nolimits^{ - 1} \left( {\displaystyle{{y_2 - y_1} \over {x_2 - x_1}}} \right).$$
Figure 6 shows the hand model before and after the reorientation process.
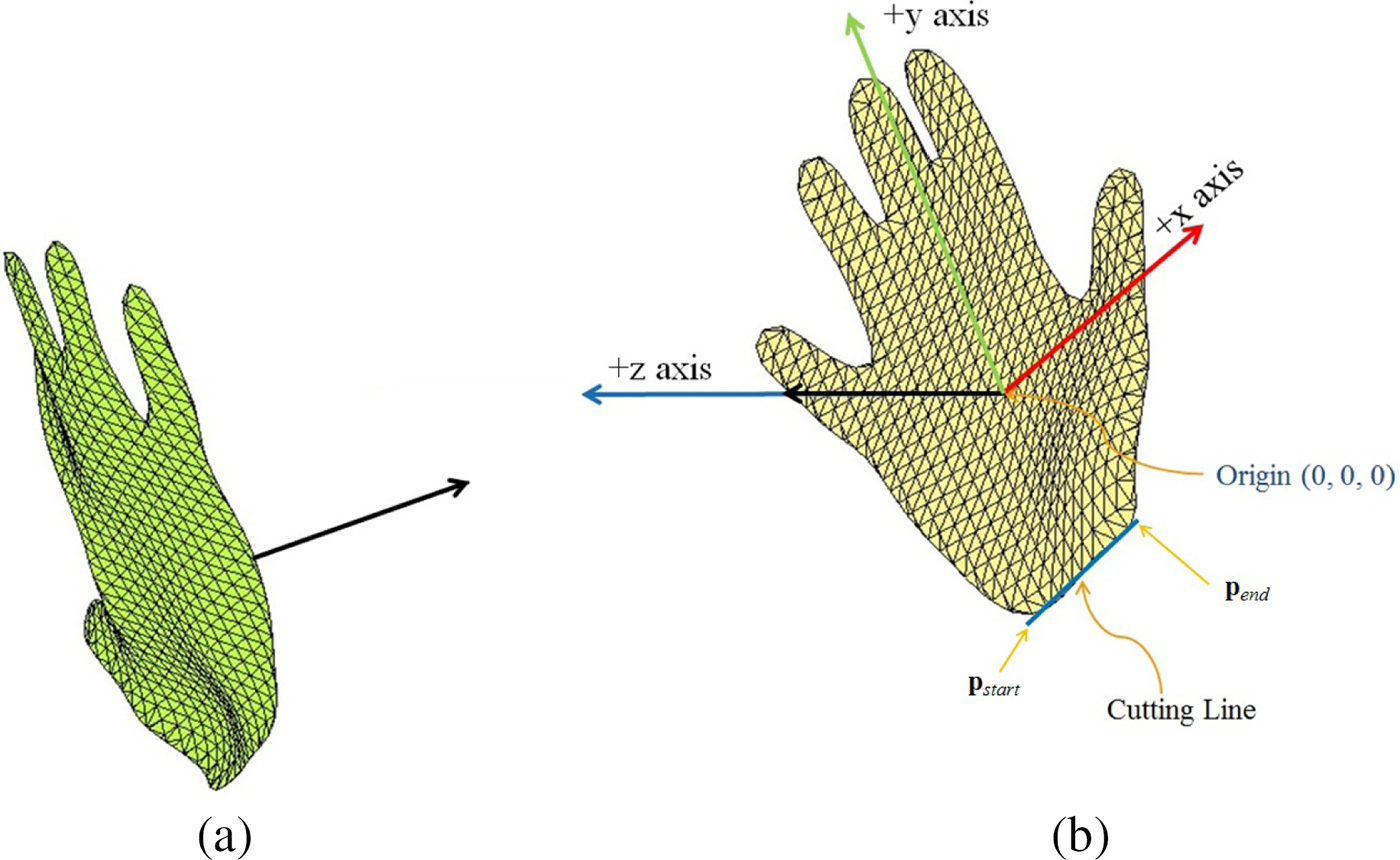
Fig. 6. (a) Original position and orientation of captured hand shape, (b) Position and orientation of hand shape after transformation.
Recognition algorithm
After the preprocessing phase, the input hand pose is compared with database hand poses. We developed a distance metric to obtain the most similar hand pose among the database. The key components of the implemented static hand pose recognition algorithm are described in the following sub-sections.
Aligning input hand pose with a template pose
The reorientation process in the preprocessing phase only coarsely aligns the input hand model with the coordinate system. As seen in Figure 7, for a proposed hand pose shown in the image on the left, the input shapes (dark yellow) captured at different times, align in a different way to the same template (light yellow). This misalignment is mainly caused due to the low resolution of the depth-sensing cameras. Low resolution leads to errors in the calculation of the palm center and palm center normal. Also, the assumption used for user's hand orientation while calculation of the cutting line is sometimes unreliable. Further alignment is necessary while matching an input hand pose with database hand models. Iterative Closest Point (ICP) algorithm is a well-known method employed to find the minimum distance or dissimilarity measure between two shapes. The steps in using ICP include: (1) pairing each point on the source shape with the closest point on the destination shape, (2) computing the transformation matrix for aligning source data points with destination shape, and (3) iterating steps 1 and 2 until convergence. The goal of ICP is to find the optimum transformation matrix Mopt, which can be written as:
 $${\bf M}_{{\rm opt}} = \mathop {{\rm argmin}}\limits_{\bf M} \sum\limits_i {\rm dist}({\bf M} \cdot {\bf a}_i,{\bf b}_i),$$
where ai is the ith source point, bi is corresponding closest point found on the destination shape, and dist( · , · ) is a distance metric used for computing the distances between points. ICP theoretically provides a good measure of dissimilarity; however, it has some limitations. Firstly, it might be difficult to find global optima for the transformation matrix. Also, ICP might be computationally expensive as the numbers of iterations required for convergence are usually very high. The worst-case running time for ICP is between Ω(nlogn) and O(n 2d)d, where N is the number of sample points and d is the number of dimensions. From our experiments, the ICP-based implementation took about several seconds to yield the local optimal matching, causing users to notice latency in the computation process. Hence, ICP-based method is not suitable for a real-time system.
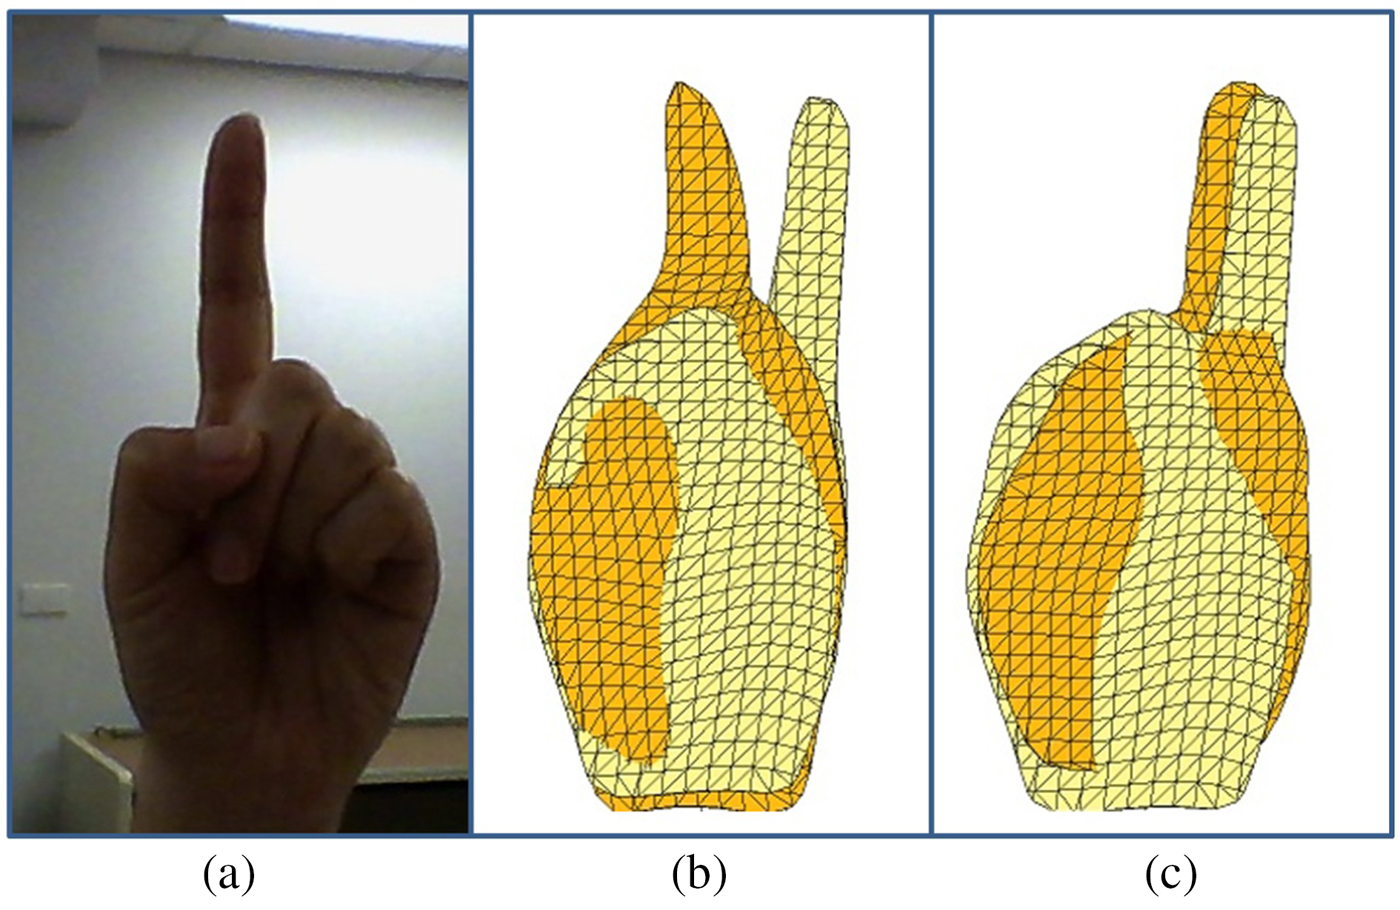
Fig. 7. (a) A sample hand pose, (b) and (c) shows different alignment results for the sample hand pose with the same template.
In our implementation, instead of relying on slow ICP algorithm, the features computed during the reorientation process is used. For better alignment of the inputted hand shape with database templates, we lift the constraint of rotation around the palm center normal axis by the small angle. In our experiments, it was observed that a rotation within the range of ± 10° would be sufficient to align bulk of the surface areas between source shape and destination shape. In this regard, since the palm center normal is aligned with the positive z-axis, the rotation transformation about it is represented by the following sparse matrix:
 $${\bf R} = \left( {\matrix{ {\cos \theta} & { - \sin \theta} & 0 & 0 \cr {\sin \theta} & {\cos \theta} & 0 & 0 \cr 0 & 0 & 1 & 0 \cr 0 & 0 & 0 & 1 \cr}} \right)\comma \,$$
where θ ∈ [ − 10°, 10°] is the rotation angle around z-axis. To obtain a suitable value of θ, we compute the distance between transformed input hand shape and the template at every 2° value within ± 10°. The θ value that gives the least distance provides the final R matrix to be used. The relation between the raw input shape g and the transformed shape  ${\bar {\bf g}}$ is given as follows:
 $${\bar {\bf g}} = {\bf R} \cdot {\bf M} \cdot {\bf g}\comma \,$$
where M is the transformation matrix used for reorientation during the preprocessing phase.
Two-way surface matching distance
The distance between any two hand poses can be computed using many possible distance metrics. Point-to-plane (Low, Reference Low2004) is one such distance metric; however, it is not a good measurement for hand pose recognition. Its drawback is demonstrated in Figure 8, where point-to-plane distance does not accurately reflect the dissimilarity between two shapes. The metric used in our implementation is two-way surface matching distance Λ( · , · ). Two-way surface matching distance is the sum of the two directed surface matching distances Λ( · , · ). Directed surface matching distance is a point-to-point based root mean square Euclidean distance from the source shape A to the destination shape b, given as follows:
 $$\lambda ({\bf a}\comma \,{\bf b}) = \displaystyle{1 \over N}\sqrt {\sum\limits_{i = 1}^N {\rm \parallel} {\bf a}_i - {\bf b}_i{\rm \parallel} ^2}\comma \, $$
where N is the number of points in the source shape a, ai is the i th point on source shape, and bi is corresponding closest point found on the destination shape b.
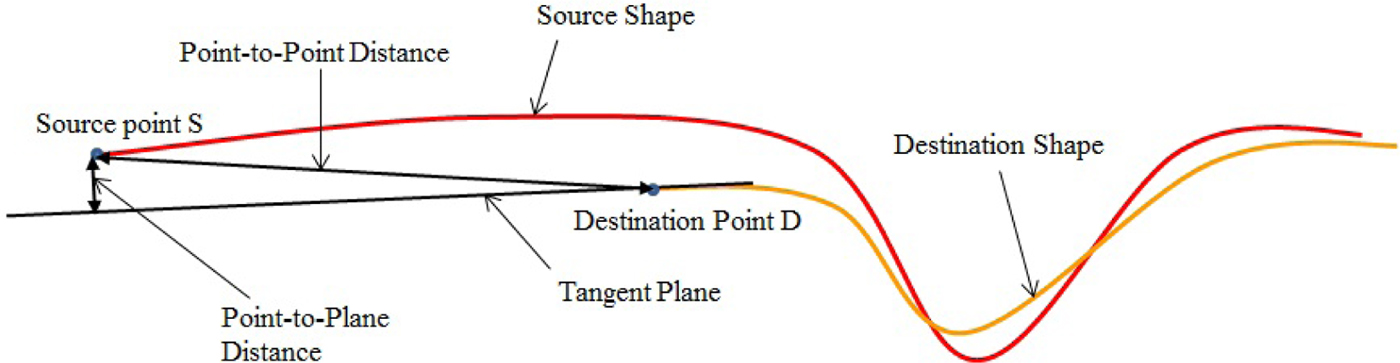
Fig. 8. Point-to-Point error and Point-to-Plane error between two surfaces.
To compute the dissimilarity between the transformed input hand pose  ${\bar {\bf g}}$ and a template hand pose h, we compute the two-way surface matching distance, given as follows:
 $$\Lambda ({\bar {\bf g}}\comma \,{\bf h}) = \lambda ({\bar {\bf g}}\comma \,{\bf h}) + \lambda ({\bf h}\comma \,{\bar {\bf g}}).$$
The input hand pose is matched with each template in the database successively. The recognition decision is made based on the shortest  $\Lambda ({\bar {\bf g}}\comma \,{\bf h})$ value.
Experiments and results
This section demonstrates the experiments and results for two categories: (1) sketch classification, and (2) static hand pose recognition.
Sketch classification user study
To obtain an objective assessment of our sketch classification approach, we conducted an institutional review board (IRB) approved formal user study using four sketch/symbol domains as shown in Figure 9. The study involved ten participants with ages between 20 years to 29 years and having an engineering background. Among the ten participants, five had no experience using depth-sensing cameras in the past, two had some experience playing games using Kinect for Xbox, and three had some prior experience with Softkinetic DepthSense cameras. Each sketch domain consists of ten symbols with ten examples of each type for every user. The study was conducted for each domain independently. The study involved ten participants. As the participants in our user studies had little experience using the DepthSense camera, they were supervised while sketching the first symbol for each domain. The pertinent data for the user study is shown in Table 1.
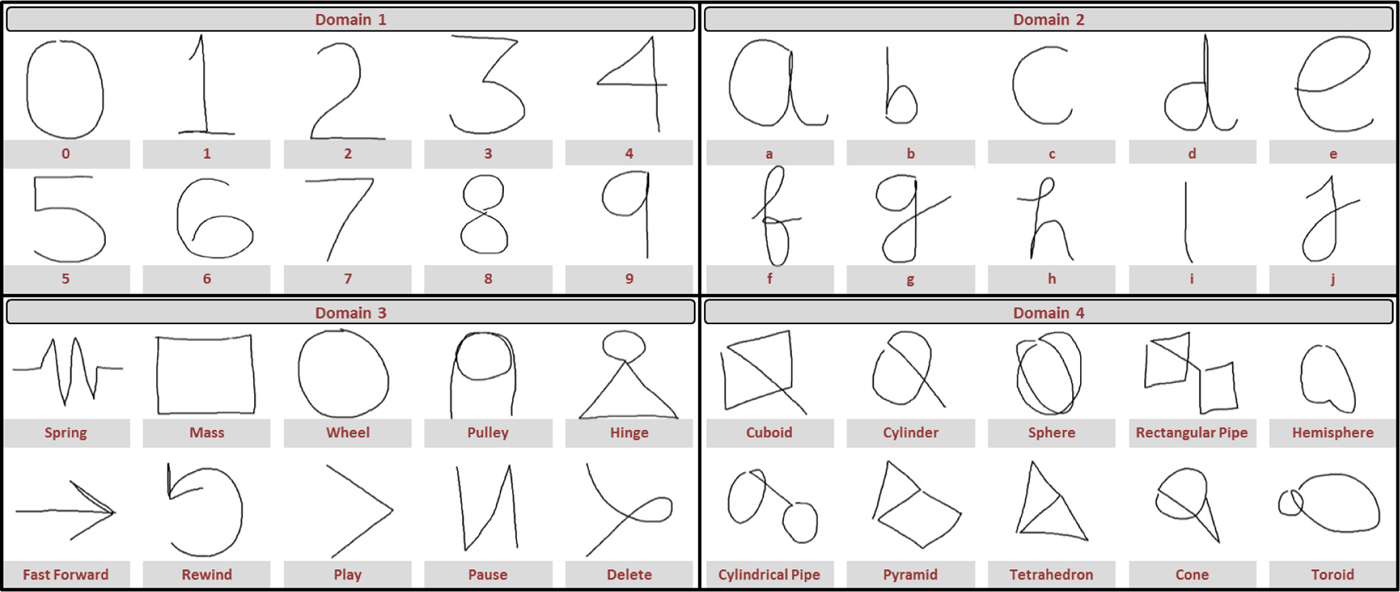
Fig. 9. Symbols used in the experiments - Domain 1: Arabic numerals, Domain 2: English alphabets, Domain 3: Physics simulation symbols, and Domain 4: Procedural CAD symbols (Note that this figure shows 2D projection of 3D sketches).
Table 1. Database for user study

The raw data collected from the participants consists of spatial coordinates (x, y, z) and temporal coordinates (t) for each sketch. A total of 4000 sample sketches were collected. To evaluate the invariance properties of our algorithm, we randomly translated, rotated, and scaled the raw sketch in 3D space. Each spatial coordinate was translated by a random value drawn from a uniform distribution in the range [−1, 1]. Each sketch was also rotated along all three axes by three random angles, respectively, drawn from a uniform distribution in the range [0°, 180°]. The sketches were also scaled with respect to their mean center by a random scaling factor drawn from a uniform distribution in the range [0, 2]. The sketch samples were then preprocessed as described in the section ‘Preprocessing’. The 154-dimensional feature vector was then calculated for each preprocessed sample (see the section ‘Geometric and Statistical Features’). The six-speed and curvature data were normalized using their maximum value among the training dataset. These maximum values were stored for future use, as it is necessary to scale every input feature vector using the same parameters before its classification. Normalization of distance and angle features was not required since their values were comparative and always lies in the range [0, 1] (see the section ‘Distance features’ and ‘Angle features’). We performed PCA on the normalized feature dataset to better understand the correlation between the computed features. Explained variance ratio (EVR) was computed for each principal component by taking the ratio of its variance or eigenvalue to the sum of variances for all principal components, that is  $\hbox{EV}\hbox{R}_j = \lambda _j/\sum \lambda _j$. Figure 10 shows the decay of EVR with ordered principal components. The variation of cumulative EVR is also depicted in Figure 10. Note that about 95% of the variance in the data can be explained by first 24 principal components. Therefore, one could use a smaller feature set for classifying sketch dataset with reasonable accuracy and better performance. However, the computational power of modern computers is sufficient to provide real-time performance with 154-dimensional feature set. Thus, all the computed features were used to learn models for classification purpose.
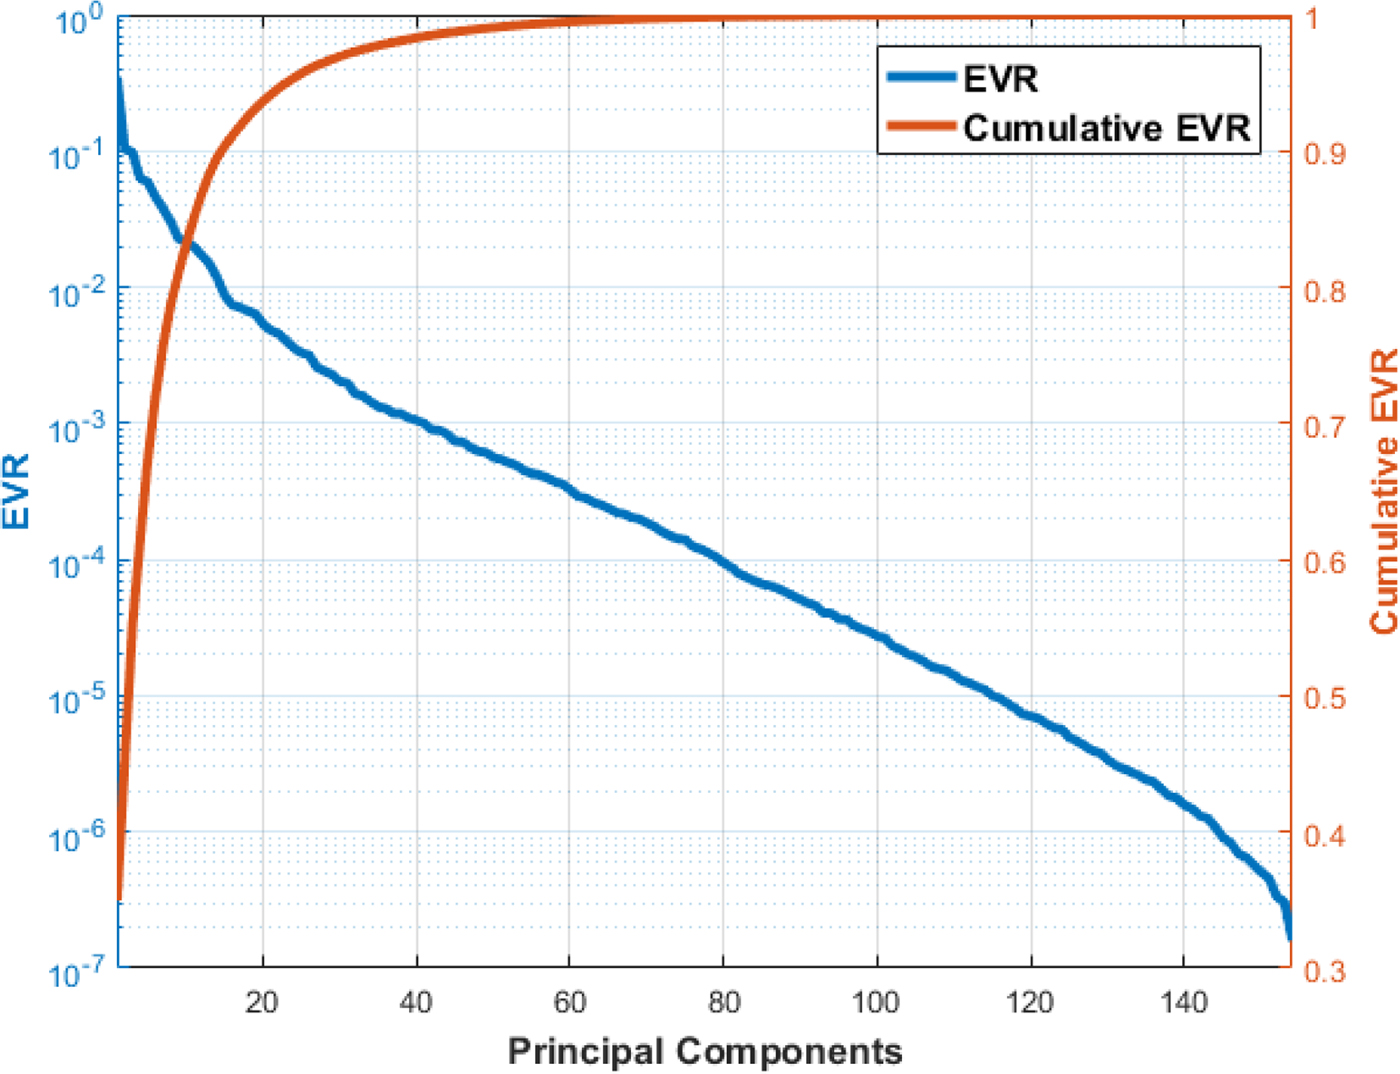
Fig. 10. Variation of explained variance ratio (EVR) and its cumulative with the principal components in the decreasing order of corresponding eigenvalues.
For each domain, the study was carried out independently. Hence, each study involved ten classes of sketches. For each class, the database collected from each user consisted of 100 samples. 30% of the data was randomly chosen as the test data. The remaining 70% data was used for training with fivefolds cross-validation. It was ensured that samples of all ten classes were selected in equal proportion for training, validation, and testing. SVM models with RBF as the kernel function were learned during the training phase. Fivefolds cross-validation was used to tune the parameters C and γ of the model to their optimum values using grid search. For different value pairs of C and γ, the cross-validation accuracy was compared. The value pair that provides the highest accuracy was chosen as the optimum values for C and γ. The optimum values for C for four domains, in order, are 1, 4, 0.25, and 4. And, the optimum γ values are 1 for all four domains. Contour plots of variation in cross-validation accuracy for all four domains is presented in Figure 11.
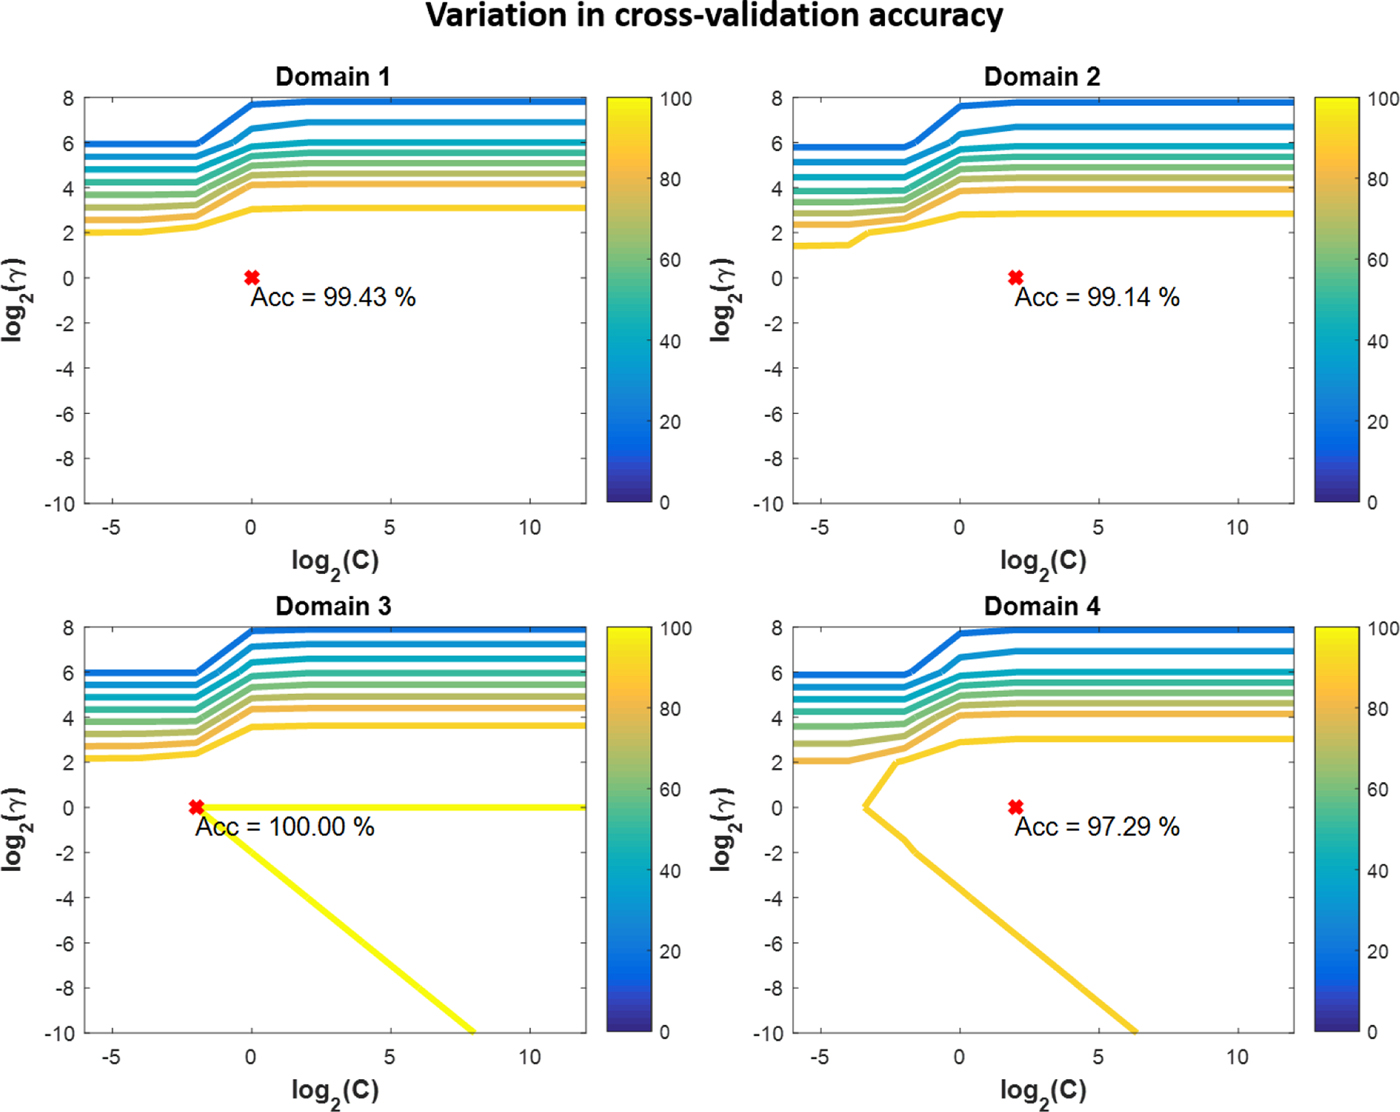
Fig. 11. Variation in cross-validation accuracy for different values of SVM model parameters C and γ.
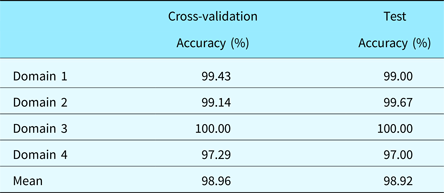
The learned SVM models with the optimum parameter values were then used to classify samples in the test dataset. The test datasets consisted of samples that the model had never seen before. Hence, the obtained accuracy can be used to generalize the performance of the classifier. The accuracies for all four domains are shown in Table 2. The mean test set accuracy of 98.92% was reported. Even with significant intra-class variation in drawing habits of users, our algorithm was able to attain high accuracy. Some randomly chosen samples from the database showing the variations in drawing habits of users are depicted in Figure 12. We are making the database of sketches containing 4000 samples used in our experiment freely available online. The database can be downloaded at the following webpage: https://github.com/madlabub/Sketch-Data.

Fig. 12. Intra-class variations in drawing habits of users.
Table 2. Classification accuracy of SVM model with optimum parameter values
Static hand pose recognition results
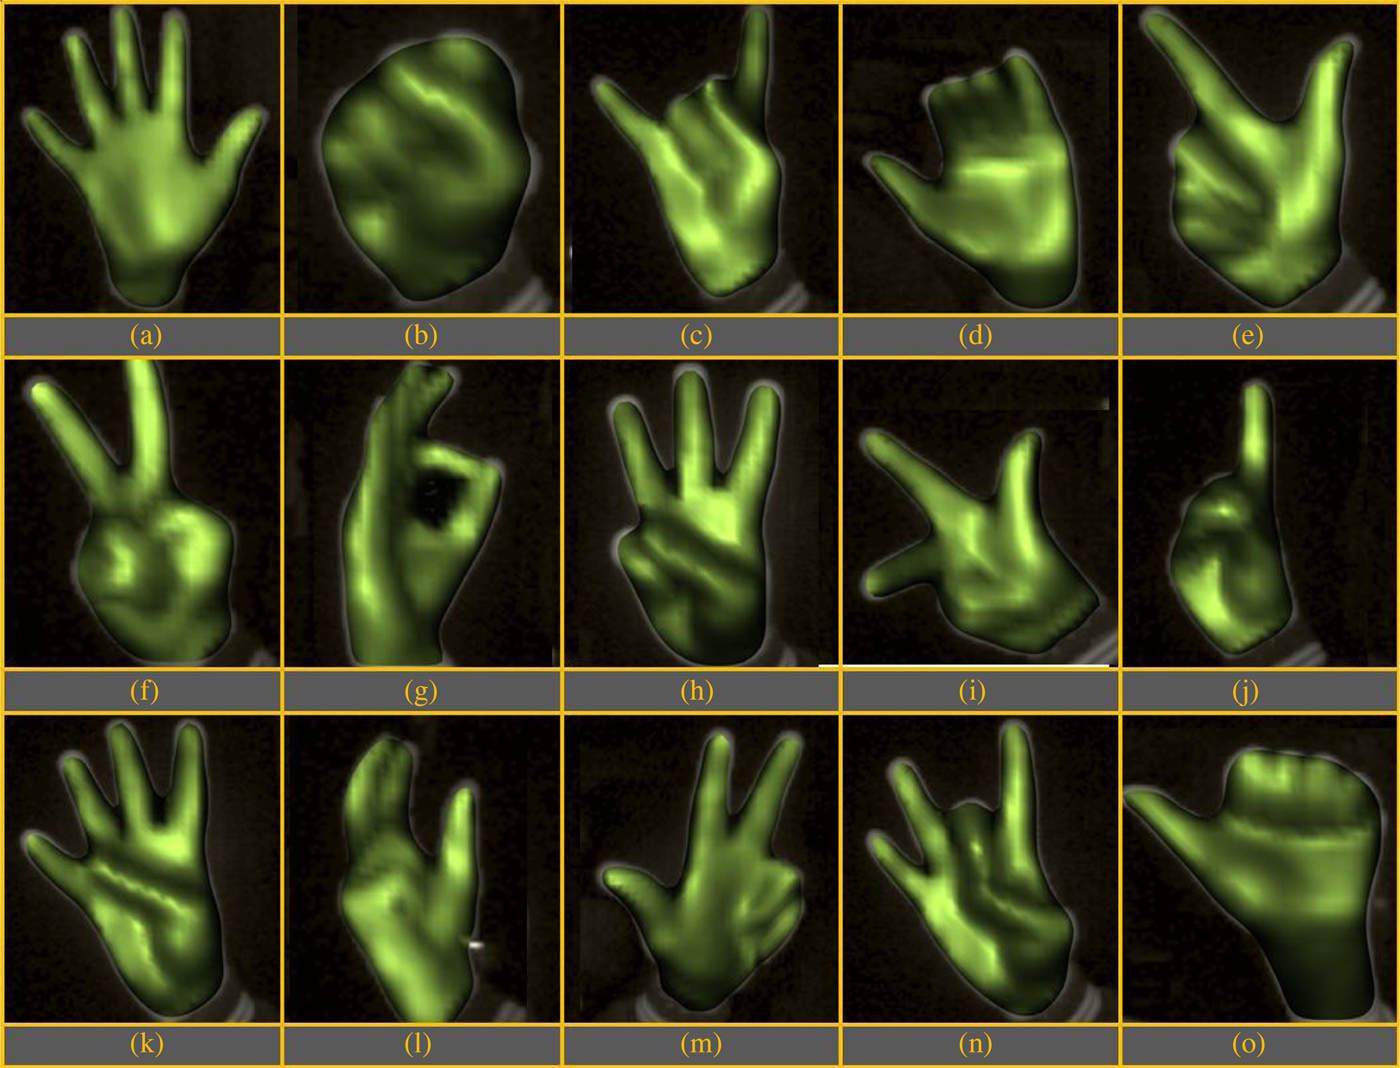
Experiments were conducted to evaluate the performance of static hand pose recognition algorithm. Fifteen different hand poses, shown in Figure 13, were selected for the experiment. In a template-based approach for recognition, although multiple templates would improve the accuracy of the classifier, at the same time, it would also increase the computation time. Obtaining a real-time performance is necessary for the success of an interface. In our experiments on a quad-core Intel® Core™ i7 3.40 GHz CPU with 16 GB RAM, matching two hand pose inputs took approximately 0.015 s on average. We consider 0.5 s as an acceptable upper limit for total recognition time of a hand pose. Hence, a maximum of 30 (~0.5/0.015) hand poses was stored as templates.

Fig. 13. Hand pose database.
The database of 30 templates was created based on preliminary experiments. The confusion matrix from the preliminary analysis was used to judge the number of templates required for each class of hand pose. This analysis resulted in each hand pose having one–four templates in the database, making a total of 30 templates. These 30 templates were used in evaluating the performance of our hand pose recognition system.
To test the system's accuracy, 30 trials were carried out. In each trial, user recreated five of the 15 hand poses in front of the depth-sensing camera within a duration of 3 s. The classification accuracy was computed by combining the results from all trials and finding the percentage of number of hand poses correctly recognized. An accuracy of 95.3% was obtained.
For the interfaces implemented, it was observed that only five hand poses were sufficient to perform all the intended tasks. Active/Inactive sketching mode was controlled using open/close hand pose (Figs. 13a and b). The translation, orientation, and scaling of 3D CAD models were controlled by three other hand poses (Figs. 13c–e). Using these five hand poses, increases not only the classification accuracy but also reduces the computation time. These improved results can be attributed to the fact that the size of the database was reduced to ten templates only.
Figure 14 shows snapshots of the developed interfaces. A video abstract of these interfaces with our gesture-based system in action can be seen at the following link: http://youtu.be/ExpPFZGPdYw. As demonstrated in the video abstract, our system can be interfaced with multitude of applications, including CAD systems. The procedural CAD symbols defined in Domain 4 (Fig. 9) can be used to create 3D shape primitive using hand gestures. Furthermore, static hand gestures (Fig. 13) can be used to manipulate 3D models in CAD environment. An example of a scaled product family of the various 3D model created using hand gestures is shown in Figure 15.
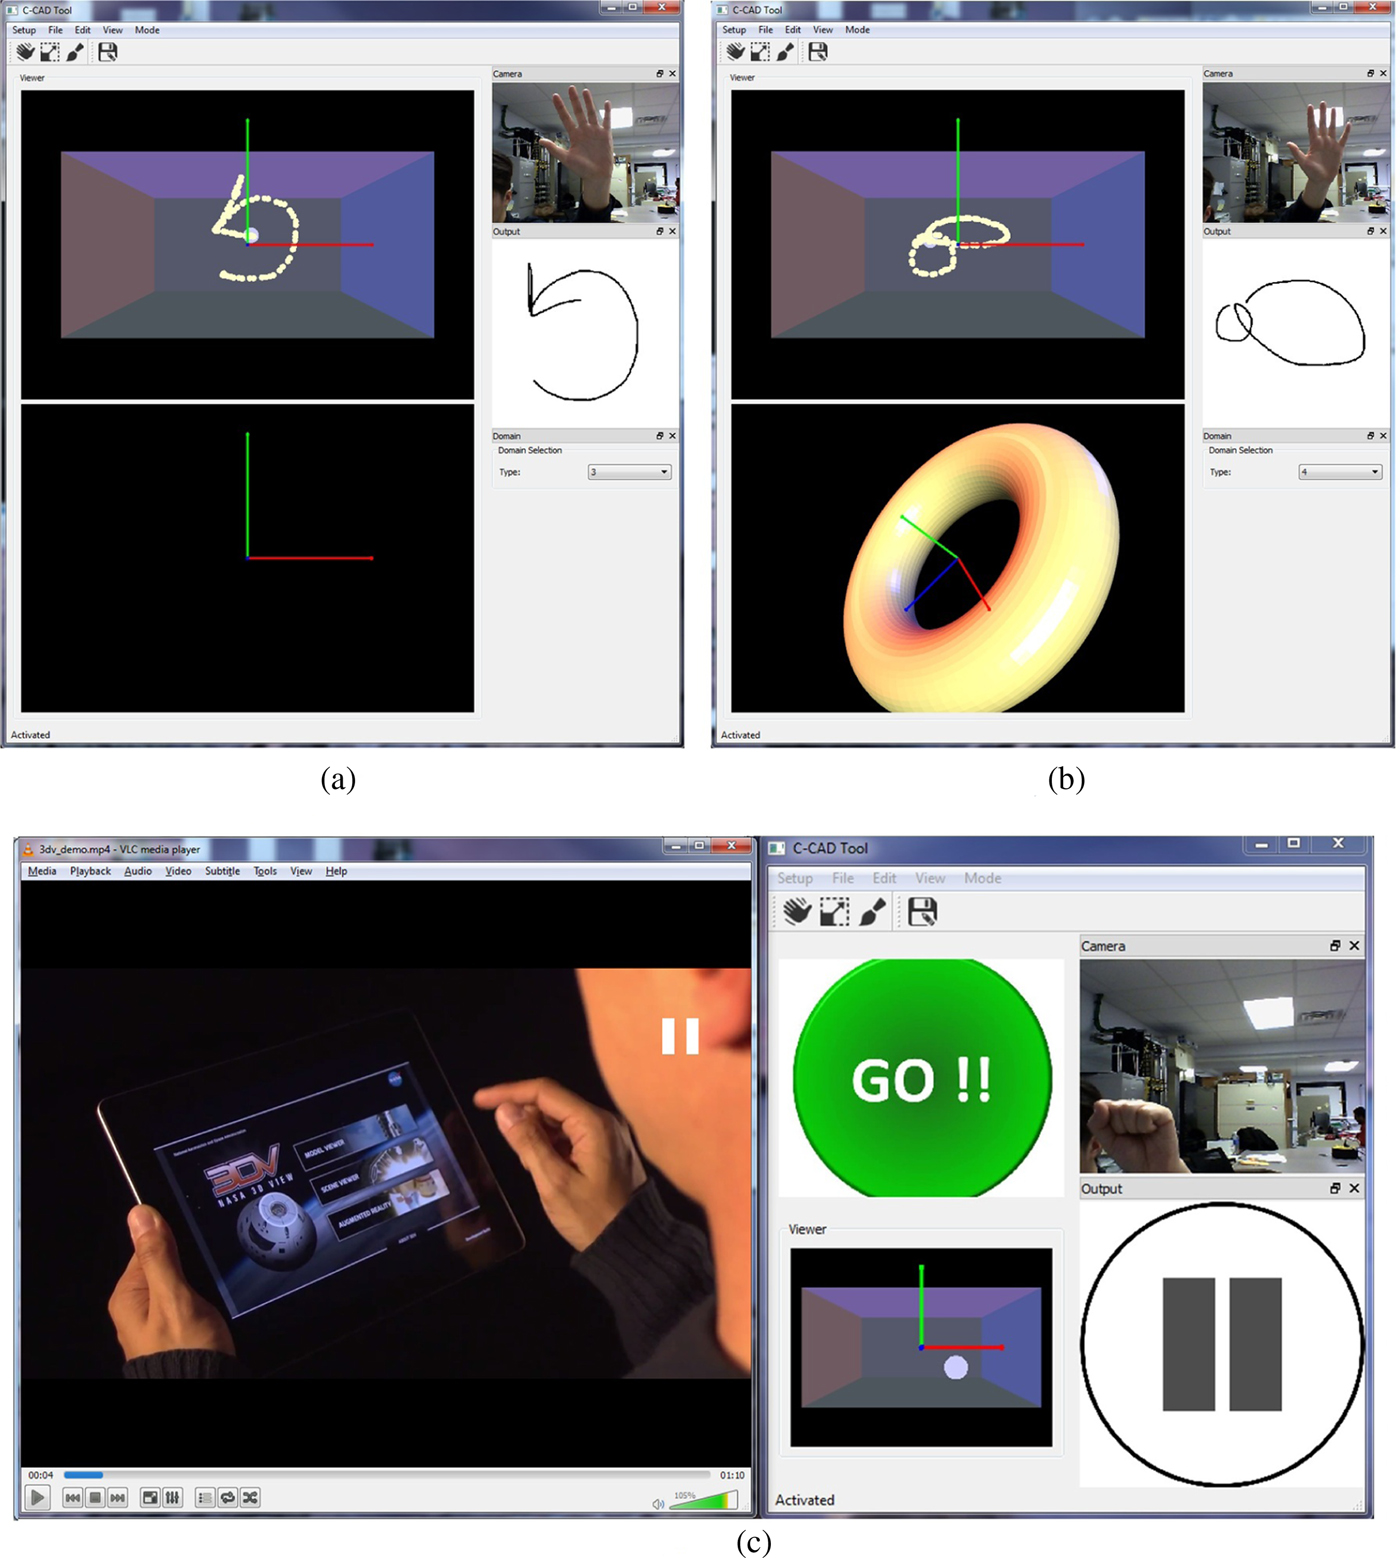
Fig. 14. Interfaces developed to demonstrate the efficacy of our system: (a) Text/symbol recognition interface, (b) 3D CAD modeling and manipulation interface, and (c) video player interface.
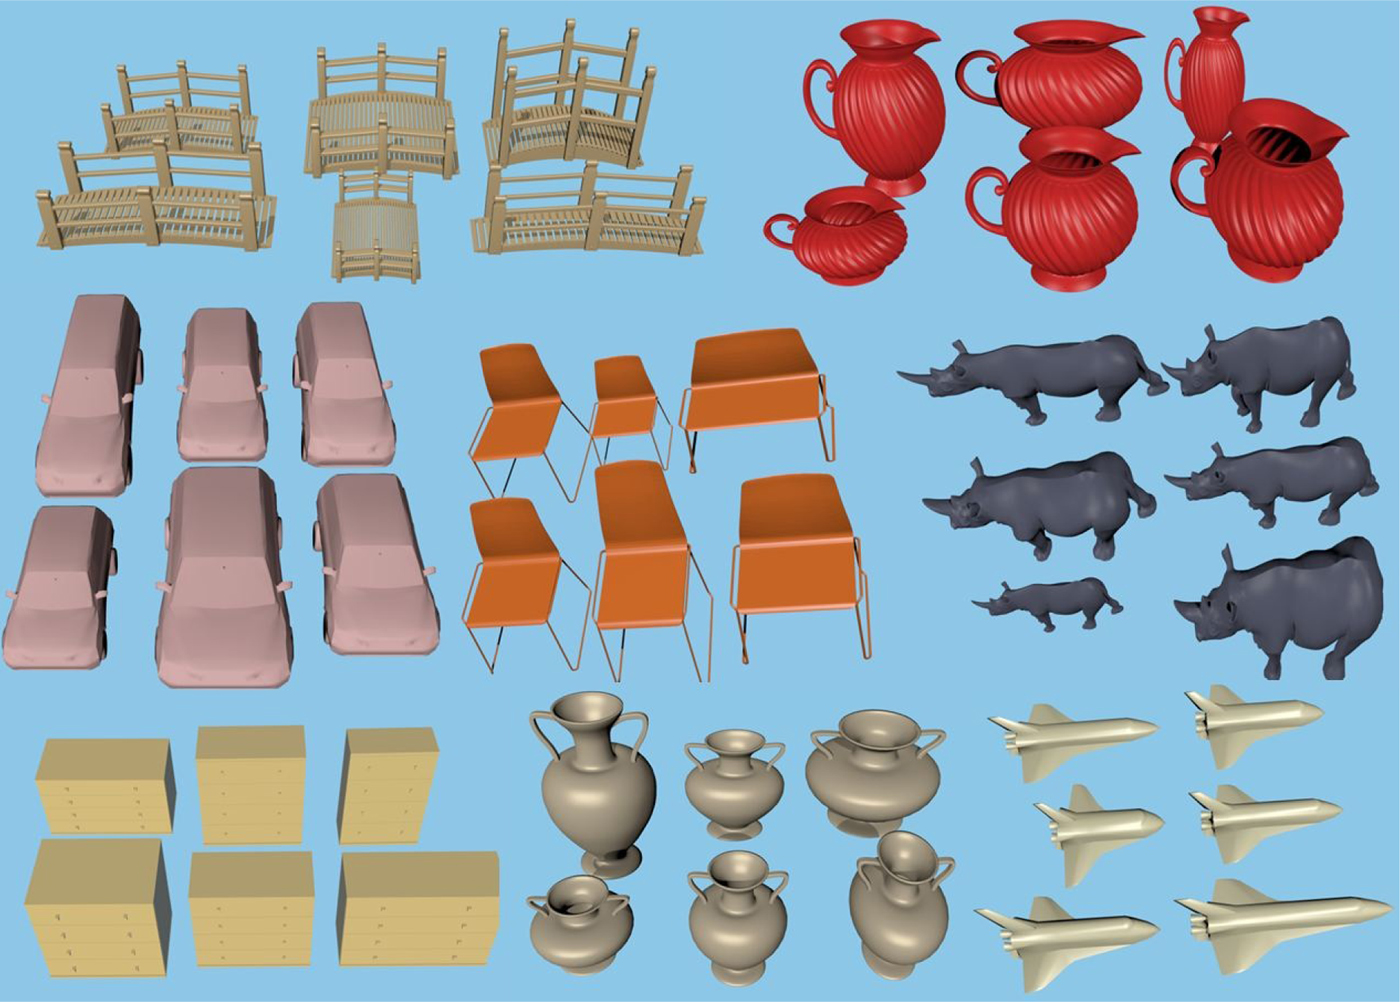
Fig. 15. Scaled product family of various 3D models created using hand gesture-based CAD interface.
Conclusion and future work
The paper presents a highly accurate system for next-generation human–computer interfaces. The system uses the depth-sensing camera to record user's palm and its movement. The trajectory of motion of user's palm in a particular pose is tracked and forms 3D sketch or symbol. 154-dimensional feature vector, extracted from the 3D sketch/symbol, is fed into the learned classifier model to predict its class. The interface then maps it to relevant commands and performs a suitable action. Additionally, static hand poses are also recognized by our system. Template-based hand pose recognizer was implemented, and it used to switch between an active and inactive state of the sketching mode. It was also used in a 3D CAD model manipulation task. The presented system in trainable, that is users could define their own hand poses and sketches according to their preference and train the system.
The evaluation of sketch classification algorithm was done by a user study. Even with significant intra-class variations in sketches drawn by different users, a resultant accuracy of 98.92% was obtained. High accuracy highlights the effectiveness of the features used, which is considered to be the most important factor in the success of any machine learning task. Furthermore, we demonstrated the invariance properties of our algorithm. Our algorithm is invariant to translation, rotation, and scaling. However, it depends on drawing directions of the sketch/symbol. The static hand pose recognizer supplements the system with additional functionalities. Hand pose recognizer can handle a large number of poses, and is accurate and computationally fast for real-time applications. We demonstrated the effectiveness of our system by developing multiple interfaces for different tasks.
There are some exciting possibilities for future work. One apparent future work is to do a comparative study of existing interfaces and the interfaces built using our system in terms of ease of use, intuitiveness, learning time, and user-friendliness. An exciting future work would be to develop features for sketch classification that are direction independent. Creating a multi-stroke sketching system is another promising direction. Another important direction of future work would be to study the performance of sketch classification algorithm with the variation in number of classes it can recognize. There is also scope for improvement in static hand pose recognizer in terms of number of different hand poses it could recognize while maintaining good accuracy and real-time performance. A study could also be done to define a set of most natural and intuitive hand gestures and poses for various commands pertaining to a particular interface.
There are several applications where our gesture-based system could be used to enhance user's experience while interacting with the application's interface. We demonstrated the use of our system with text input interface, 3D CAD modeling and manipulation interface, and video player interface. Further improvement could be done to these interfaces. For example, in the CAD interface, more complex 3D models along with simple primitive could be used. Constructive solid geometry could be implemented using gestures to create more complex geometries. Also, assembling of 3D models could be implemented using gesture commands. Similar to video player interface, this system could be used to perform various operations on Xbox console to play video games. Many other home appliances could be connected to the centralized gesture-based system and controlled using simple gesture operations.
Jinmiao Huang graduated from University at Buffalo in 2015 with a PhD degree in Mechanical Engineering. She is currently a computer vision and machine learning research scientist at ABB Corporate Research Center in Connecticut, USA. Jinmiao's research interests include machine learning, optimization, Bayesian methods for deep learning, and NLP. She conducts research in deep learning and reinforcement learning for future industrial robot applications. She is also working on applying computer vision and machine learning algorithms to enhance the perception and recognition capability for a variety of ABB products.
Prakhar Jaiswal is a doctoral candidate in Mechanical Engineering department at University at Buffalo (SUNY), Buffalo, New York. He obtained his Bachelors in Mechanical Engineering from Indian Institute of Technology at Kanpur in 2011. He has worked as Research Intern at PARC, a Xerox company, and Siemens Corporate Technology in 2015 and 2016, respectively. His research interests include geometric reasoning, machine learning, deep learning, computational geometry, probabilistic graphical models, and computer vision.
Rahul Rai is an Associate Professor in Department of Mechanical and Aerospace Engineering, University at Buffalo (SUNY), Buffalo, New York. He is the founder and director of the Manufacturing and Design Laboratory (MADLab). He holds a PhD in Mechanical Engineering from the University of Texas at Austin. His main research interests include digital manufacturing, engineering design, machine learning, computational geometry, uncertainty quantification in complex system design, additive manufacturing, applied ontology, multimodal intuitive interfaces for conceptual CAD, optimization, metamodeling, and design of experiments.