


Introduction
In many western nations, the population ages rapidly: life expectancy has consistently increased throughout the 20th century and continues to increase further. In 1960, less than 9 per cent of the population was above 65 years old, compared to more than 17 per cent in 2017 (Organisation for Economic Co-operation and Development (OECD), 2020). As a result of population ageing, it becomes increasingly difficult to meet the demands for adequate long-term care (LTC, assistance in personal or household activities due to the care recipient's health-related inability to perform these tasks). This affects LTC from different sources: publicly provided LTC that is either provided directly as a service or as cash for care recipients’ acquisition of LTC is referred to as formal care (OECD, 2020). However, LTC services can also be bought with private income (privately paid care) or provided by family and other social network members (informal care). As expenses for formal care are among the highest in the Netherlands compared to other OECD countries (OECD, 2020), policies that aim at sustaining LTC in the Netherlands have focused on reducing costs by increasing eligibility thresholds and limiting coverage of LTC services (Gianino et al., Reference Gianino, Lenzi, Martorana, Bonaudo, Fantini, Siliquini, Ricciardi and Damiani2017). As a result, alternative sources have become important substitutes for formal care. Particularly, informal care has been recognised as a key element to compensate cutbacks in formal care provision (Zigante, Reference Zigante2018).
The type of care that is accessible, however, differs between members of socio-economic status (SES) groups. While privately paid care remains a privilege of higher SES groups, there is clear evidence that in the Netherlands, both formal and informal care are more often used among lower SES groups (Broese van Groenou et al., Reference van Groenou M, Glaser, Tomassini and Jacobs2006; Kunst et al., Reference Kunst, Meerdink, Vaenik, Polder and Mackenbach2007; Hage et al., Reference Hage, Franken-Pullen, Freriks, Gorree, Teichert, Wiemer and Zielman2015; Jacobs et al., Reference Jacobs, Broese van Groenou, Aartsen and Deeg2018). This is in part because the LTC system of the Netherlands is considered particularly equitable (Duell et al., Reference Duell, Koolman and Portrait2017), which, together with the similarly structured systems in northern European countries, has been recognised as the ‘Nordic model’ (Kraus et al., Reference Kraus, Riedel, Mot, Willeme, Roehrling and Czypionka2010).
Yet, it is unclear whether recent austerity measures in LTC provision have affected SES groups differently, either strengthening or weakening inequalities in the use of care. While it has been argued that accessibility of LTC services becomes increasingly difficult for lower SES groups (Janssen et al., Reference Janssen, Jongen and Schröder-Back2016), researchers also emphasised the relative generousity of the Dutch LTC system towards them (Tenand et al., Reference Tenand, Bakx and van Doorslaer2018). The SES indicator used to investigate differences in care use can also play a role. Particularly, the effects of income and education on LTC use can differ, as the former refers to one's current financial capital while the latter represents a lifetime asset that might also influences one's ability to acquire the desired care.
So far, however, no study has yet investigated changes in the SES gradient in informal, formal and private care use over historical time. The present study therefore aims at providing this knowledge by investigating how the SES gradient in long-term home care use has changed in the Netherlands between 1995, 2005 and 2015, three points in time that capture substantial changes in the LTC system. This not only provides insight into the extent and the development of socio-economic inequalities in LTC, but also provides information on the consequences of changes in LTC policies.
Developments in the Dutch LTC system
The Dutch LTC system caters for everyone with physical, mental or cognitive impairments who require LTC at home or in an institution. Within the past three decades, policy changes in the Netherlands are characterised by the tension between cost-containment and maintaining universal and sufficient care provision (Da Roit, Reference Da Roit2012; Alders and Schut, Reference Alders and Schut2019). The Dutch policy therefore continuously aimed at compensating for budget cuts by improving efficiency and client-centredness of the system, and by promoting and supporting care provision by the recipient's social network. The three time periods included in the present study mark distinct stages in this development.
In 1995, the coverage of formal care services was still relatively extensive and compared to most other countries, institutional care was more common (Mot et al., Reference Mot, Aouragh, de Groot and Mannaerts2010). In order to contain costs, de-institutionalisation policies aimed to stimulate the use of home care in all but the most severe cases (Mot et al., Reference Mot, Aouragh, de Groot and Mannaerts2010). In addition, policies aimed to increase the efficiency of care provision by promoting client responsibility (Maarse and Jeurissen, Reference Maarse and Jeurissen2016). With the personal budget, a cash-for-care scheme which was fully realised by 2001, care recipients could choose to receive their entitled budget for LTC to hire care professionals themselves instead of receiving LTC from a home care organisation. In 2003, informal care was also explicitly promoted as a cost-containment measure: ‘usual care’ was formally considered, which required co-residing family members to take care responsibility (Mot, Reference Mot, Aouragh, de Groot and Mannaerts2010). However, the government has decided against obligating care responsibilities from family members outside the household.
By 2005, institutional care was considerably reduced in favour of care at home, a change which was attributed to the aforementioned policies rather than changes in disability of care recipients (de Meijer et al., Reference de Meijer, Bakx, van Doorslaer and Koopmanschap2015). Due to the continuously rising care demands, however, public care expenditure was also still increasing (Eggink et al., Reference Eggink, Ras and Woittiez2017). Therefore, the LTC system was substantially reformed within the following ten years. In 2007, the Social Support Act (Wet Maatschappelijke Ondersteuning, Wmo) was introduced with the aim of enhancing individual responsibility for LTC. In order to provide care that is more tailor-made towards individual care needs, responsibilities for formal household care were transferred to municipalities, along with significant budget cuts (Plaisier et al., Reference Plaisier, Verbeek-Oudijk and de Klerk2017).
Another substantial reform was introduced in 2015, when the Exceptional Medical Expenses Act (Algemene Wet Bijzondere Ziektekosten, AWBZ), which had been in place since 1968 and covered most LTC services, was entirely abolished and replaced by the Long-term Care Act (Wet langdurige zorg, Wlz). However, the coverage of the Wlz is limited to the most severe cases that require 24-hour care, in contrast to at least three days per week under the AWBZ. Thus, more individuals need to stay at home and receive household care provided by municipalities under the Wmo (Jongen et al., Reference Jongen, Schröder-Bäck and Schols2017). Budgets for household care were also significantly reduced (Alders and Schut, Reference Alders and Schut2019). Limitations of public care provision, however, are accompanied by national and local governments’ efforts to facilitate informal care provision, e.g. by requiring municipalities to offer support for informal care-givers in the form of consultation, and material and financial support, among others (de Boer et al., Reference de Boer, Plaisier and de Klerk2019).
Implications for LTC use over time
As the above section has highlighted, LTC provision has become more limited as a result of budget cuts and stricter eligibility criteria, but policies aimed at compensating for this by improving their efficiency and client-centredness. We expect that this has led to an increase in formal home care use between 1995 and 2005 as a result of de-institutionalisation policies, followed by a decrease between 2005 and 2015 due to the budget cuts in care provision that were introduced with the reforms in 2008 and 2015 (Hypothesis 1a).
Informal care use, in contrast, has been actively promoted by policies to compensate for the limited availability of formal care. Indeed, cross-country studies show that a higher proportion of people use informal care when public resources are limited (Heger and Korfhage, Reference Heger and Korfhage2018). However, there are several barriers that might halt an increase in informal care use. First, while informal care-givers can take over simple tasks (e.g. household tasks), professional support for high care demands (e.g. personal care, nursing) are more difficult to replace, leading to a more complementary role of informal care (Wagner and Brandt, Reference Wagner and Brandt2018). Furthermore, the availability of informal care-givers is hindered by the changes in the demographic composition due to rising life expectancy and falling birthrates (Statistics Netherlands, 2020b), which reduces the relative number of people of working age who can provide informal care (Colombo et al., Reference Colombo, Llena-Nozal, Mercier and Tjadens2011). Lastly, turning to the family for care responsibilities is likely met with resistance from both the care recipient (Grootegoed and Van Dijk, Reference Grootegoed and Van Dijk2012) and the care-giver. In line with these limitations, Balia and Brau (Reference Balia and Brau2014) argued that across Europe, the substitution of informal for formal care is negligible. For the Netherlands, de Boer and Timmermans (Reference de Boer and Timmermans2007) expected informal care supply and demand to remain balanced. We also expect that the conflicting trends compensate each other and that informal care use remains stable between 1995, 2005 and 2015 (Hypothesis 1b).
Another alternative to turning to the family is privately buying professional care services. There is a general trend towards privatisation of care services in Europe (Spasova et al., Reference Spasova, Baeten, Coster, Ghailani, Pena-Casas and Vanhercke2018), although there are substantial cross-country differences in the use of privately paid care (Pommer et al., Reference Pommer, Woittez and Stevens2007). Due to trends towards more wealth at older age (Statistics Netherlands, 2020a), and competitive prices for professional care, we expect that privately paid care is more likely to be used by older adults in 2015 and 2005, compared to 1995 (Hypothesis 1c).
Implications for the SES gradient in LTC care use
The described changes in the LTC system likely not only impact the overall use of LTC, but also have diverging effects on different SES groups. Formal care services in the Netherlands are more likely to be used by lower SES groups (Broese van Groenou et al., Reference van Groenou M, Glaser, Tomassini and Jacobs2006). With increasing scarcity of resources, this focus might be even stronger. Tenand et al. (Reference Tenand, Bakx and van Doorslaer2018) emphasised that in 2012, distribution of formal care resources focused strongly on the poor, even beyond what would be expected based on individual needs. This likely continued after the 2015 reform, although in the public discussion concerns have been voiced that the increasing complexity of the system and the aforementioned policy focus on a recipient's responsibility particularly disadvantage lower SES groups (Jongen et al., Reference Jongen, Schröder-Bäck and Schols2017). Similarly, with the transfer of care responsibilities towards municipalities, individuals have to negotiate their desired care provision instead of following a standardised procedure, which could be more difficult for those with a lower SES (Janssen et al., Reference Janssen, Jongen and Schröder-Back2016). Investigating the impact of the 2007 reform, Da Roit and Thomése (Reference Da Roit and Thomése2016), however, found that scarcity of municipal budgets led to a decrease in formal care use, irrespective of the participant's income. When comparing educational groups, they found that inequalities in formal care use disappeared after the reform. This was attributed to the better consideration of individual care situations by municipalities that compensate higher SES advantages in negotiating and acquiring care resources. Still, it is unclear whether the 2015 reform had similar effects, as it is considered the more disruptive change in the LTC system (Jongen et al., Reference Jongen, Schröder-Bäck and Schols2017). As municipalities have to face more care demands with an even more limited budget, it might also become more difficult to maintain SES equality, but there is no evidence yet to confirm this. Therefore, in line with the conclusions of Da Roit and Thomése (Reference Da Roit and Thomése2016), we expect that individuals with lower SES are more likely to use formal care (Hypothesis 2a) and that this SES gradient has not changed between 1995, 2005 and 2015 (Hypothesis 3a).
When formal care services are less available, those in need of support have to rely on other sources of care. Despite the efforts of local and national governments to mobilise social resources, the high LTC demand is likely not covered by informal care alone (Janssen et al., Reference Janssen, Jongen and Schröder-Back2016). Buying care privately therefore becomes a more attractive alternative, but is only accessible for those with sufficient financial means. Research has indeed suggested that a decline in formal care provision is associated with more privately paid care use in higher SES groups and more informal care use in lower SES groups (Rostgaard and Szebehely, Reference Rostgaard and Szebehely2012). This difference in response of lower and higher SES groups to the policy changes might be exacerbated by the transfer of care responsibilities to municipalities: due to the strong incentive to remain within budget and the individual consideration of each client's situation (Maarse and Jeurissen, Reference Maarse and Jeurissen2016), possible alternatives to formal care might be more thoroughly investigated and their use required, if possible (Plaisier et al., Reference Plaisier, Verbeek-Oudijk and de Klerk2017). As privately paid care is largely inaccessible to them due to financial constraints, individuals with lower income might thus more often be forced to mobilise their informal care network, even in situations where it is undesirable and burdensome for the care-givers. This development has been observed in Sweden, where those with longer education increasingly turn to privately paid care and those with shorter education more often receive care from family members (Rostgaard and Szebehely, Reference Rostgaard and Szebehely2012).
Similarly, we expect that individuals with lower SES more often use informal care resources across all measurement years (Hypothesis 2b) and that due to the scarcity of formal care resources and the inaccessibility of privately paid care, this SES gradient has widened in 2005 and 2015 compared to 1995 (Hypothesis 3b). Likewise, we expect that individuals with higher SES use more privately paid care across all measurement years (Hypothesis 2c) and that the increasing scarcity of formal care resources has led to a further widening of this SES gradient in 2005 and 2015 (Hypothesis 3c).
Individual determinants of LTC use
Potential changes in the SES gradient in LTC might not be explained exclusively by developments in the LTC system. The use of care also depends on individual factors that determine if an individual needs care, is willing to use care and has access to it (Andersen and Newman, Reference Andersen and Newman2005). If such individual factors have changed unequally between SES groups over time, these might also impact the SES gradient in LTC use.
First, whether one uses LTC highly depends on health status. The SES gradient in health impairments is firmly established, although its strength depends on the types of impairment that are investigated (Lampert and Hoebel, Reference Lampert and Hoebel2019). In the Dutch context, a lower SES has been associated with more functional limitations among older people (Hoogendijk et al., Reference Hoogendijk, Heymans, Deeg and Huisman2018). In 2010, lower SES groups lived 14 more years in poor health compared to high SES groups (Busch and van der Lucht, Reference Busch and van der Lucht2012). There is also evidence for increasing SES disparities: Mackenbach et al. (Reference Mackenbach, Valverde, Artnik, Bopp, Brønnum-Hansen, Deboosere, Kalediene, Kovács, Leinsalu, Martikainen, Menvielle, Regidor, Rychtariková, Rodriguez-Sanz, Vineis, White, Wojtyniak, Hu and Nusselder2018) found that in Western Europe from 2002 to 2014, self-assessed health and objectively measured functional limitations were improving disproportionally in higher SES groups, thus increasing the SES gradient over time. Similarly, Hu et al. (Reference Hu, van Lenthe, Borsboom, Looman, Bopp, Burstrom, Dzurova, Ekholm, Klumbiene, Lahelma, Leinsalu, Regidor, Santana, de Gelder and Mackenbach2016) found a trend towards increasing SES inequality in self-assessed health in Europe from 1990 to 2010. While these findings indeed suggest that unequal gains in health impact the SES gradient in LTC use, we expect that these alone do not explain changes in the SES gradient due to the drastic effects of the LTC reforms. Thus, the SES gradient in LTC use persists even when health differences between SES groups are considered (Hypothesis 4a).
Second, as informal care is often provided by spouses (Wong et al., Reference Wong, Elderkamp-de Groot, Polder and van Exel2010), changes in the SES gradient in LTC use might also be the result of SES differences in the availability of a partner. Being married at older age is more common among higher SES groups (Broese van Groenou et al., Reference van Groenou M, Glaser, Tomassini and Jacobs2006). Trends towards more individualisation and fewer late-life partnerships (Reher and Requena, Reference Reher and Requena2018), however, likely affected all SES groups. Thus, we expect that the SES gradient in LTC use persists, even when considering the availability of a partner (Hypothesis 4b).
Third, there is a known substitution effect for the use of different sources of care: when care from one source is used, other sources are likely not used, which is reflected in a strong negative association between the different sources of care (Swinkels et al., Reference Swinkels, Suanet, Deeg and Van Groenou MI2016). The source of care that is most likely used as a substitute, however, differs between SES groups: formal care is more frequently replaced by privately paid care in higher SES groups and by informal care in lower SES groups (Jacobs et al., Reference Jacobs, Broese van Groenou, Aartsen and Deeg2018). It is unclear, however, if the strength of the substitution effects differs between SES groups. Overall, we therefore expect that substitution effects between the three sources of care do not explain changes in the SES gradient in LTC use (Hypothesis 4c).
Method
Participants
Data from the Longitudinal Aging Study Amsterdam (LASA) were used in this study. LASA is an ongoing study of older adults in the Netherlands, since 1992, that investigates physical, cognitive, emotional and social functioning (Hoogendijk et al., Reference Hoogendijk, Deeg, Poppelaars, van der Horst, van Groenou MI, Comijs, Pasman, van Schoor, Suanet, Thomése, van Tilburg, Visser and Huisman2016). Three cohorts of participants aged 55–84 participated in this study: cohort 1 (baseline N = 3,107) started in 1992, cohort 2 (baseline N = 1,002) in 2002 and cohort 3 (baseline N = 1,023) in 2012. For all cohorts, additional measurement waves were conducted every three years. Participants were recruited in three culturally distinct regions in the west, north-east and south of the Netherlands to reflect the national distribution of urbanisation and religiosity. Those who agreed to be interviewed were visited at home by professional interviews who conducted regular interviews and clinical measurements that took about two hours to complete. The sample used for this study includes participants from three years of measurement in 1995, 2005 and 2015 who were living at home independently and were between 75 and 85 years old. With this selection, no participant provides more than one observation, allowing cross-sectional comparisons between years of measurement. If a participant did not respond during the measurement, the responses of the previous measurement were used and if that was not available, the following measurement. Overall, 4.3 per cent of all participants had at least one imputed value. There was no significant difference in age, gender and income between participants with and without imputed values. The total number of observations in this study was 1,810, of which 787 were included in 1995, 550 in 2005 and 473 in 2015. After imputation, 86.2 per cent of all participants had no missing values (N = 1,560).
Measures
Dependent variable
Care use was measured separately for formal, informal and privately paid care. Participants were asked to indicate if they receive personal care (washing, bath or shower, dressing, using the toilet, standing up and sitting) and household care (cleaning, groceries, cooking, moving garbage bins and completing paperwork) and, if so, from which source. They could indicate sources from 11 predefined categories. The options ‘district nurse’, elderly/home/household help and personal home/hospital care for either personal or domestic care indicated the use of formal care and was coded as a binary variable (0 = no formal care, 1 = formal care). Informal care was indicated by a partner, child, friends, neighbours, other household members and other family members outside the household, resulting in a binary variable (0 = no informal care, 1 = informal care). Finally, privately paid care could be indicated (0 = no privately paid care, 1 = privately paid care).
Socio-economic status
SES was measured by two indicators: education and income. These are two common indicators of measuring SES in older adults (Grundy and Holt, Reference Grundy and Holt2001). These were not combined but tested separately to identify potential differential effects. During baseline measurements, participants were asked to state their highest level of education from a list of nine options which were then recoded to three education levels: low (elementary school or no education), medium (lower vocational, intermediate education or intermediate vocational education) and high (secondary school, higher vocational education, college or university). Income was measured using participants’ monthly net household income for each wave. Participants were asked to state their income from a list of 12 options, ranging from €454 to €567 in the lowest category to €2,270 or more in the highest. For each option, the average of the maximum and minimum was used in order to express the variable in euros. For example, for every participant in the group from €454 to €567, an income of €510.50 was registered. For participants that live with a partner, household income was multiplied by 0.7 as not all of the household income is available to the participant when it is shared with a partner. This was done to make income between single- and two-person households comparable (Atkins et al., Reference Atkins, Rainwater and Smeeding1995). As household income is disproportionally provided by male partners, this provides a better estimation of a female participant's financial situation. The source of income was not further specified and savings or ownerships were not included. Inflation correction was applied to make incomes comparable over time, with 2015 as baseline year and adjusted (higher) incomes in 2005 and 1995 (Statistics Netherlands, Reference Statistics Netherlands2021). For testing Hypothesis 2, income was transformed to categorical variables, based on the lowest, middle and top 33 per cent of the sample (0 = less than €1,096, 1 = between €1,097 and €1,640, 2 = more than €1,641).
Physical functioning
Physical functioning was measured by six questions about the difficulty of daily activities based on Katz et al. (Reference Katz, Ford, Moskowitz, Jackson and Jaffe1963): walking up and down stairs, using public transport, cutting toenails, dressing and undressing, sitting down and standing up, and walking outside for five minutes. Responses that indicated the difficulty of each task were measured on a five-point scale: 1 = no, I cannot [perform this task]; 2 = only with help; 3 = yes, with much difficulty; 4 = yes, with some difficulty; 5 = yes, without difficulty. The physical functioning scale was created by adding the item scores to create a scale from 6 (poor) to 30 (good functioning).
Partner status
Partner status was measured by asking whether participants have a relationship with a partner either inside or outside the household, which results in a dichotomous variable (0 = no partner, 1 = partner).
Analyses
Descriptive statistics of independent and dependent variables were calculated for each year of measurement (1995, 2005 and 2015) and SES group (low, medium and high income and education). Differences in average scores were analysed using t-tests and χ2-tests, comparing each SES group to the others. If a participant did not respond during the measurement, the responses of the previous or following measurement were included.
The hypotheses were tested using a hierarchical logistic regression approach with informal, formal and privately paid care use as the outcome variables, and age and gender as control variables. A separate model was tested for each outcome variable and for each SES indicator (education and income), resulting in a total number of six hierarchical models. In the first step of each model, SES and year of measurement were included as independent variable. For both variables, simple contrasts were used, comparing low to medium/high SES groups and the 1995 year of observation to 2005 and 2015. The odds ratio (OR) of the year of observation indicated the difference between the three time periods (Hypothesis 1) and the OR of the SES indicator indicated the difference in care use between SES groups (Hypothesis 2). In the second step, the interaction between the SES indicator and year of observation was included. A significant interaction indicated a change in the SES gradient for the respective type of care (Hypothesis 3). In the last step, the other determinants of care use were included to investigate whether these can explain changes in the SES gradient (Hypothesis 4). The other two types of care were included (e.g. formal and privately paid care for the model with informal care) in addition to partner status and physical functioning. In case the SES gradient in care use has changed after inclusion, post hoc mediation analyses were performed to investigate the individual indirect effect of each determinant.
Results
Descriptive statistics
The descriptive statistics of all variables included in the analysis are summarised in Table 1. A smaller proportion of participants used informal care (χ2 = 8.392, p = 0.023) and a significantly larger proportion used formal care (χ2 = 15.785, p < 0.001) in 2005 compared to 1995. In 2015, a larger proportion of participants used informal care compared to 1995 (χ2 = 21.089, p < 0.001), a lower proportion used formal care compared to 2005 (χ2 = 15.783, p < 0.001), and privately paid care compared to both 2005 (χ2 = 5.144, p < 0.05) and 1995 (χ2 = 11.693, p < 0.001).
Table 1. Descriptive statistics of the variables included in the analysis
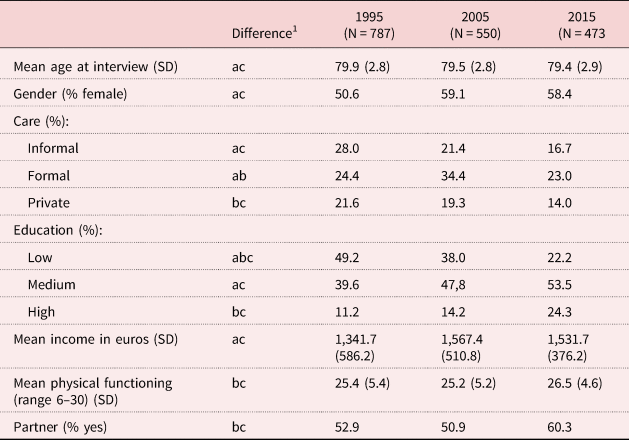
Notes: Values are means and percentages of all variables per year of measurement. SD: standard deviation. 1. a: difference between 1995 and 2005 significant (p < 0.05); b: difference between 2005 and 2015 significant (p < 0.05); c: difference between 1995 and 2015 significant (p < 0.05).
Tables 2 and 3 provide an overview of all variables per SES group. It highlights that in 2015, a lower proportion of participants with higher education used informal and formal care, and a higher proportion used privately paid care compared to those with lower education. In 2005 and 1995, this was also the case for formal and privately paid care, but not for informal care. The same results were found for participants with higher income, except for informal care use, which did not significantly differ between 1995 and 2015. Low SES groups had consistently lower physical functioning and were less likely to have a partner than median and high SES groups.
Table 2. Overview of all variables per socio-economic group: means and percentages of all variables per education group

Note: 1. a: difference between low and medium education significant (p < 0.05); b: difference between medium and high education significant (p < 0.05); c: difference between low and high education significant (p < 0.05).
Table 3. Overview of all variables per socio-economic group: means and percentages of all variables per income group

Note: 1. a: difference between low and medium education significant (p < 0.05); b: difference between medium and high education significant (p < 0.05); c: difference between low and high education significant (p < 0.05).
Changes in the SES gradient of LTC use
The difference in care use between years of observation (Hypothesis 1) was evaluated with the first step of the hierarchical logistic regression models (for an overview, see Table 4). In 2005, individuals were more likely to use formal care (OR = 1.973, p < 0.001) and less likely to use privately paid care (OR = 0.699, p = 0.022) compared to 1995. In 2015, individuals were less likely to use informal care (OR = 0.558, p < 0.001) and privately paid care (OR = 0.337, p < 0.001) compared to 1995. These results are partly in line with expectations (Hypothesis 1), as the changes in formal care use were expected, but not the decrease in privately paid and informal care.
Table 4. The effect of socio-economic status (education, income), year of measurement and individual determinants on long-term care use
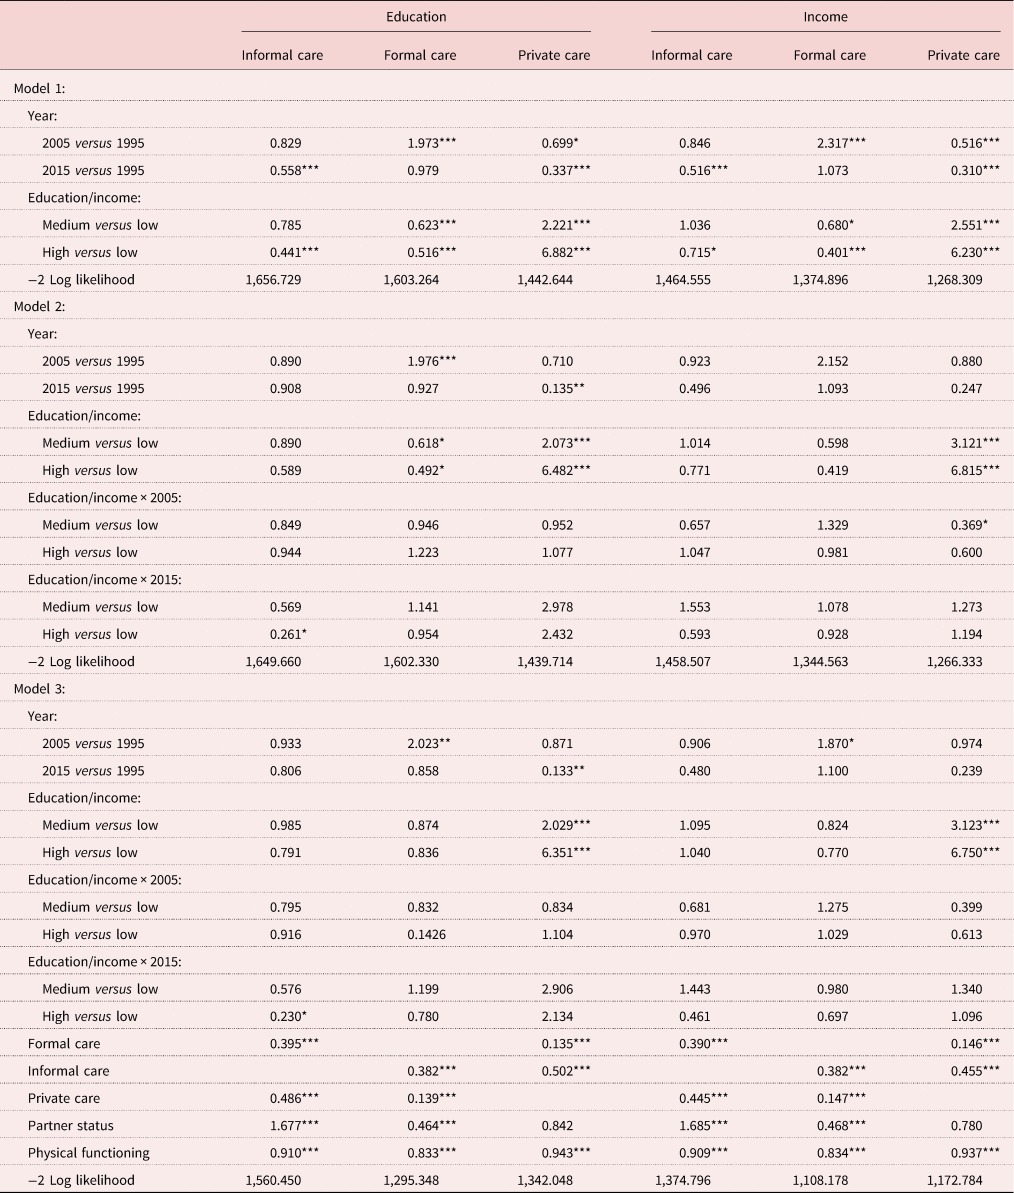
Note: Age and gender were used as control variables in all models (not displayed here).
Significance levels: * p < 0.05, ** p < 0.01, *** p < 0.001.
The first step of the logistic regression model was also used to evaluate differences in care use between the SES groups (Hypothesis 2). Compared to low education, those with high education were less likely to use informal (OR = 0.441, p < 0.001) and formal care (OR = 0.516, p < 0.001) and more likely to use privately paid care (OR = 6.882, p < 0.001). Similarly, those with high income were less likely to use informal (OR = 0.715, p = 0.028) and formal care (OR = 0.401, p < 0.001), but more likely to use privately paid care (OR = 6.230, p < 0.001) compared to those with low income. These results are in line with expectations (Hypothesis 2) that lower SES groups use formal and informal care more, whereas higher SES groups use privately paid care more.
The change in SES differences was indicated by the interaction between year of observation and the SES indicator, which was included in the second step of the model. The results show that the interaction between high education and the 2015 year of observation was significant only for informal care (OR = 0.261, p = 0.019), but not for formal or privately paid care. This indicates that the differences in informal care use between educational groups has widened as it was less likely to be used by highly educated participants. Thus, only Hypothesis 3b could be confirmed and Hypotheses 3a and 3c were rejected.
In the final step of each model, the other sources of LTC, partner status and physical functioning were included. All additional variables had highly significant direct effects on all types of care use, indicating that they are important predictors of formal, informal and privately paid care use: those who receive one source of care are significantly less likely to use another, indicating a strong substitution effect of each source of care. Partner status was positively associated with informal care use (OR = 1.677, p < 0.001) and negatively with formal care use (OR = 0.464, p < 0.001). Those who have a partner thus often receive care from him or her instead of using formal care. Those with better physical functioning were using less LTC, irrespective of the source. The interaction between education and the 2015 year of observation for informal care remained significant after the inclusion of these variables (OR = 0.230, p = 0.012), indicating that the change in the SES gradient of informal care use cannot be explained by the substitution of other sources of LTC or by SES differences in health or partner status (Hypothesis 4).
Discussion
The present study investigated whether LTC use in the Netherlands changed unequally between SES groups through three periods in which the LTC system changed substantially (1995, 2005 and 2015). The findings of this study imply that there is an overall trend towards a decreasing proportion of individuals who use LTC, but that socio-economic inequalities remain largely consistent across the three time periods with only informal care decreasing more steeply among those with higher education.
The decrease in LTC use over time from all sources is surprising: while the decrease in formal care use was in line with expectations, we expected that informal care use would remain stable as individuals could partly compensate the scarcity of public resources by turning to their family members instead. This was an explicit aim of the LTC reforms in the Netherlands, which aimed at mobilising informal care resources to compensate for the more limited coverage of formal care provision. The impact of these measures was likely not only halted, but outweighed by different barriers. First, the declining number of individuals of working age that can provide care (Colombo et al., Reference Colombo, Llena-Nozal, Mercier and Tjadens2011) reduces the pool of potential care-givers that can be mobilised. Second, governmental efforts to educate and support informal care-givers might not be sufficient to replace professional care-givers for recipients with severe health needs (Bonsang, Reference Bonsang2009). Third, the resistance towards informal care provision or receipt (Grootegoed and Van Dijk, Reference Grootegoed and Van Dijk2012) might render policy efforts to promote informal care use ineffective, if they are based on an individual's willingness to provide or receive care. While it has become mandatory in the Netherlands to provide LTC to members of the same household, unlike some other countries, the government has spoken out against enforcing care responsibilities by adult children. Thus, these barriers might not be overcome while still maintaining this liberal approach to informal care provision. However, more drastic measures likely also have negative consequences for the wellbeing of care recipients and their family members.
The decline in informal care use was even steeper among highly educated individuals. This could not be explained by differences in health or partner status (see Table 4, Model 3). We expected that they would turn more towards privately paid care, but this could not be confirmed. Rather, they seem to refrain from using any LTC. This raises the question of whether policy changes have influenced highly educated individuals differently. While the overall results of the present study were comparable between income and educational groups, we did not find the same inequalities in informal care use between income groups. As the LTC system does not formally consider educational level, policy makers are most likely not aware of this difference. The knowledge and skills that educational level represents, however, might also play a vital role in maintaining independence (Enroth et al., Reference Enroth, Veenstra, Aartsen, Aslaug Kjaer, Nilsson and Fors2019). They are more able to use technology to stay independent (Weiss et al., Reference Weiss, Rydland, Øversveen, Jensen, Solhaug and Krokstad2018), e.g. by using the internet or realising housing adjustments.
In contrast, concerns have been raised that individuals with lower SES might be more disadvantaged due to the increasing complexity of LTC regulations and the focus on personal responsibility in care arrangements (Marangos et al., Reference Marangos, Waverijn, de Klerk, Iedema and Groenewegen2018). This concern is called into question by the persistence of the SES gradient in formal care use in the present study. LTC resources have become scarcer, but they are still more concentrated among low SES groups even when their higher need is considered. This finding suggests that the more decentralised care acquisition procedures within municipalities are at least partly considerate of socio-economic disadvantages. Da Roit and Thomése (Reference Da Roit and Thomése2016) argue that municipalities are much closer to the prospective care recipient and have freedom in allocating care resources, which allows them to compensate disadvantages that would go unnoticed in a centralised procedure. Rather than making formal care inaccessible for lower SES groups, these procedures might protect against a sharp decline in formal care use of these disadvantaged groups. Tenand et al. (2018) even argue that the Dutch LTC system ‘overshoots’ its target of ensuring sufficient provision to disadvantaged groups, beyond what would be justifiable based on individual needs.
This is also in line with cross-country comparisons that evaluate the Dutch LTC system as relatively equitable (Duell et al., Reference Duell, Koolman and Portrait2017; Kraus et al., 2017). The results of this study suggest that this remained the case even in the context of increasingly scarce LTC resources. In other countries with a ‘Nordic’ welfare model comparable to the Netherlands, similar developments in the SES gradient in LTC use are observed: in Denmark and Sweden, lower SES groups are expected to rely more on the family for care (Rostgaard and Szebehely, Reference Rostgaard and Szebehely2012). This is in line with the increasing SES differences in informal care found in this study. Still, these countries have fundamentally different approaches compared to the Netherlands: in Sweden, budget cuts focused on home care services for the neediest, whereas Denmark continued widespread coverage, but spread resources thinner by lowering the number of hours that each care recipient receives (Rostgaard and Szebehely, Reference Rostgaard and Szebehely2012). The long-term effects of these strategies cannot be estimated at the present moment, but keeping the balance between universalism and financial sustainability will remain challenging across countries, with each likely having different groups that are disadvantaged by the LTC system.
Strengths and weaknesses
The LASA offers a rich dataset that covers a span of more than 25 years, which makes it suitable to draw conclusions about long-term changes in the use of LTC services. Importantly, it enables a detailed investigation of LTC use that considers the difference between publicly provided and privately bought professional care. This distinction is seldom made in the literature, but, as the present study has shown, is highly relevant for understanding SES differences in LTC use. Despite these advantages, the research design used in this study also comes with some limitations. As the complexity of the model is limited by the available sample size, not all relevant factors could be integrated into the analysis. This includes the differentiation between household and personal care, which may have been differently affected by policy changes. Furthermore, more detailed information about attitudes towards LTC could not be included. Due to the limited sample size, it is possible that some socio-economic inequalities were not identified when their effect was below the significance threshold.
Implications for future research and policy
The present study has provided important insights into socio-economic inequalities in care use that can provide direction for future research. First, better understanding of the consequences of these inequalities is essential. Inequalities in care use do not have to be problematic. For instance, a lower informal care use by highly educated individuals can be justified if they have become more able to remain independent, but not if they have severe care needs that are overlooked. Therefore, it is important to investigate how individuals’ wellbeing and quality of life are affected by changes in LTC provision and whether these differ between SES groups. This can be an important step in identifying groups that are not adequately provided with LTC and suffer severely as a result.
Second, better understanding of the trajectories of care needs and acquisition that different SES groups undergo can be a further step to uncovering weaknesses in care acquisition procedures. For example, individuals with a low SES might have difficulties adapting their care arrangement when they are faced with increasing care needs. These trajectories can be investigated by longitudinal studies, which allow conclusions about the causal mechanisms in care trajectories.
Lastly, in order to evaluate how different policy instruments and strategies impact the socio-economic differences in LTC use, cross-country studies can compare the SES gradient across different LTC systems. As the systematic review by Luppa et al. (Reference Luppa, Luck, Weyerer, König, Brähler and Riedel-Heller2009) has shown, one's SES has widely diverging effects on care use between countries. Comparing multiple countries can not only help clarify these differences, but also enable a better understanding of system characteristics (e.g. eligibility criteria, incentives for informal care) that impact the SES gradient. This will also allow for a better generalisation of results from single-country studies and a better identification of effective strategies that can be implemented in other countries.
These three mentioned research goals are also essential for policy makers who aim at ensuring that everyone in need receives adequate care. Still, the present study also yields important implications for national and regional policy. It has highlighted that measures that were taken to promote informal care use (e.g. offering consultation for care-givers) have not yielded the desired results. Policy makers should therefore anticipate a further decrease in informal care use and possibly a higher unmet need for LTC services. If the current trend towards less informal care use is to be reversed, the effectiveness of existing measures has to be improved or additional measures implemented. For example, since 2015, Dutch municipalities are required to offer support to informal care-givers, but the majority of care-givers do not use any support, presumably because knowledge about the possibilities is still low (de Boer et al., Reference de Boer, Plaisier and de Klerk2019). Due to the novelty of municipal care provision and care-giver support, measures will likely require more time to be effective, so policy makers should invest in monitoring improvement and identifying best practices.
With regards to socio-economic inequality, policy makers should aim at identifying disadvantaged groups that are not just defined by their health status and financial situation, but take their educational background and social resources into account. For instance, individuals who are in a high-income group but lack potential informal care-givers might be overlooked by the LTC system, even though they have unmet care needs. As the allocation of home care is now located at the community level, it is unclear to what degree all municipalities apply this broader perspective on need for care. This could also contribute to varying socio-economic inequality in care use across municipalities or regions, which makes it an important topic for further research.
Author contributions
JA: literature review, writing of the theoretical framework and discussion, data preparation and analyses; MBvG and BS: design of the study, feedback for revision and changes to text, advice for methodological approach and contribution of ideas.
Financial support
This work was supported by an Open Research Area grant from the Netherlands Organisation for Scientific Research (grant number ORA 464.18.106).
Conflict of interest
The authors declare no conflicts of interest.
Ethical standards
The LASA Steering Group has reviewed and approved the request for data to ensure that proposals do not violate privacy regulations and are in keeping with informed consent that is provided by all LASA participants.


 Open access