


Nomenclature
- ACF
Activated Carbon Filters
- CAQ
Cabin Air Quality
- CFD
Computational Fluid Dynamics
- ECS
Environmental Control System
- HEPA
High-Efficiency Particulate Air
- VOC
Volatile Organic Compounds
- RT
Residence Time
1.0 Introduction
Aviation medicine combines aspects of preventive and environmental medicine to improve the physiology and psychology of humans in flight. Apart from the flight conditions, that may impact the passengers’ flight comfort, i.e., weather, turbulence, etc., odour sense and smell dissipation, play a significant role, too, for instance during meal preparation. On the other hand, unwanted fumes may be introduced through the aircraft’s environmental control system, like the bleed air system, thus contributing to the cabin’s air contamination. In that direction monitoring cabin air quality (CAQ) is essential to comply with health and safety standards and ensure the in-flight comfort of passengers and crew members. Towards this direction VOCs are investigated, which should be monitored and controlled efficiently, to maintain the CAQ [Reference Yin, He, Zhao, Pei, Yang, Sun, Cui, Lin, Wei and Chen1].
Odour sensors are neither simple nor inexpensive equipment. Despite that the concept of the machine olfactory system goes back to 1961, it remains very complex, mainly focuses on gas detection, and consists of various compartments, such as the sampler, the computing system, the media –where the data is stored–and the representer that can reproduce the stored odours [Reference Wen, Luo, He and Mei2]. On the contrary, there is limited research trying to understand the mechanisms that the human olfactory system detects and discriminates odours [Reference Firestein3], and scientists can’t yet clearly reach a consensus on whether there is a global methodology that can be applied to that matter.
Initial studies were limited to a small number of flights [Reference Fox4]; however, in recent years, efforts have been put to broaden the flight spectrum, include more flights and create complete aircraft cabin models to assess CAQ [Reference Spengler, Vallarino, McNeely and Estephan5]. In this direction, Gao et al. [Reference Gao, Xie and Yang6], and Wang et al. [Reference Wang, Yang, Guan, Gao and Li7], led independent studies to model VOCs in detail, whereas Schuchardt conducted measurements in 194 flights, focusing on the relation between VOCs and odour experiences [Reference Schuchardt, Koch and Rosenberger8]. The subject was broadened by Pei et al. [Reference Pei, Yin, Liu and Dai9], and Yin et al. [Reference Yin, He, Zhao, Pei, Yang, Sun, Cui, Lin, Wei and Chen1, Reference Yin, He, Pei, Yang, Sun, Cui, Lin, Wei and Chen10], who performed comparative studies to identify common VOCs in aircraft cabins and household apartments and created databases of most commonly measured VOCs in both locations, with tetrachloroethylene, styrene, and naphthalene being among the compounds with a detection rate of 70% or greater.
Civil aviation air-conditioning system design has been under constant development for more than half a century [Reference Widgery11] with engineers focusing on parameters like air pressure, temperature, relative humidity, etc. Through the years, these systems have become more sophisticated following the evolution of the propulsion units, starting from air conditioning units designed for piston-prop and turbo-prop aircraft [Reference Still12], to contemporary systems that are based on various cycles and utilise air recirculation [Reference Merzvinskas, Bringhenti, Tomita and De Andrade13]. A typical air-conditioning unit in civil aviation uses recirculated air, 50% of which is bleed air from the gas turbines that is cooled in the environmental control system (ECS) prior to entering the cabin, and the rest is recycled and filtered through the aircraft filtering unit [Reference Hunt, Reid, Space and Tilton14]. Moreover, according to the inlet and outlet positioning inside the cabin, the ventilation system can be divided into three variants, namely the under-floor displacement ventilation, the mixing ventilation and the personalised ventilation [Reference Farag and Khalil15]. Under-floor displacement ventilation system works by cooling the air that enters the cabin through floor vents, which then creates a stream of cold air that interacts with body heat and exits through the outlet vents at the ceiling. This ventilation system is preferred by aircraft manufacturers as it maintains CAQ with lower air inlet velocity [Reference Maier, Marggraf-Micheel, Dehne and Bosbach16]. On the other hand, in mixing ventilation, high-velocity inlets located on the cabin ceiling mix the inlet air with the contaminated air before it reaches the passengers. The mixed air then exits through the outlet vents located near the cabin floor. However, this system spreads the contaminants from one passenger to another as the air mixing occurs closer to the passengers’ heads. Lastly, personalised ventilation provides each passenger with decontaminated air directly through individual jets located above their head, which creates a curtain of fresh air around each passenger. However, this system’s high jet velocity can compromise the passenger’s thermal comfort after some exposure.
An aircraft ECS is used to regulate cabin pressure, recirculate airflow through ventilation and contribute to dissipating any contaminants emerging from the engine’s bleed air. Most aircraft make use of the latter, even though other methods can exist, including more electric systems to operate the ECS. In the case of bleed air, as this is directly linked to the engine’s main flows, it may contribute to the contamination of the cabin air with harmful chemicals. However, not all contaminants are VOCs, as others may exist (i.e., particulate matter (PM)) and detailed research is required. According to Cao et al. [Reference Cao, Zevitas, Spengler, Coull, McNeely, Jones, Loo, MacNaughton and Allen17], for PM, contributions from the bleed air and cabin interior were both important, while most of the VOCs were generated from emissions inside the cabin (food ingredients, cosmetic products, etc.). It is evident that this condition requires further research attention. It is underlined also by EASA with comments that VOCs should be included in the discussion of emission sources in aircraft [18]. The operation of ECS on aircraft is regulated by the Federal Aviation Administration (FAA) certification requirements [19, 20], which dictates the standards for cabin air quality and ventilation, temperature and humidity control and odour control. Specifically, FAA regulations state that aircraft cabin air must be free from harmful or hazardous concentrations of gases, vapours, or particulate matter, and must provide a minimum of 2.5 cubic feet per minute of fresh air per person. Additionally, the American Society of Heating, Refrigerating, and Air Conditioning Engineers (ASHRAE) also provides guidelines for acceptable operating conditions that preserve high standards of passenger comfort [21, 22]. For example, the air inlet velocity should be between 0.1 and 0.4 m/s to ensure high levels of passenger comfort. Additionally, SAE Aerospace Recommended Practice (ARP) 4418 and 217D [23, 24] outline the minimum requirements for cabin air quality, ventilation, temperature and humidity control, and odour control systems in aircraft, including the need for effective air filtration, proper ventilation rates and the use of odour control measures to ensure passenger comfort and safety. In order to properly filter the recycled air that passes through the ECS, high-efficiency particulate air (HEPA) filters together with activated carbon filters (ACF) are used to remove airborne pathogens and VOCs. The HEPA filters remove 99.97 % of particles with diameters up to 0.3 $ \mu \textrm{m}$
, including particles exhaled from the human respiratory system, whereas the ACF filters utilise activated carbon–a highly porous material–to adsorb VOCs [Reference Sidheswaran, Destaillats, Sullivan, Cohn and Fisk25, Reference Carroll and Kirschman26].
$ \mu \textrm{m}$
, including particles exhaled from the human respiratory system, whereas the ACF filters utilise activated carbon–a highly porous material–to adsorb VOCs [Reference Sidheswaran, Destaillats, Sullivan, Cohn and Fisk25, Reference Carroll and Kirschman26].
In short, air quality evaluation and monitoring inside the aircraft cabin is a pre-requisite, to provide a comfortable and healthy in-flight experience, both for passengers and aviation professionals. In the work of Zhang et al. [Reference Zhang, Chen and Lin27], a computational model is set, considering a slice of a large Boeing 767-300 cabin, aiming to optimise the location and determine the minimum number of odour sensors required to monitor the CAQ. However, the cabin size affects the flow field and since small aircraft, such as the commuter class, are gaining popularity over the past years for being candidates to hybridise or electrify [Reference Gkoutzamanis, Kavvalos, Srinivas, Mavroudi, Korbetis, Kyprianidis and Kalfas28–Reference Nasoulis, Protopapadakis, Ntouvelos, Gkoutzamanis and Kalfas30], it would be interesting to examine the odour dissipation in such confined spaces. Therefore, the scope of this work is to simulate the air-conditioning flow in a small aircraft cabin and to monitor the effect of variation of cooling air mass flow and VOC concentrations on the overall VOC residence time inside the cabin, by monitoring areas of the computational grid close to the manikins’ noses. Then, the computational data is used to train four different machine learning classifiers and compare their performance, with the aim to create a digital nose model. The digital nose model will be able to predict the fractions of various in-cabin compounds, like VOCs, and could aid in the definition of limits beyond which, the concentration of each compound becomes effective for the passengers. Moreover, a direct comparison of two air-conditioning systems; one with and one without a filtering system is performed, to determine the impact of the mass fraction of VOCs on the overall RT inside the cabin. Finally, the feasibility of manufacturing a full-scale test rig for odour testing is discussed.
2.0 Methodology
The aircraft considered in this study is a hybrid-electric commuter aircraft with a maximum payload capacity of 19 passengers, which is sized using in-house tools tailored for novel propulsive architectures [Reference Nasoulis, Gkoutzamanis and Kalfas29]. The cabin selected for this configuration is a single-aisle cabin, with single seats per side, the characteristics of which are shown in Table 1.
Table 1. Test case cabin dimensions

The first part of this work aims to understand the evolution of the flow inside the cabin and capture the mass transfer phenomena of VOCs caused by the operation of the aircraft air-conditioning system. Therefore, a computational fluid dynamics (CFD) computational domain is prepared, that will be used in a transient HVAC analysis inside the aircraft cabin. To reduce the size of the computational domain, a cabin slice of 2m is selected, including a single row of seats and two manikins, one on each side. The topology of the cabin slice is shown in Fig. 1. Each manikin is positioned to a seat and a standard sitting position is assumed. The outlets of the air-conditioning system are attached to the fuselage side wall, next to the seats, and close to each passenger’s feet, whereas the inlets are above the cabin storage compartments. The size of the inlet and outlet grills are selected to be similar to aircraft of the same class and the final dimensions are shown in Table 2. Finally, several nodes of the computational domain are monitored, which are located close to the manikins’ noses, to measure the mass of the in-cabin VOCs.
Table 2. Test case cabin dimensions


Figure 1. Manikin position and cabin air-conditioning system.
The domain is discretised by a polyhedral mesh, with polyhedral layers on all walls. Different grid sizes are tested to ensure that the case is grid-independent, ranging from 1.4 m elements to 6.7 million elements, and for a grid size of approximately 4.2 million elements, the solution is considered sufficiently accurate at an acceptable computational cost. To compare the different grids, an auxiliary cut plane is created, that is normal to the z-axis, at the height of the monitored computational nodes. As seen in Table 3, the average plane velocity difference between the 4.2 and 6.7 million elements grid size is approximately 1%, therefore the solution is considered grid independent. Numerous other parameters tested showed the same trends, thus the 4.2 million-element grid size is selected for the evaluation. All cases were solved using the high-performance computing unit of the university, using 60 CPU cores and 384 GB of RAM memory, with the execution time ranging from 4 to 12 h until convergence.
The computational domain is solved in Ansys Fluent commercial solver. The Reynolds-Averaged Navier-Stokes (RANS) equations are solved with the k-omega SST turbulence model. Additionally, the energy equation is enabled, as well as the species solver for the mass transfer of VOCs. The inlets of the model are specified as mass flow inlets, whereas the outlets are set as outflows, in order to calculate the species concentrations on the outlet plane. The inlet mass flow is calculated to be 0.01 kg/sec according to ASHRAE recommendation [21] and inlet vent dimensions for an inlet velocity of 0.25 m/s, while the inlet temperature from the air-conditioning system is 291 K. As mentioned in the introduction, the VOCs that are used in this model are tetrachloroethylene ( ${C_2}C{l_4}$
), naphthalene (
${C_2}C{l_4}$
), naphthalene ( ${C_{10}}{H_8}$
), and styrene (
${C_{10}}{H_8}$
), and styrene ( ${C_8}{H_8}$
), since they are among the highly detected compounds in a cabin. Additionally, VOCs from essential oils are also considered, like Limonene (
${C_8}{H_8}$
), since they are among the highly detected compounds in a cabin. Additionally, VOCs from essential oils are also considered, like Limonene ( ${C_{10}}{H_{16}}$
), which is the major component in the oil of citrus peels. Moreover, Linalool (
${C_{10}}{H_{16}}$
), which is the major component in the oil of citrus peels. Moreover, Linalool ( ${C_{10}}{H_{18}}O$
), and Citral (
${C_{10}}{H_{18}}O$
), and Citral ( ${C_{10}}{H_{16}}O$
), are included, commonly found in flowers and spice plants and oils of several plants like lemon myrtle respectively, to explore the impact of food-related odours in the passenger’s eating experience. The approximation of the VOCs mass fractions along with air mass fractions are included in Table 4. Finally, the initial pressure of the cabin is set to 75 kPa.
${C_{10}}{H_{16}}O$
), are included, commonly found in flowers and spice plants and oils of several plants like lemon myrtle respectively, to explore the impact of food-related odours in the passenger’s eating experience. The approximation of the VOCs mass fractions along with air mass fractions are included in Table 4. Finally, the initial pressure of the cabin is set to 75 kPa.
Table 3. Average plane velocity versus grid size

Table 4. Volatile organic compounds and cabin air mass fractions

A transient analysis with a variable time step, ranging from ${10^{ - 4}}$
to
${10^{ - 4}}$
to ${10^{ - 2}}$
s, is solved, while the actual flow simulation time is 800 s. Subsequently, the masses of the VOCs and air compounds measured by the model’s monitored computational nodes are used to create a dataset that will train a digital nose model, which will be used to interpret the measurements of odour sensors in a physical experimental facility. Mass measurements for each VOC are exported every 10 s of actual flow time and stored in the dataset, along with the respective mass fractions and partial pressures, adding up to 22 columns of data per writing interval. Additionally, an odour-sensing threshold is set to be of the order of micrograms, meaning that if the mass of any VOC is less than 1
${10^{ - 2}}$
s, is solved, while the actual flow simulation time is 800 s. Subsequently, the masses of the VOCs and air compounds measured by the model’s monitored computational nodes are used to create a dataset that will train a digital nose model, which will be used to interpret the measurements of odour sensors in a physical experimental facility. Mass measurements for each VOC are exported every 10 s of actual flow time and stored in the dataset, along with the respective mass fractions and partial pressures, adding up to 22 columns of data per writing interval. Additionally, an odour-sensing threshold is set to be of the order of micrograms, meaning that if the mass of any VOC is less than 1 $\mu \textrm{g}$
, it is assumed undetected, an assumption that is based on applications of electronic olfaction systems [Reference Campagnoli and Dell’Orto31]. Finally, a feature selection Boruta-based algorithm [Reference Kursa and Rudnicki32], is used in the dataset to determine which dataset attributes i.e., masses, mass fractions and partial pressures, are more significant than others. Finally, the dataset is used to train the machine learning-assisted digital nose model, where four different classifiers are tested, namely the Random Forest, Support Vector Machine, Logistic Regression, and Naive Bayes, and their performance is compared. The Random Forest method uses feature randomness when building individual trees to create an uncorrelated forest whose prediction by committee is more accurate than that of any individual tree. Moreover, the trees are trained on different sets of data and use different features to make decisions. For this study, various numbers of trees were tested and an overall number of 200 trees was selected. Logistic regression is a statistical method for analysing a dataset where there are independent variables that define an outcome. This method is selected as it is easy to implement, interpret and very efficient to train, whereas it performs well when the dataset is linearly separable. Finally, the Naive Bayes method is used, which is based on the Bayes Theorem for probabilities, as it is easy to implement and fast to predict.
$\mu \textrm{g}$
, it is assumed undetected, an assumption that is based on applications of electronic olfaction systems [Reference Campagnoli and Dell’Orto31]. Finally, a feature selection Boruta-based algorithm [Reference Kursa and Rudnicki32], is used in the dataset to determine which dataset attributes i.e., masses, mass fractions and partial pressures, are more significant than others. Finally, the dataset is used to train the machine learning-assisted digital nose model, where four different classifiers are tested, namely the Random Forest, Support Vector Machine, Logistic Regression, and Naive Bayes, and their performance is compared. The Random Forest method uses feature randomness when building individual trees to create an uncorrelated forest whose prediction by committee is more accurate than that of any individual tree. Moreover, the trees are trained on different sets of data and use different features to make decisions. For this study, various numbers of trees were tested and an overall number of 200 trees was selected. Logistic regression is a statistical method for analysing a dataset where there are independent variables that define an outcome. This method is selected as it is easy to implement, interpret and very efficient to train, whereas it performs well when the dataset is linearly separable. Finally, the Naive Bayes method is used, which is based on the Bayes Theorem for probabilities, as it is easy to implement and fast to predict.
Lastly, the cabin filtering system is modeled through proper boundary conditions. It is assumed that 50% of the incoming air is from outside and contains the VOCs, whereas the other 50% passes through the cabin filtering unit (HEPA/ACF). The filtration of the VOCs leads to an overall reduction of their in-cabin mass by 50%, after a full filtration cycle. Typical air exchange rates for aircraft cabins were considered [20] and for this analysis, 20 cycles per hour were selected, or one every 180 s. Moreover, the RT of each VOC is monitored until the end of the filtration, with a 10-second reporting interval.
3.0 Results and discussion
The CFD evaluation of the in-cabin air flow shows that flow irregularities begin to form with the development of the flow field, as shown in Fig. 2. By examining the left part of Fig. 2, approximately 40s are required for the flow to reach the cabin floor and begin the circulation, therefore the flow asymmetries that are observed are minor. However, as the flow progresses, the asymmetric behaviour becomes more intense, especially for the passenger in the right aisle. The velocity jet that is formed slightly tilts towards the right cabin side, thus affecting the velocity field near the right manikin’s head, where the velocity magnitude is moderately greater than the left side, as seen in the right part of Fig. 2. This variation of the velocity field and magnitude, affects the odour dissipation too, indicating that the monitored nodes located close to the manikin’s nose on the right will have different measurements than the ones on the left.

Figure 2. Cabin flow visualisation for actual flow time 40s (left) and 740s (right).
Prior to exploring the results, it is essential to perform a sensitivity analysis of the model’s input parameters to determine possible correlations between them. Therefore, each VOC mass fraction is altered by $ \pm 10{\rm{\% }}$
, and the model is re-evaluated, this time in steady-state, to capture any VOC concentration variations in the monitored nodes’ position. The same
$ \pm 10{\rm{\% }}$
, and the model is re-evaluated, this time in steady-state, to capture any VOC concentration variations in the monitored nodes’ position. The same $ \pm 10{\rm{\% }}$
variation is applied in the mass flow inlet, to quantify the impact of air-conditioning inlet air mass flow on the in-cabin mass transfer phenomena.
$ \pm 10{\rm{\% }}$
variation is applied in the mass flow inlet, to quantify the impact of air-conditioning inlet air mass flow on the in-cabin mass transfer phenomena.
A selection of the sensitivity analysis results is presented in Table 5, namely the variation analysis for the air mass flow and mass fraction for one of the six VOCs that are present in the model, at the inlet. Regarding the inlet air mass flow variation, it is observed that the concentration of VOCs that is measured in the monitored nodes remains unaffected, compared to the reference case of 0.01kg/s of inlet air mass flow. The measured difference between the reference value and the $ \pm 10{\rm{\% }}$
mass flow variation cases is less than 0.1 % for all six VOCs, meaning that the measurements are independent of the air-conditioning system fan speed setting. Moreover, the measurements for Limonene are also presented in Table 5. The mass fraction of Limonene at the air-conditioning inlet is altered by
$ \pm 10{\rm{\% }}$
mass flow variation cases is less than 0.1 % for all six VOCs, meaning that the measurements are independent of the air-conditioning system fan speed setting. Moreover, the measurements for Limonene are also presented in Table 5. The mass fraction of Limonene at the air-conditioning inlet is altered by $ \pm 10{\rm{\% }}$
, compared to the reference case, which is shown in Table 4, and measurements are taken by the monitored nodes close to the noses of the manikins. It is observed that the measurements of the other five VOCs remain unaffected by the variation, with the difference between them being less than 1%, for all compounds. Additionally, it is observed that for a 10% reduction of the mass fraction at the inlet, the monitored nodes’ measurements show 7.41% less Limonene mass, compared to the reference. The exact opposite measurement is taken for the 10% increase in the inlet mass fraction. The same analysis was performed for the rest of the VOCs, namely, tetrachloroethylene, styrene, naphthalene, linalool, and citral, and the same trends are observed.
$ \pm 10{\rm{\% }}$
, compared to the reference case, which is shown in Table 4, and measurements are taken by the monitored nodes close to the noses of the manikins. It is observed that the measurements of the other five VOCs remain unaffected by the variation, with the difference between them being less than 1%, for all compounds. Additionally, it is observed that for a 10% reduction of the mass fraction at the inlet, the monitored nodes’ measurements show 7.41% less Limonene mass, compared to the reference. The exact opposite measurement is taken for the 10% increase in the inlet mass fraction. The same analysis was performed for the rest of the VOCs, namely, tetrachloroethylene, styrene, naphthalene, linalool, and citral, and the same trends are observed.
Table 5. Input parameters sensitivity analysis for the cabin model


Figure 3. Importance of each variable according to the Boruta feature selection algorithm.
Having concluded the sensitivity analysis of the model to the input parameters, the feature selection-based Boruta algorithm is used, to determine the most important variables of the time-transient model that affect odour prediction and quantification. The dataset is copied and the rows in each column are shuffled. These values are called shadow features (Shadow Min, Mean, and Max colored in blue in Fig. 3) and are used by the algorithm to decide the importance of each variable. In addition, the red and green bars are the features that are rejected as less important and accepted as important respectively [Reference Szul, Tabor and Pancerz33]. In addition, the RT is calculated using data from the CFD model, according to Equation (1) and Equation (2), where ${m_{VOC,i}}$
is the mass of each VOC at the mass flow inlet,
${m_{VOC,i}}$
is the mass of each VOC at the mass flow inlet, $\psi $
is the mass fraction of each VOC, and
$\psi $
is the mass fraction of each VOC, and ${\dot m_{out}}$
is the total mass flow at the outlet.
${\dot m_{out}}$
is the total mass flow at the outlet.
Table 6. Boruta algorithm feature selection synopsis

Table 7. Performance assessment of four machine learning classifiers

The result of the Boruta evaluation is shown in Fig. 3, where the variables are sorted from the least important (left) to the most important (right). It is observed that the mass of all compounds and the actual flow time show equivalent importance, according to the algorithm’s criteria, whereas the pressure difference measurements are classified as not important. Furthermore, since the in-cabin flow is not symmetric in the XZ plane, there are differences in the measurements of the two monitored areas, that affect the characterisation of the importance of each variable. In other words, it is suggested that not all passengers share the same odour experience during flight, due to in-cabin flow irregularities. Finally, the variables that stand out, according to the Boruta selection algorithm, namely, the styrene and naphthalene mass on both sides and the total in-cabin air mass on the right side, are summarised in Table 6, along with their mean importance.
 \begin{align}\psi = {{{m_{VOC,i}}} \over {\mathop \sum \nolimits_{n = 0}^n {m_{VOC,i}}}} \end{align}
 \begin{align}R.T. = \frac{\psi }{{{{\dot m}_{out}}}} \cdot {m_{VOC,i}}\end{align}
The created dataset derived from the Boruta feature selection algorithm is used as an input by four different machine learning classifiers. The first evaluation is performed using the Random Forest classifier with 200 trees, which appears to have the best performance of the four, as shown in Table 7.
Considering the confusion matrix there are no mispredictions in the data, whereas the sensitivity and the specificity of the model are equal to 1. Additionally, the performance accuracy of the algorithm is 100%. Then, the Support Vector Machine algorithm is tested, aiming to optimise a cost objective function, based on prediction accuracy, showing performance metrics matching those of the Random Forest. Moving on to the logistic regression method, it has the worst performance, with an accuracy of 90.9%, a sensitivity of 0.89, and a specificity of 0.93. The model seems to predict odours in cases where it shouldn’t, as some false signals are interpreted as true, according to the confusion matrix. In addition, some odours are not predicted during the training, as some true signals are interpreted as false. Finally, the Naive Bayes classifier has the second-best prediction performance, with an accuracy of 96%, a sensitivity of 1, and a specificity of 0.92. Again, this method also predicts odours in cases where it shouldn’t, according to the confusion matrix in Table 8. From the classifiers’ comparison, the Random Forest and the Support Vector Machine methods show superior performance compared to the rest. However, since Boruta is a feature ranking and selection algorithm based on Random Forest, the results may be biased. This can be supported by the fact that the methods have 100% accuracy and make no mistakes during the training phase. For this reason, the second-best candidate will be selected for the digital nose model, namely the Naive Bayes, with 96% accuracy.
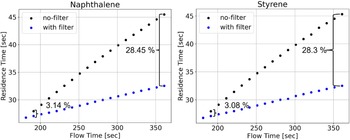
The previous analysis concerns a typical air-conditioning unit, without an additional air filtering treatment. However, it is common practice to use novel filtering systems, such as HEPA/ACF filters, to clear the air inside the cabin, as mentioned in the introduction. These filters have high filtration effectiveness and maintain the CAQ within acceptable limits, as defined by health standards. Therefore, a second study is performed to capture the impact of the filters on the in-cabin air quality and assess the effect of the molecular weight of VOCs on their residence time. These filters are applied to the air-conditioning system, where 50% of the incoming air is from the outside, including VOCs, whereas the rest 50% is recycled air that passes through the filter. As mentioned in the methodology section, the air filtration and mixing of the system occurs every 3 min and the RT is calculated for a full filtration cycle. The difference between the residence time for the case with and without the filter, for naphthalene and styrene, is shown in Fig. 4, as calculated using data from the CFD model. It is observed that for the filter case, the RT is reduced, compared to the no-filter case. Moreover, this difference increases with the transient flow progress, starting from 3.14% and 3.08% to 28.45% and 28.3% for the naphthalene and styrene, respectively, for the 190 and 360 s of flow time correspondingly. Furthermore, the slope of the RT as a function of the simulation time is reduced compared to the no-filter case. The same measurements are performed for the other VOCs and similar trends are observed. Finally, the evaluation of RT for all VOCs indicates that it is independent of the molecular weight of the compounds since they all show equivalent percentile reduction.

Figure 4. Cabin air quality monitoring with and without filtering system for naphthalene and styrene compounds.
To quantify the magnitude of asymmetry caused by flow irregularities that disrupt in-cabin flow symmetry, the next step is to manufacture a full-scale test rig to validate the simulation results by recreating the experiment in real conditions. However, the cost of equipment and construction of the rig must be considered. Since the cabin size is small, as it is derived from the commuter class, there is greater potential for construction at a lower production cost and room requirements. The results of the preliminary assessment of the cabin slice simulation suggest that a cabin slice of three rows (approximately 2.5m in length) is adequate to capture the in-cabin flow field and overall passenger odour experience. To achieve this, a small-scale ECS is required, capable of monitoring and maintaining in-cabin conditions in harmony with the actual cabin environment during flight. The system should also be versatile enough to recreate all possible pressure and temperature conditions throughout a typical flight mission. Furthermore, an odour-controlling system should be introduced, capable of creating and dissipating multiple types of ingested odours through the ventilation system. Proper mechanical odour sensors [Reference Wen, Luo, He and Mei2] should be placed appropriately in proximity to the passengers’ noses to capture odours similar to the human olfactory system. Additionally, odour sources will be placed in the test rig seats to assess the breathing impact of others on the odour experience of an individual. Moreover, it is important to explore the effect of contaminants that settle into in-cabin surfaces on their detectability. Test campaigns, including questionnaires [Reference Schrepp, Hinderks and Thomaschewski34], will be set up to evaluate different individuals exposed to different scents and explore potential sex differences in odour perception [Reference Sorokowski and Karwowski35], considering confounding variables such as age, smoking status, etc. As a future step, the study could be extended to consider biomedical characteristics. For example, anatomical characteristics affecting breathing rate, and relevant pathophysiological conditions such as healthy individuals compared to others with reduced breathing rates. The latter would indicate reduced effectiveness in sensing odour and hence, a more detailed study should take place. In conclusion, the design and manufacturing of a full-scale test rig to assess the in-flight passenger odour experience presents major challenges, including the issues mentioned above.
4.0 Conclusions
A CFD simulation for a small aircraft cabin slice was performed, to investigate the impact of high VOCs concentrations on passenger comfort. A grid-independent transient flow simulation of 800 s of actual flow time was solved, to obtain real-time measurements of odours, using monitored computational nodes, located close to the passengers’ noses. Additionally, variation analyses were performed to determine the model’s sensitivity to changes in the input parameters. The air mass flow of the air-conditioning system and the mass fractions of the VOCs at the inlet were varied by $ \pm $
10% of their nominal values, and the model was proven to be insensitive to the air mass flow variation. Also, the variation of the mass fraction of a certain VOC did not affect the measurements of the others during the simulation. Subsequently, the measurements from the 800 s of actual flow time were evaluated using a Boruta feature selection algorithm, to determine the importance of each measurement, and select the most important ones to be used to train the machine learning classifiers. Four classifiers were considered, namely, the Random Forest, Support Vector Machine, Logistic Regression, and Naive Bayes, and their performance was compared, with the Naive Bayes having a prediction accuracy of 96%, which was eventually selected for the digital nose model. Furthermore, the addition of HEPA combined with ACF was considered, to compare two different air-conditioning systems, one with the filters and one without, and determine the impact of the molecular weight of VOCs on their respective in-cabin RT. It was observed that the RT was independent of the molecular weight of the VOCs, since all six VOCs showed an almost equal reduction in their in-cabin RT, with the naphthalene and styrene showing an RT reduction of 28.45% and 28.3%, respectively, compared to the case without the filters. Finally, the simulated flow showed irregularities that disrupted the symmetry of the field, suggesting the possibility that passengers share different in-cabin odour experiences, thus mandating the construction of a full-scale cabin test rig, consisting of at least three seat rows.
$ \pm $
10% of their nominal values, and the model was proven to be insensitive to the air mass flow variation. Also, the variation of the mass fraction of a certain VOC did not affect the measurements of the others during the simulation. Subsequently, the measurements from the 800 s of actual flow time were evaluated using a Boruta feature selection algorithm, to determine the importance of each measurement, and select the most important ones to be used to train the machine learning classifiers. Four classifiers were considered, namely, the Random Forest, Support Vector Machine, Logistic Regression, and Naive Bayes, and their performance was compared, with the Naive Bayes having a prediction accuracy of 96%, which was eventually selected for the digital nose model. Furthermore, the addition of HEPA combined with ACF was considered, to compare two different air-conditioning systems, one with the filters and one without, and determine the impact of the molecular weight of VOCs on their respective in-cabin RT. It was observed that the RT was independent of the molecular weight of the VOCs, since all six VOCs showed an almost equal reduction in their in-cabin RT, with the naphthalene and styrene showing an RT reduction of 28.45% and 28.3%, respectively, compared to the case without the filters. Finally, the simulated flow showed irregularities that disrupted the symmetry of the field, suggesting the possibility that passengers share different in-cabin odour experiences, thus mandating the construction of a full-scale cabin test rig, consisting of at least three seat rows.
Acknowledgements
Results presented in this work have been produced using the Aristotle University of Thessaloniki – AUTH Compute Infrastructure and Resources, therefore, the authors would like to acknowledge the support provided by the Scientific Computing Office throughout the progress of this research work. Also, the authors would like to thank HEAL-Link for financially supporting the publication of this article in OA mode.


 Open access