


Nomenclature
- base
-
base model part (clear aircraft, no ice)
- $C_{(\cdot)}$
-
aerodynamic coefficient
-
$C_{D{}}$
-
drag coefficient
-
$C_{D{{0}}}$
-
zero-lift drag coefficient
-
$C_{L{}}$
-
lift coefficient
-
$C_{l{}}$
-
rolling moment coefficient
-
$C_{L{{0}}}$
-
lift coefficient at
$\alpha=0^\circ$
-
$C_{m{}}$
-
pitching moment coefficient
-
$C_{m{{0, \mathrm{WB}}}}$
-
wing/body pitching moment coefficient at
$\alpha=0^\circ$
-
$c_1$
,
$\alpha^\star$
-
separation point function parameters
- D
-
drag force, N
- DR
-
Dutch roll
- g
-
gravitational acceleration, m/s
$^2$
- IAS
-
indicated airspeed
- ice
-
$\Delta$
-model part (icing)
-
$k_{P},d_{P}$
-
icing model parameters
- L
-
lift force, N
-
$L/D$
-
lift-to-drag ratio
- L, M, N
-
body-fixed aerodynamic moments,Nm
-
$m_{\mathrm{AC}}$
-
aircraft mass, kg
- max
-
maximum value
- P
-
model parameter
- PH
-
phugoid
- p, q, r
-
rotational velocities, rad/s
- req
-
required
- RO
-
rolling motion
- SEP
-
specific excess power, m/s
- SLD
-
Supercooled Large Droplets
- SP
-
short period
- T
-
engine thrust force, N
- TAS
-
true airspeed
- TWR
-
thrust-to-weight ratio
- V
-
velocity, m/s
- WB
-
wing/body
-
$\widehat{X}$
-
non-dimensional location of the wing separation point
-
$y^{1,2}_{\rm \mathrm{Wing}}$
-
wing force application point


Greek Symbol
-
$\alpha$
-
angle of attack, rad
-
$\beta$
-
angle of sideslip, rad
-
$\eta$
-
elevator deflection, rad
-
$\zeta$
-
damping
-
$\xi$
-
aileron deflection, rad
-
$\omega_{0}$
-
natural frequency, rad/s


1.0 Introduction
Icing can have hazardous effects on aircraft performance characteristics and can be a limiting factor for the safe flight envelope. The change of the dynamic behaviour and potential premature stall raise the need for pilot situational awareness and an adaption of control strategy. Various accidents worldwide have shown the severity of icing related degradations, e.g., Refs. [Reference Green1–4], especially when caused by supercooled large water droplets (SLD) against which current aircraft are not protected. The certification of (modern) transport aircraft for flight into (known) icing conditions was mainly based on the certification requirements given in the so-called App. C to e.g., CS-25. But with the identified hazard to fixed-wing aircraft resulting from SLD the aviation agencies issued the new App. O to the certification requirements. From now on, manufacturers must prove that a newly developed aircraft is also safe for flight into these even more hazardous atmospheric icing conditions.
The new certification requirements led to a demand for acceptable means of compliance and consequently the question about a way to safely demonstrate the remaining aircraft capabilities in flight for the case of SLD icing. These icing conditions can pose a high risk to the aircraft, crew and passengers, which requires a large effort to assure aircraft safety during flight test. Hence, it is mandatory to analyse the possible aircraft performance and control degradation introduced by SLD icing and also monitor the aircraft’s remaining capabilities during the complete test flight. The distinct change of aircraft characteristics caused by SLD ice formation is not easy to predict and still topic of current aviation research. As the overall need for a better understanding of the SLD-icing effects on aircraft was identified as a research gap, a German nationally funded research project named SuLaDI (Supercooled Large Droplet Icing) was established between DLR and TU Braunschweig (2011–2016). In parallel, a joint research activity between DLR and Embraer was conducted between 2012 and 2016 to further investigate the icing degradation of aircraft in general but with a distinct view to SLD conditions. The major advantage of this research cooperation was the focus on flight test and flight data analysis with respect to different icing cases (App. C and App. O), which was not part of SuLaDI but is highly important to answer some questions about the distinct effects of icing on aircraft characteristics.
In general, during the flight through icing conditions, ice can accumulate on airframe parts facing the inflow e.g., wing or stabilizer leading edges, aircraft nose, engine intakes or sensors if these are not protected by any countermeasures. The main aerodynamic degradation is expected to be caused by wing ice accretions and manifests itself in a reduced stall angle-of-attack, reduced maximum lift and increased drag. These accumulations can form different shapes depending on e.g., atmospheric conditions and aircraft geometry. The general aerodynamic influence is outlined for example in the AGARD Report 344 [5] and given in Fig. 1a. Expectable changes of the lift and drag distributions are illustrated in Fig. 1b. In the past, these icing-effects had been investigated in various studies for different aerofoils and icing cases [5–Reference Broeren, Whalen, Busch and Bragg7] as well as for the complete aircraft [Reference Ranuado, Batterson, Reehorst, Bond and O’Mara8–Reference Gingras11]. Furthermore, in case of asymmetric wing ice accretion, the reduced stall angle-of-attack can cause the aircraft to roll suddenly, and if stall occurs locally on one wing, a loss of control event might be the result. To obtain a better understanding of these icing effects on aircraft performance and dynamics, new aerodynamic models for nonlinear aircraft simulations have been developed [Reference Deiler12, Reference Deiler13], which are based on a different approach than already existing models [Reference Bragg, Hutchison, Merret, Oltman and Pokhariyal14–Reference Lampton and Valasek17].
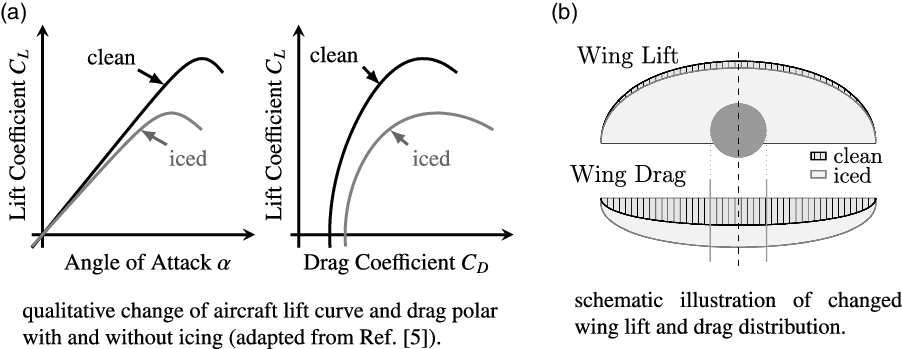
Figure 1. General expected aerodynamic degradation due to icing.
This paper shows the supplementary results of the joint DLR-Embraer research on aircraft icing which make a contribution to some of the key scientific aspects related to aircraft icing, e.g., aircraft operational limitations and behaviour with accumulated ice on various surfaces. It presents the approach used to analyse the degrading effects of icing with regard to certain SLD-ice configurations on a specific aircraft –– a Phenom 300 prototype (see Fig. 2):

Figure 2. Embraer Phenom 300 test aircraft.
-
1. flight tests data analysis of Phenom 300 flights with artificial SLD-ice shapes, the related dynamic simulation model identification and the model comparison with App. C configuration results in Section 3;
-
2. comparison of icing effects, i.e. by an exemplary evaluation of change in aircraft performance (see Section 4), flight dynamics and handling qualities (see Section 5).
A summary and conclusions on the overall results are given in Section 6.
2.0 Modeling of icing effects in aircraft flight simulation
The aerodynamic $\Delta$
-model formulation which accounts for additional icing effects on aerodynamics is formulated as an extension of previously developed and validated simulation models for a specific aircraft. It enables to simulate the aerodynamic performance changes due to additional forces and moments related to icing, which are calculated by the
$\Delta$
-model formulation which accounts for additional icing effects on aerodynamics is formulated as an extension of previously developed and validated simulation models for a specific aircraft. It enables to simulate the aerodynamic performance changes due to additional forces and moments related to icing, which are calculated by the $\Delta$
-model in parallel to the basic aircraft’s aerodynamics and summed up afterwards (see Fig. 3). During this process the
$\Delta$
-model in parallel to the basic aircraft’s aerodynamics and summed up afterwards (see Fig. 3). During this process the $\Delta$
-model is directly connected to the basic aircraft’s aerodynamics to use information about the basic aerodynamics where necessary.
$\Delta$
-model is directly connected to the basic aircraft’s aerodynamics to use information about the basic aerodynamics where necessary.
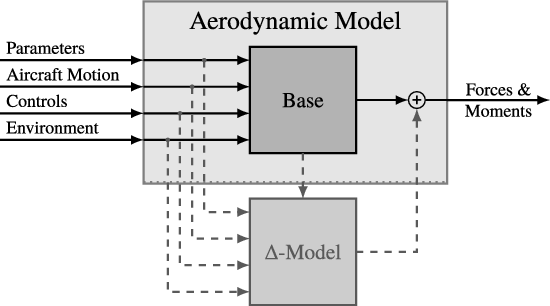
Figure 3. Aerodynamic model with $\Delta$
-model extension (from Ref. [Reference Deiler13]).
$\Delta$
-model extension (from Ref. [Reference Deiler13]).
The basic idea of the model extension is to use linearly altered parameters for icing-induced aerodynamic changes in aircraft simulation. The application of such a parameter extension for the modelling of icing effects was first introduced by Bragg [Reference Bragg, Hutchison, Merret, Oltman and Pokhariyal14] around the turn of the millennium. An arbitrary model parameter P including a basic model part ${P}_{{\rm base}}$
and an additional
${P}_{{\rm base}}$
and an additional $\Delta$
-model part
$\Delta$
-model part $\Delta{{P}}_{{\rm ice}}$
can be expressed as
$\Delta{{P}}_{{\rm ice}}$
can be expressed as
 \begin{equation} P = \left(1+k_{{P}}\right) \cdot {P}_{{\rm base}} + d_{P} = {P}_{{\rm base}} + \Delta{{P}}_{{\rm ice}},\end{equation}
with the additional factor $k_{P}$
and the offset
$k_{P}$
and the offset $d_{P}$
to model the degraded aircraft aerodynamics. For an arbitrary aerodynamic model coefficient
$d_{P}$
to model the degraded aircraft aerodynamics. For an arbitrary aerodynamic model coefficient $C_{(\cdot)}$
depending on an extended parameter P this separation yields in general:
$C_{(\cdot)}$
depending on an extended parameter P this separation yields in general:
 \begin{equation} C_{(\cdot)}(P) = C_{(\cdot)}\left({P}_{{\rm base}} + \Delta{{P}}_{{\rm ice}}\right) = {\big(C_{(\cdot)}\left({P}_{{\rm base}}\right)\big)}_{{\rm base}} + \Delta{{\big(C_{(\cdot)}\left({P}_{{\rm base}} + \Delta P_{\rm ice}\right)\big)}}_{\rm ice}.\end{equation}
This coefficient separation can lead to various formulations of the $\Delta$
-model depending on the structure of the base aerodynamic model and therefore the considered aircraft. Moreover, the
$\Delta$
-model depending on the structure of the base aerodynamic model and therefore the considered aircraft. Moreover, the $\Delta$
-model structure may vary with the objectives of the later usage. The models presented in Refs. [Reference Deiler13, Reference Deiler and Kilian18] were used for the evaluations presented in this paper. For the the formulation of the aircraft’s equations of motion as well as the base aircraft aerodynamics, the reader is referred to Refs. [Reference Deiler13, Reference Deiler and Kilian18–Reference Jategaonkar20] and the publications referenced therein. A further description of the base aircraft model description, the specific flight test campaign for system identification data generation and the system identification results is given in Ref. [Reference Deiler, Ohme, Raab, Mendonca and Silva21].
$\Delta$
-model structure may vary with the objectives of the later usage. The models presented in Refs. [Reference Deiler13, Reference Deiler and Kilian18] were used for the evaluations presented in this paper. For the the formulation of the aircraft’s equations of motion as well as the base aircraft aerodynamics, the reader is referred to Refs. [Reference Deiler13, Reference Deiler and Kilian18–Reference Jategaonkar20] and the publications referenced therein. A further description of the base aircraft model description, the specific flight test campaign for system identification data generation and the system identification results is given in Ref. [Reference Deiler, Ohme, Raab, Mendonca and Silva21].
3.0 Iced-aircraft simulation models
The main focus of today’s icing research lies on supercooled large droplets (SLD) icing. During the DLR-Embraer cooperation several models for different ice configurations on the Phenom 300 were developed. Initially, data of former test flights with two different artificial App. C ice configurations (see Fig. 4) were analysed [Reference Deiler13]. The projects main focus was the the analysis of three different SLD-ice configurations on the Phenom 300. The definition of the SLD-ice shape was based on several assumptions [Reference Deiler, Ohme, Raab, Mendonca and Silva21]. These resulted in residual ice formations/shapes behind the protected areas as well as ice formations/shapes on unprotected airframe parts. Specific CFD calculations led to the determination of the specific SLD-ice shapes, which were further tested on a Phenom 300 model at TsAGI’s T-128 dry air wind tunnel. The results of the $\Delta$
-model identification for the different investigated SLD-ice configurations are given in this paper.
$\Delta$
-model identification for the different investigated SLD-ice configurations are given in this paper.

Figure 4. Schematic illustration of the App. C wing ice shape configurations: run-back ice (left) and leading-edge ice (right).
3.1 Appendix O data analysis and model development
The definition process for the artificial SLD-ice shapes and together with the results of the dry-air wind tunnel tests are presented in Ref. [Reference Deiler, Ohme, Raab, Mendonca and Silva21]. The major results of the wind tunnel test campaign can be summarized as follows: the chordwise position of the SLD ice shape has a great impact on the icing-related aerodynamic degradation with reduced influence towards the trailing edge. The most severe degradation found during the wind tunnel test was
-
• a decrease of about 35% of the maximum lift coefficient;
-
• a drag increase of about 150%;
-
• a destabilizing shift of the neutral-point position equivalent to 8% of the reference chord.
Based on the wind tunnel results a position for the ridge ice shape close the to leading-edge was selected for flight-test. Figure 5 provides an illustration of this wing ice shape configuration. The decision was based on the fact that this configuration caused a similar level of maximum lift degradation compared to other tested configurations but guarantees sufficient aileron effectiveness at low angle-of-attack. With the definition of SLD-ice shapes and the flight clearance after the dry-air wind tunnel test with the Phenom 300 model, the flight test campaign was conducted in November 2015. The flight tests took also place at Embraer’s flight test site in Gavião Peixoto. For the flight tests, artificial ice shapes were fabricated in full scale and glued to the aircraft skin. Three different aircraft configurations were foreseen for the flight test program:
-
1. Low-Risk SLD: Artificial ice on the radome, winglets and on the wing upper and lower surface except for the wing area around the ailerons (SLD 1).
-
2. Incremental SLD: Artificial ice on the radome, winglets and on the wing upper and lower surface including the wing area around the ailerons (SLD 2).
-
3. Nominal SLD: Artificial ice on the radome, engine pylons, winglets and on the wing upper and lower surface including the wing area around the ailerons (SLD 3).

Figure 5. Schematic illustration of the artificial wing SLD-ice shapes (not to scale) used for all three SLD configurations.
System identification manoeuvres were performed at three different altitudes (10,000, 15,000 and 20,000ft) and two different velocities (170 and 220kt). The flight test consisted of the same manoeuvres already performed with the clean aircraft for basic model identification [Reference Deiler, Ohme, Raab, Mendonca and Silva21]. The low speed limit of 170kt indicated airspeed was a results of the wind tunnel test analysis: an increase of the stall speed by a factor of nearly 1.3 for configurations with artificial ice shapes was detected and required the increase in stall margin. During all flights with the SLD-ice shapes a telemetry link was used to send the data to a ground station. Several online system identification tools [Reference Raab, Ohme and Deiler22] were operated for monitoring the aircraft characteristics during the whole flight on ground with live data. This way the crew was informed about the current flight characteristics of the aircraft at any time via a direct radio link.
For the first, low-risk SLD-ice flight 30 data segments with approximately 564s of flight time were available after the flight test. These contained necessary manoeuvres to identify parameters of the aerodynamic $\Delta$
-model. This first test flight was relatively short and manoeuvres were flown very carefully because the flight crew was concerned about potential degradations of the flight characteristics beyond the expectations, e.g., significantly reduced control surface effectiveness or premature stall. But the initial flight data analysis did not underpin these concerns. For example, the drag curve is calculated from the measured data and plotted together with base aircraft’s drag in Fig. 6a. Note that the data are proprietary and the plot ticks do not contain absolute values which does certainly not affect any results or conclusions.
$\Delta$
-model. This first test flight was relatively short and manoeuvres were flown very carefully because the flight crew was concerned about potential degradations of the flight characteristics beyond the expectations, e.g., significantly reduced control surface effectiveness or premature stall. But the initial flight data analysis did not underpin these concerns. For example, the drag curve is calculated from the measured data and plotted together with base aircraft’s drag in Fig. 6a. Note that the data are proprietary and the plot ticks do not contain absolute values which does certainly not affect any results or conclusions.
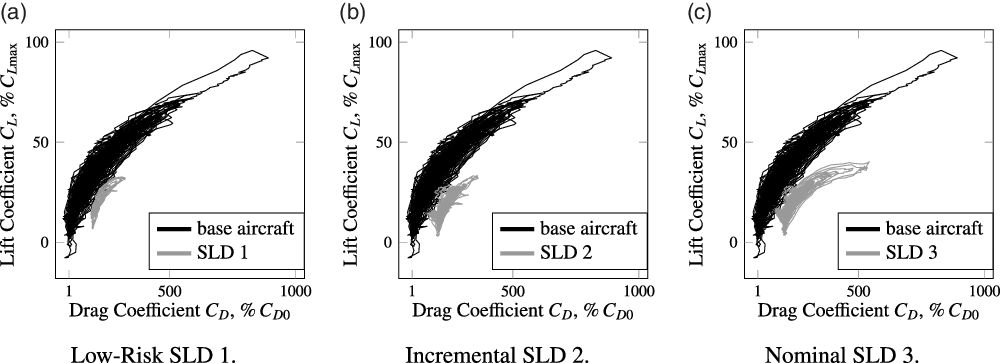
Figure 6. Drag polars computed from measurements as a result of flight test manoeuvres: clean aircraft (black) and specific SLD-ice configuration (gray). Data scaled to base aircraft max. lift coefficient (ordinate) and multiples of zero-lift drag (abscissa).
There was no further restriction to follow the flight test program by another test flight with the incremental SLD configuration (SLD 2) having also ice shape attached in front of the ailerons. For parameter estimation 45 manoeuvres with a total recording time of approximately 1,365s were extracted from the flight data recordings. The drag curve is also calculated from the flight data recordings and plotted together with base aircraft’s drag in Fig. 6b. The third flight was performed with the nominal SLD-ice configuration, which additionally included ice shapes on the engine pylons. But with the pylons having only a minor effect on the aerodynamic (lift) performance of the aircraft, it could be assumed that the main difference to the second test flight (SLD 2) would be an increase in drag. The data used for the further analysis contain 51 segments with around 1,448s of recorded flight time. The calculated drag polar is shown in Fig. 6c.
With these different available flight data sets the $\Delta$
-model structure presented in Ref. [Reference Deiler13] was again used to identify parameters which allow suitably representing the change in aircraft aerodynamics for the different SLD-ice configurations. For the SLD 1 and 2 configurations the already existing model structure was well applicable. But to cover the influence from the additional engine pylon ice shapes of the SLD 3 configuration, the
$\Delta$
-model structure presented in Ref. [Reference Deiler13] was again used to identify parameters which allow suitably representing the change in aircraft aerodynamics for the different SLD-ice configurations. For the SLD 1 and 2 configurations the already existing model structure was well applicable. But to cover the influence from the additional engine pylon ice shapes of the SLD 3 configuration, the $\Delta$
-model structure is extended with an additional drag increase
$\Delta$
-model structure is extended with an additional drag increase $k_{C_{D{{0,\mathrm{pylon}}}}}$
:
$k_{C_{D{{0,\mathrm{pylon}}}}}$
:
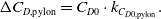 \begin{equation} \Delta C_{D{{,\mathrm{pylon}}}} = C_{D{{0}}} \cdot k_{C_{D{{0,\mathrm{pylon}}}}}.\end{equation}
Before the post flight $\Delta$
-model identification was conducted, a sensor calibration check was done, verifying that the previously developed sensor models were still applicable to the flight test data. As an example of the models’ quality time histories of two manoeuvres for SLD 3 configuration are given in Fig. 7: one longitudinal and one lateral dynamics manoeuvre. Similar results are obtained for the other two SLD-ice configurations. Time histories of the elevator 3-2-1-1 multistep input manoeuvre (see Fig. 7a) show a very good match of simulation after identification and measurements. Note that the difference in noticeable airspeed offset between measurement and simulation is very small; the whole airspeed variation during the manoeuvre is less than 2kt. After successful parameter estimation, the
$\Delta$
-model identification was conducted, a sensor calibration check was done, verifying that the previously developed sensor models were still applicable to the flight test data. As an example of the models’ quality time histories of two manoeuvres for SLD 3 configuration are given in Fig. 7: one longitudinal and one lateral dynamics manoeuvre. Similar results are obtained for the other two SLD-ice configurations. Time histories of the elevator 3-2-1-1 multistep input manoeuvre (see Fig. 7a) show a very good match of simulation after identification and measurements. Note that the difference in noticeable airspeed offset between measurement and simulation is very small; the whole airspeed variation during the manoeuvre is less than 2kt. After successful parameter estimation, the $\Delta$
-model allows to cover the significant changes of the aircraft characteristics. The time histories of an example roll response manoeuvre for SLD 3 configuration are given in Fig. 7b. These manoeuvres were performed during the flight test frequently at different airspeeds to check the available control surface effectiveness. After identification, the simulation matches these lateral manoeuvres also very well.
$\Delta$
-model allows to cover the significant changes of the aircraft characteristics. The time histories of an example roll response manoeuvre for SLD 3 configuration are given in Fig. 7b. These manoeuvres were performed during the flight test frequently at different airspeeds to check the available control surface effectiveness. After identification, the simulation matches these lateral manoeuvres also very well.
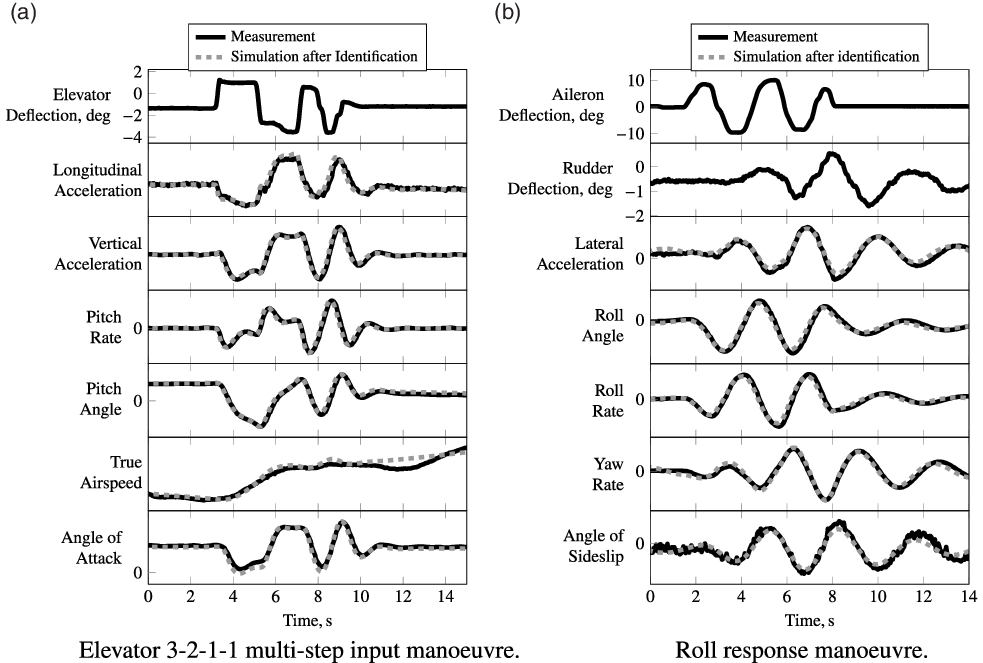
Figure 7. Time history comparison of identified nominal SLD aircraft model (SLD 3) simulation outputs and corresponding measurements for two example manoeuvres.
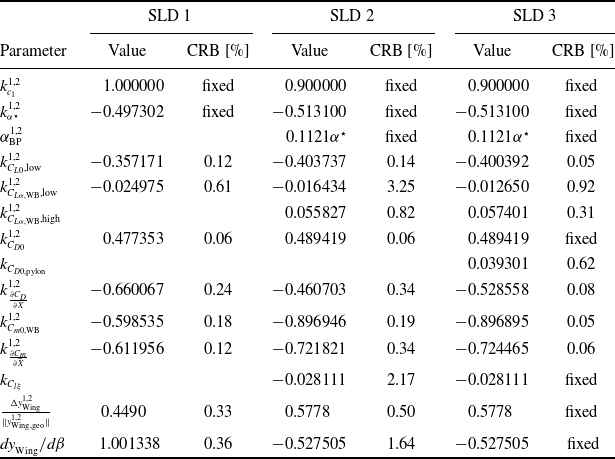
The estimates for the $\Delta$
-model parameters are given in Table 1 together with the values of the Cramér-Rao lower bounds of the final estimation iteration for all three SLD-ice configurations. Note that these parameter values directly reflect the aerodynamic changes for each SLD-ice configuration and are of high importance for further work like the definition of threshold values for indirect ice detection techniques based on changes of the aircraft characteristics [Reference Deiler and Fezans23]. Similar to the parameter estimates for the App. C configurations given in Ref. [Reference Deiler13], some parameters had been fixed during the estimation, which is marked in the CRB column in the table. Note that some parameters were initially fixed and others were not estimated until the final estimation iteration. For example, the stall model parameter
$\Delta$
-model parameters are given in Table 1 together with the values of the Cramér-Rao lower bounds of the final estimation iteration for all three SLD-ice configurations. Note that these parameter values directly reflect the aerodynamic changes for each SLD-ice configuration and are of high importance for further work like the definition of threshold values for indirect ice detection techniques based on changes of the aircraft characteristics [Reference Deiler and Fezans23]. Similar to the parameter estimates for the App. C configurations given in Ref. [Reference Deiler13], some parameters had been fixed during the estimation, which is marked in the CRB column in the table. Note that some parameters were initially fixed and others were not estimated until the final estimation iteration. For example, the stall model parameter $k_{c_1}^{1,2}$
was initially set to the given values similar to the process for the App. C configurations [Reference Deiler13]. The parameter
$k_{c_1}^{1,2}$
was initially set to the given values similar to the process for the App. C configurations [Reference Deiler13]. The parameter $k_{\alpha^\star}^{1,2}$
was fixed during the system identification process. Moreover, as the SLD 3 configuration differs from SLD 2 only in the additional pylon ice shapes, several parameters were kept on the values estimated for SLD 2 during the SLD 3 model identification. It was assumed that these parameters should not vary between both configurations because there should be no effect of the engine pylon shapes on the overall aerodynamic characteristics covered by these coefficients. Furthermore, the system identification results for all three SLD-ice configurations show that the
$k_{\alpha^\star}^{1,2}$
was fixed during the system identification process. Moreover, as the SLD 3 configuration differs from SLD 2 only in the additional pylon ice shapes, several parameters were kept on the values estimated for SLD 2 during the SLD 3 model identification. It was assumed that these parameters should not vary between both configurations because there should be no effect of the engine pylon shapes on the overall aerodynamic characteristics covered by these coefficients. Furthermore, the system identification results for all three SLD-ice configurations show that the $\Delta$
-model is capable to match the changes of lateral aircraft dynamics in its given structure: in contrast to the App. C ice shape evaluation [Reference Deiler13] no significant changes of lateral aerodynamics coefficients in the model are revealed. But there is a change of lateral force application point
$\Delta$
-model is capable to match the changes of lateral aircraft dynamics in its given structure: in contrast to the App. C ice shape evaluation [Reference Deiler13] no significant changes of lateral aerodynamics coefficients in the model are revealed. But there is a change of lateral force application point $\Delta y^{{1,2}}_{\rm \mathrm{Wing}}$
detectable between SLD 1 and SLD 2/3 configuration: the additional ice shape in front of the ailerons shift the force application point and therefore slightly changes the lateral behaviour of the aircraft. Similarly, due to the complex aerodynamics along the wing with ice shapes present, the force application point shifts with the angle of sideslip represented by
$\Delta y^{{1,2}}_{\rm \mathrm{Wing}}$
detectable between SLD 1 and SLD 2/3 configuration: the additional ice shape in front of the ailerons shift the force application point and therefore slightly changes the lateral behaviour of the aircraft. Similarly, due to the complex aerodynamics along the wing with ice shapes present, the force application point shifts with the angle of sideslip represented by $dy^{{}}_{\rm \mathrm{Wing}}/d\beta$
. The change of parameter value from low-risk to nominal SLD-ice configuration reflects the complex aerodynamics, which is also observed for the App. C configurations analysed in Ref. [Reference Deiler13]. The relatively small values of the Cramér-Rao lower bounds indicate that the estimation problem was well posed and the choice of model parameters suitable for the model identification. Hence, although the
$dy^{{}}_{\rm \mathrm{Wing}}/d\beta$
. The change of parameter value from low-risk to nominal SLD-ice configuration reflects the complex aerodynamics, which is also observed for the App. C configurations analysed in Ref. [Reference Deiler13]. The relatively small values of the Cramér-Rao lower bounds indicate that the estimation problem was well posed and the choice of model parameters suitable for the model identification. Hence, although the $\Delta$
-model structure is relatively complex, it is able to well predict the aircraft aerodynamics for the different SLD-ice configurations with a little number altered model parameters.
$\Delta$
-model structure is relatively complex, it is able to well predict the aircraft aerodynamics for the different SLD-ice configurations with a little number altered model parameters.
Table 1. Estimated $\Delta$
-model parameters of investigated icing cases and the corresponding estimated Cramér-Rao lower bounds (CRB)
$\Delta$
-model parameters of investigated icing cases and the corresponding estimated Cramér-Rao lower bounds (CRB)
3.2 Comparison of models
The resulting models were used to simulate the change in aircraft aerodynamics for comparison between the individual SLD configuration and with the App. C ice shapes. The results for each identified lift curve and drag polar are given in Fig. 8. For a more distinct view on the degradation this figure contains two zoom plots of the lift and drag curve on the right hand side. Basically, all noticeable changes of aircraft aerodynamics are similar with regard to aircraft lift and drag degradation. Furthermore, the changes of aerodynamics resulting from the different SLD-ice configurations are quite similar to the leading-edge ice shape degradation (App. C), except for the zero-lift drag increase. Although the ice shapes on the wings are much smaller than in the leading-edge App. C case, the SLD-ice configurations show a significant degradation of aircraft aerodynamics and can be also detrimental for a safe aircraft operation.

Figure 8. Changes of lift and drag curves for different ice cases; aerodynamic model data (after identification) for the light business jet aircraft. Right hand side: zoom plots for medium lift coefficients. Data scaled to base aircraft max. lift coefficient (ordinate), corresponding max. angle of attack (abscissa), and multiples of zero-lift drag (abscissa).
The three models for each SLD-ice reflect the slightly different aircraft characteristics for each configuration, which can be also seen in the parameters listed in Table 1. The detectable drag change of the SLD 1 configuration is about 95% of the base aircraft’s zero lift drag with a stronger curvature of the drag polar. Further, a only slight lift curve slope reduction of 2% was estimated. The premature flow separation at angles of attack far below the base aircraft’s maximum angle-of-attack is similar to the behaviour detected for the leading-edge ice case. For the incremental ice configuration (SLD 2) with additional ice shapes in front of the ailerons the lift curve reveals a slightly nonlinear behaviour with a kink at an angle-of-attack of around 4deg. This might result from the additional ice shapes on the wing tip disturbing the flow over the wing and therefore influencing the whole aircraft’s lift characteristics. The predicted stall behaviour of the aircraft with this ice configuration is similar to SLD 1. The estimated drag increase reflects the effect of the additional ice shapes: zero-lift drag increases about 98% and the drag polar shows a stronger curvature. The SLD 3 configuration differs from SLD 2 only by the additional ice shapes on the engine pylons. Therefore, there are no significant changes in the lift characteristics detectable during the model identification compared to SLD 2, neither lift slope nor non-linear behaviour representing the wing flow separation. But the pylons also produce vertical forces and a slight change of the aircraft pitching moment was detected during the identification. The zero-lift drag increases by 4% and is accompanied by a slight reduction of the drag polar curvature.
The analysis of lateral aerodynamics revealed a change in the aircraft roll and yaw behaviour for all configurations, which directly affects the aircraft roll mode and Dutch roll. But only a small reduction of the aileron efficiency (2%) was found in the data analysis for SLD 2 and 3 configurations. These results are backed-up by pilots’ reports after the campaign: no significant change in relevant aircraft dynamics and handling qualities to safely operate the aircraft were noticeable during the flight.
4.0 Limitations of aircraft flight performance
The main influence of icing on a fixed-wing aircraft is the limitation of its flight performance. It constrains the possible aircraft operations, i.e. the aircraft range and endurance and/or the available speed range. The flight performance degradation is mainly affected by the increasing drag with ice accretion present on the wing. Consequently, the lift-to-drag ratio
 \begin{equation} L/D = \frac{C_{L{}}}{C_{D{}}}\ ,\end{equation}
which is a suitable parameter to describe an aircraft’s aerodynamic performance, decreases with stronger ice influence. Its change emerges directly from the different shapes of the lift and drag coefficient curves, and $L/D$
can quantify the performance loss for a given ice shape at a certain flight point. But for all aircrafts (except sailplanes) the correlation of loss in
$L/D$
can quantify the performance loss for a given ice shape at a certain flight point. But for all aircrafts (except sailplanes) the correlation of loss in $L/D$
and the required/available thrust is of greater interest, because then the operational limits of the aircraft are revealed.
$L/D$
and the required/available thrust is of greater interest, because then the operational limits of the aircraft are revealed.
Therefore the required thrust-to-weight ratio
 \begin{equation} \mathrm{TWR}_{\mathrm{req}} = \frac{T_{\mathrm{req}}}{m_{\mathrm{AC}}\cdot g},\end{equation}
for a steady horizontal flight is analysed and compared to
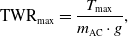 \begin{equation} \mathrm{TWR}_{\mathrm{max}} = \frac{T_{\mathrm{max}}}{m_{\mathrm{AC}}\cdot g},\end{equation}
which denotes the maximum available thrust-to-weight ratio at the given flight point and limits the (steady) aircraft envelope. The difference between the required and maximum available thrust-to-weight ratio determines to the specific excess power SEP [Reference Phillips24]
 \begin{equation} \mathrm{SEP} = \frac{\left(T_{\mathrm{max}}-T_{\mathrm{req}}\right)\cdot V_{\rm TAS}}{m_{\mathrm{AC}}\cdot g} = \left(\mathrm{TWR}_{\mathrm{max}}-\mathrm{TWR}_{\mathrm{req}}\right)\cdot V_{\rm TAS}\ ,\end{equation}
which is equivalent to the maximum available climb rate at a given speed and altitude.
DLR’s Matlab tool “MAPET” (Model-based Aircraft Performance Evaluation Tool) [Reference Ohme and Raab25] is used with both simulation models and the different available wing ice configurations for flight performance analysis. Based on trimmed flight conditions the tool evaluates several model in- and outputs and calculates the desired flight performance parameters. A complete flight performance analysis was performed for numerous altitudes and aircraft masses and gave well comparable results in all cases. Figure 9 contains analysis results for one example altitude (10,000ft), which represent well the region of the normal flight envelope where icing mainly occurs. Moreover, the results presented herein are exemplary for an aircraft mass of 7,500kg and an aircraft configuration with flaps clean and gear up. Figure 9 illustrates change of thrust-to-weight ratio (left side) and specific excess power (right side) versus indicated airspeed (base aircraft and five ice configurations). The required thrust-to-weight ratio significantly increases for indicated airspeeds above 200kt in all ice cases. Because of the well comparable identified increase in zero-lift drag for the three SLD-ice configurations the maximum achievable airspeed is very similar for these cases and far below the base aircraft’s limitation but above the maximum achievable airspeed for the App. C ice case. This result reflects the identified aerodynamics (see Fig. 8) and hence the expected degradations for the SLD configurations. The icing-induced premature stall behaviour, particularly in case of the SLD-ice configurations and the leading-edge ice, the corresponding drag increase cause also a restriction of the minimum airspeed which could be theoretically achieved in steady flight with the available engine thrust. But nevertheless, the aircraft can still be operated within its safe envelope. In the medium speed range, the $\mathrm{TWR}_{\mathrm{req}}$
-increase leads to a noticeable reduction of SEP in Fig. 9b, which is in accordance with the expectations from literature [5, Reference Lampton and Valasek17, Reference Ranaudo, Mikkelsen, McKnight and Perkins26, Reference Whalen, Lee, Bragg and Ratvasky27] and reported occurrences in the past [3, 28–30].
$\mathrm{TWR}_{\mathrm{req}}$
-increase leads to a noticeable reduction of SEP in Fig. 9b, which is in accordance with the expectations from literature [5, Reference Lampton and Valasek17, Reference Ranaudo, Mikkelsen, McKnight and Perkins26, Reference Whalen, Lee, Bragg and Ratvasky27] and reported occurrences in the past [3, 28–30].
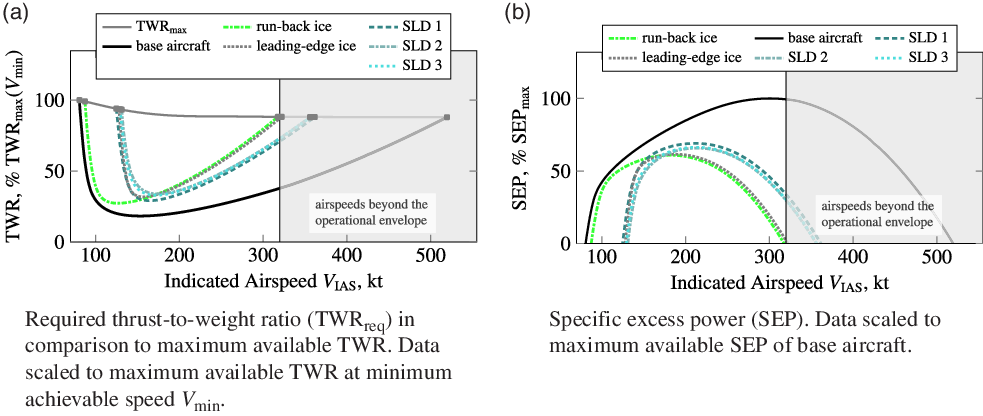
Figure 9. Limited flight performance under icing conditions: required thrust-to-weight ratio and specific excess power; exemplary results for base aircraft and the five different ice cases in 10,000ft altitude.
All in all, these results regarding the aircraft flight performance under icing influence meet the general expectations concerning the aircraft degradation. A final comparison of the icing-related parameter changes for all ice configurations reveal a homogeneous degrading effect. These results are not surprising and well known, since pilots and engineers have been familiar with the phenomenon of icing for decades.
5.0 Changes in flight dynamics
The aerodynamic degradation caused by icing has an influence on the aircraft’s dynamic behaviour. But, the specific effects on longitudinal and especially lateral motion are dependent on the magnitude of degradation and the location of the corresponding ice shape. To compare icing-induced changes of a certain ice configuration to another and to the basic aircraft it is suitable to analyse the characteristics of the dynamic modes. Therefore, the aircraft is trimmed in open loop and linearized at a certain flight condition, and the eigenvalues of the state matrix are calculated. The analysis of the corresponding eigenvectors allows mapping the roots to each dynamic mode. The location of roots in the complex plane further allows to reveal the icing-induced changes of the specific dynamic mode’s frequency and damping.
5.1 Evaluation of dynamic modes
As an example, the different aircraft configurations (without and with icing influence, flaps clean and gear up) are trimmed at 10,000ft with identical airspeed. To obtain results which are comparable to the previous flight performance analysis in Section 4 similar aircraft weight-and-balance configurations are used. Figure 10 illustrates the changes of roots in the complex plane for the Phenom 300 for all five investigated ice configurations and an indicated airspeed of 175kt. Similar plots of the changes of roots due to icing are given in Fig. 11 for an indicated airspeed of 200kt.
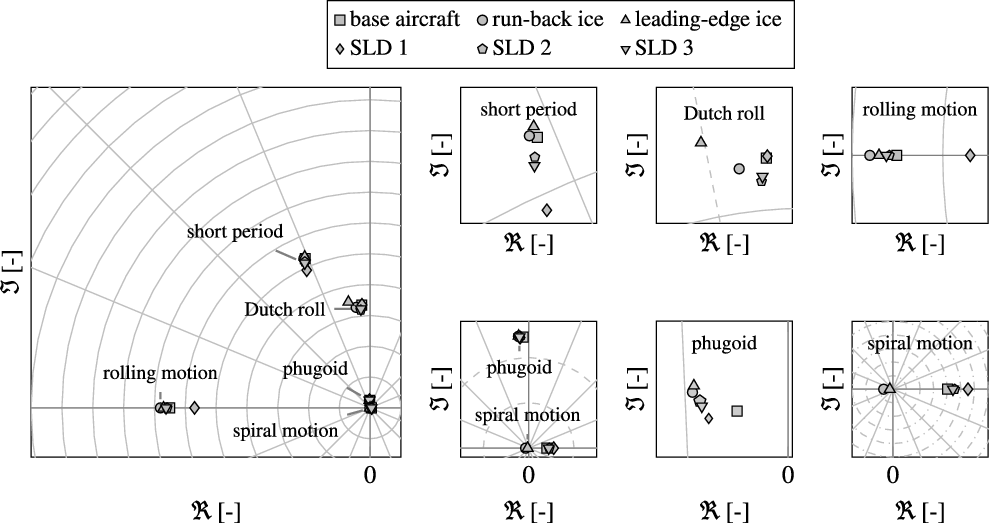
Figure 10. Ice-induced change of aircraft dynamics: exemplary locations of roots in complex plane for the aircraft model with and without icing; at 175kt in 10,000ft.
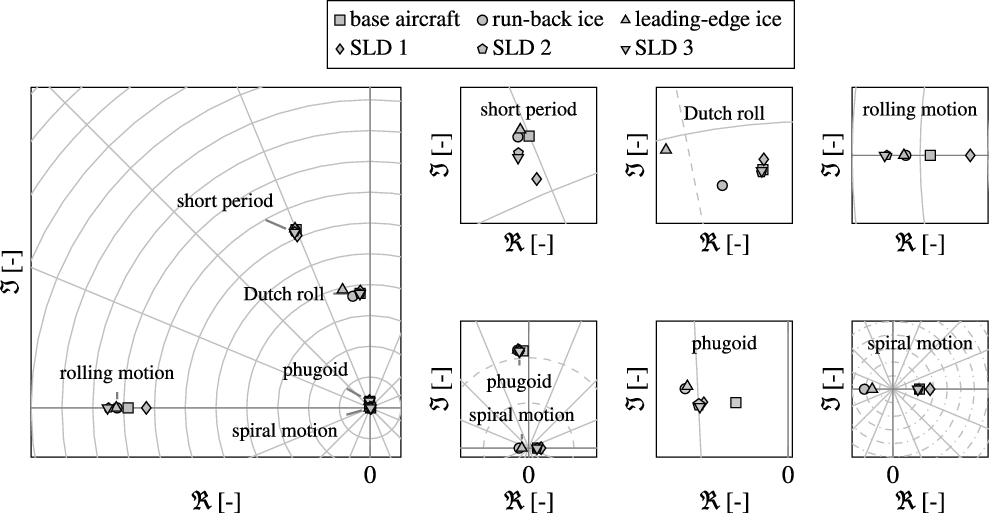
Figure 11. Ice-induced change of aircraft dynamics: exemplary locations of roots in complex plane for the aircraft model with and without icing; at 200kt in 10,000ft.
For the investigated ice configurations only a slight influence on the short period characteristics is noticeable. The App. C configurations (run-back and leading-edge ice) do not show a significant deterioration of the short period dynamics [Reference Deiler13, Reference Deiler31, Reference Deiler32] whereas the SLD-ice configurations reveal a slightly different behaviour. The SLD-ice configurations show a change of pitching characteristics compared to the classical App. C cases and the clean aircraft in terms of an increase of damping and decrease of natural frequency (see zoom plots in Figs. 10 and 11). The ridge-ice shapes representing the SLD-ice configurations change the pitching moment of the aircraft which is well represented by the models. It is further interesting that the low-risk SLD 1 configuration (with no ice shapes attached on the outer wing sections) show a more significant change of short period dynamics than the other two SLD-ice configurations tested. Note that the models are identified from the actually measured flight data with manoeuvres flown at flight conditions very close the ones presented for this evaluation herein. Therefore, there is a high confidence that the identified models will correctly represent the flight dynamics (see also results in Section 3). Nevertheless, the distinct cause of this finding cannot be revealed with the information about the complex flow on the iced wing available for this work.
The phugoid mode is significantly affected by all ice configurations. The zoom plots in Figs. 10 and 11 show that the corresponding roots of all ice configurations move away from the base aircraft’s eigenvalue similar for both airspeeds: the significant drag increase due to the ice shapes changes the aircraft’s lift-to-drag ratio and therefore the phugoid characteristics. The phugoid damping can be approximated by
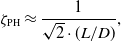 \begin{equation} \zeta_{\mathrm{PH}} \approx \frac{1}{\sqrt{2}\cdot(L/D)},\end{equation}
whereas the natural frequency is mainly airspeed dependent [Reference Yechout33].
The analysis further reveals interesting changes of lateral aircraft mode characteristics for the evaluated ice configurations. The mode characteristics changes are inhomogeneous for different SLD-ice configurations and also not similar to the results for the App. C cases (see also Refs. [Reference Deiler31, Reference Deiler32]). The rolling mode root moves away from the origin due to a higher aerodynamic damping for the App. C cases, which can be attributed to changes in lift characteristics: increase of lift curve slope at distinct angles of attack compared to the base aircraft (see Fig. 8). For the SLD-ice configurations the change of roll damping is less and different to the App. C cases: lift characteristics change in a different manner with a slight decrease of lift slope at lower angles of attack and a slight increase above the break point for SLD 2 and 3 as given in Section 3. Hence, the change of roll damping is dependent on airspeed for the incremental and nominal SLD-ice configuration: roll damping increase for lower angles of attack, roll damping decrease for higher angles of attack compared to the base aircraft. The SLD 1 configuration shows a decrease of roll damping for the investigated airspeeds.
The Dutch roll becomes better damped for the App. C configurations, which can be attributed to the local drag increase on the wing and the consequent increase of yaw damping $N_r$
:
$N_r$
:
 \begin{equation} \zeta_{\mathrm{DR}} \approx -\frac{1}{2}\frac{N_r}{N_\beta}.\end{equation}
For the SLD-ice configurations the dynamic analysis results show a different picture: the Dutch roll root locus changes although the roots for the SLD-ice configurations lie much closer to clean aircraft root than for the classical App. C cases. Figure 12 shows the Dutch roll root locus for indicated airspeeds between 170 and 260kt in 10,000ft. Although the drag increases also for all three SLD-ice configurations, the increase is not as strong as for the investigated App. C cases and consequently the ratio between the yaw damping $N_r$
and directional stability
$N_r$
and directional stability $N_\beta$
in Equation (9) is affected differently. During the identification, there was no additional increase of yaw damping
$N_\beta$
in Equation (9) is affected differently. During the identification, there was no additional increase of yaw damping $k_{C_{n{{\beta}}}}$
found as it was identified for the App. C cases [Reference Deiler13]. Moreover, as the Dutch roll motion is a coupling of yawing and rolling motion the changes in roll characteristics for the SLD-ice configuration further contribute to the visible change of the Dutch roll root locus.
$k_{C_{n{{\beta}}}}$
found as it was identified for the App. C cases [Reference Deiler13]. Moreover, as the Dutch roll motion is a coupling of yawing and rolling motion the changes in roll characteristics for the SLD-ice configuration further contribute to the visible change of the Dutch roll root locus.
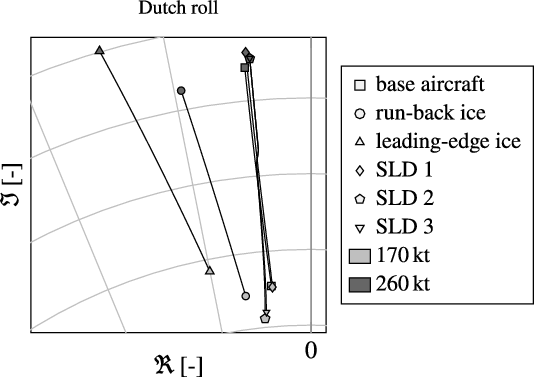
Figure 12. Ice-induced change of aircraft dynamics, Dutch roll root locus: exemplary change of location of roots in complex plane for the clean aircraft and five different ice configurations between 170 and 260kt indicated airspeed in 10,000ft.
Furthermore, the change of aircraft’s spiral mode shows a similar picture: it is stabilized for the App. C cases and the root locus is again changed differently for the SLD-ice configurations. The spiral mode is stable (see Ref. [Reference Yechout33] for further explanation) if
 \begin{equation} N_r L_\beta - N_\beta L_r > 0.\end{equation}
For the App. C cases the yaw damping $N_r$
is increased and
$N_r$
is increased and $L_\beta$
is enhanced due to the reduced sensitivity of the aircraft’s local lift to a local angle of attack change which consequently results in a reduced rolling moment/motion. Similar to the change of the Dutch roll mode the spiral mode change shows also an inhomogeneous result: the SLD 1 configuration reveals a destabilized spiral mode for all investigated airspeeds compared to the base aircraft whereas the change is airspeed dependent for the other two configurations. The spiral mode is dependent on the yawing and rolling characteristics similar to the Dutch roll for which reason the change of aerodynamic characteristics is the cause of the visible effects. There is no strong change of yaw damping as for the App. C cases and the roll characteristics are not affected sufficiently – and in a right manner – to e.g., stabilize the spiral mode. Nevertheless, the spiral mode change is not critical and does not affect safe aircraft operations although getting more unstable for the low-risk SLD-ice configuration.
$L_\beta$
is enhanced due to the reduced sensitivity of the aircraft’s local lift to a local angle of attack change which consequently results in a reduced rolling moment/motion. Similar to the change of the Dutch roll mode the spiral mode change shows also an inhomogeneous result: the SLD 1 configuration reveals a destabilized spiral mode for all investigated airspeeds compared to the base aircraft whereas the change is airspeed dependent for the other two configurations. The spiral mode is dependent on the yawing and rolling characteristics similar to the Dutch roll for which reason the change of aerodynamic characteristics is the cause of the visible effects. There is no strong change of yaw damping as for the App. C cases and the roll characteristics are not affected sufficiently – and in a right manner – to e.g., stabilize the spiral mode. Nevertheless, the spiral mode change is not critical and does not affect safe aircraft operations although getting more unstable for the low-risk SLD-ice configuration.
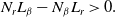
The combination of aircraft models and ice configurations show different results concerning the icing influence on the aircraft flight dynamics. Table 2 contains a comparison of the change of the aircraft characteristics. The phugoid shows a well comparable behaviour for the different ice configurations due to the strong effect on its damping by the drag increase respectively reduced lift-to-drag ratio. Although the effect on the short period damping $\zeta_{\mathrm{SP}}$
seems to be homogeneous, the change itself is very small and might be different for other aircraft as given in Refs. [Reference Deiler31, Reference Deiler32]. Moreover, the change of lateral motion characteristics is different for the five investigated ice configurations.
$\zeta_{\mathrm{SP}}$
seems to be homogeneous, the change itself is very small and might be different for other aircraft as given in Refs. [Reference Deiler31, Reference Deiler32]. Moreover, the change of lateral motion characteristics is different for the five investigated ice configurations.
Table 2. Comparison of relative aircraft dynamic mode change: Phenom 300 for different ice configurations ( $\Uparrow$
strong increase,
$\Uparrow$
strong increase, $\Downarrow$
strong decrease,
$\Downarrow$
strong decrease, $\uparrow$
increase,
$\uparrow$
increase, $\downarrow$
decrease,
$\downarrow$
decrease,
![]() change of root locus).
change of root locus).
Changing the flight condition to different altitudes gives similar results: the roots generally change according to the expected behaviour with the corresponding change of flight condition. All in all, the evaluation results reveal a direct correlation of icing-induced changes of aircraft dynamics on the specific aerodynamic degradation. Therefore, no general statement about the change of aircraft dynamics under icing influence can be made based on the presented results. Hence, it is further not possible to make a verification of existing methods to detect icing based on a changed aircraft dynamic behaviour [Reference Myers, Klyde and Magdaleno34–Reference Gingras, Barnhart, Ranuado, Martos, Ratvasky and Morelli37].
5.2 Handling qualities assessment
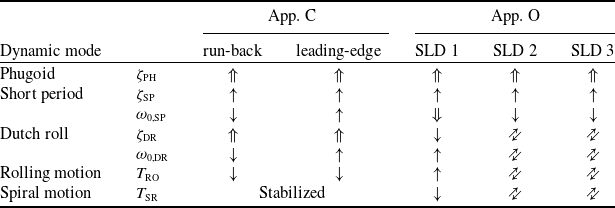
The change of aircraft dynamics under icing influence could lead to an alteration of handling qualities. Several numerical criteria given in “MIL-STD-1797A” (38) are directly based on the aircraft’s mode characteristics (damping, natural frequency, time constant). Therefore, the evaluation of these criteria delivers a first but limitedFootnote 1 impression of the icing influence on handling qualities. The Phenom 300 can be categorized as class II (light or medium transport) and the handling qualities are evaluated for category B and C operations. The evaluation reveals that the analysed icing-induced changes of aerodynamics have no significant – especially no significant negative – effect on the aircraft’s handling qualities. Table 3 gives an overview of the resulting handling qualities assessment based on the analysed numerical criteria for the eigenvalues of the linearised dynamic system.
Table 3. Comparison of handling qualities based on numerical criteria (class II, categories B & C): Phenom 300 for different ice configurations at 10,000ft and airspeeds between 170 and 260kt; all criteria for base aircraft are level 1

*Change to level 2 for low airspeeds.
In detail: the phugoid damping increases for all investigated ice configurations due to the higher drag. Therefore, level 1 handling qualities are not affected. Furthermore, the short period damping is not significantly changed for the different ice configurations and consequently the level 1 rating persists. The aircraft showed some interesting changes of the lateral motion characteristics for the different ice configurations (see Table 2). The effects on the rolling motion are different in terms of change of the time constant $T_{\mathrm{RO}}$
, but the numerical criterion evaluation does still result in a level 1 assessment for all analysed airspeeds. Figure 12 shows the change of Dutch roll root locus for SLD-ice which is different from the effects caused by the App. C ice shapes. To evaluate the corresponding influence on the aircraft’s handling qualities the Dutch roll damping and natural frequency are plotted on the numerical criteria map in Fig. 13 for 170 and 260kt indicated airspeed. In contrast to the App. C ice configurations, where the distance to the level 2 boundary is enlarged, the SLD-ice configurations are close to the base aircraft values and therefore the level 2 boundary. For low airspeeds this boundary is even crossed in case of the low-risk SLD-ice configuration. The spiral mode is also affected differently by the five ice configurations: it is stabilized by the App. C ice configurations, destabilized by the low-risk SLD-ice and shows a change of root locus for SLD 2 and 3. Hence the corresponding handling qualities criterion based on the time to double is not applied for the App. C configurations and the assessment results in level 1. Although the SLD-ice configurations change respectively destabilize the spiral mode characteristics a level 1 rating is still obtained. All in all, the handling qualities of the Phenom 300 do not show a significant or not-manageable degradation with all investigated ice cases.
$T_{\mathrm{RO}}$
, but the numerical criterion evaluation does still result in a level 1 assessment for all analysed airspeeds. Figure 12 shows the change of Dutch roll root locus for SLD-ice which is different from the effects caused by the App. C ice shapes. To evaluate the corresponding influence on the aircraft’s handling qualities the Dutch roll damping and natural frequency are plotted on the numerical criteria map in Fig. 13 for 170 and 260kt indicated airspeed. In contrast to the App. C ice configurations, where the distance to the level 2 boundary is enlarged, the SLD-ice configurations are close to the base aircraft values and therefore the level 2 boundary. For low airspeeds this boundary is even crossed in case of the low-risk SLD-ice configuration. The spiral mode is also affected differently by the five ice configurations: it is stabilized by the App. C ice configurations, destabilized by the low-risk SLD-ice and shows a change of root locus for SLD 2 and 3. Hence the corresponding handling qualities criterion based on the time to double is not applied for the App. C configurations and the assessment results in level 1. Although the SLD-ice configurations change respectively destabilize the spiral mode characteristics a level 1 rating is still obtained. All in all, the handling qualities of the Phenom 300 do not show a significant or not-manageable degradation with all investigated ice cases.
Figure 13. Ice-induced change of aircraft dynamics, Dutch roll handling qualities assessment: exemplary change of natural frequency and damping on the numerical criteria map for the clean aircraft and five different ice configurations in 10,000ft and indicated airspeeds of 170 and 260kt; without yaw damper.
6.0 Conclusion
The influence of icing on aircraft characteristics of a Phenom 300 was analysed and is presented in this paper. Different ice configurations – two classical App. C as well as three specific SLD-ice (App. O) configurations – were evaluated as a result of a joint DLR-Embraer research activity. Furthermore, the results of the model identification for these three different SLD-ice configurations are given herein. The individual model evaluation revealed that the effects of the SLD-ice configurations followed the expectations but of course differ from App. C influence. Nevertheless, the significant drag increase at even lower angles of attack showed the risk for aircraft operation resulting from such ice formations. A homogeneous icing-induced degradation of flight performance parameters was found, which is mainly related to the uniform change of lift-to-drag ratio with ice present on the aircraft: for all five investigated ice configurations a significant drag increase was found and the flight performance was consequently degraded as expected. In contrast, the analysis for the Phenom 300 revealed that the changes of flight dynamics are case-dependent. Especially for the SLD-ice configurations a change of root locus for the lateral motion eigenmodes was detected.
However, within this work no general conclusions on the effects on aircraft dynamics can be drawn for the following reasons: only one specific aircraft with a limited number of distinct ice configurations was evaluated in this study and the results are inconclusive; the changes of the aircraft’s dynamic modes are a consequence of the change of local aircraft aerodynamics which is different for different ice configurations. Therefore, no general conclusion on the icing-induced change of aircraft dynamics could be drawn. These new results complement existing work, which showed different results for other ice configurations on different aircraft (simulation models).
Nevertheless, the icing-related strong increase of drag and its further consequences could be found in aircraft performance and dynamic characteristics for the investigated App. C and SLD-ice configurations. Moreover, the exemplary evaluation of numerical handling qualities changes for the investigated flight conditions did not show any significant deterioration. The high-quality simulation models – especially for the investigated SLD-ice configurations – are contributing to the general understanding of the icing influence on aircraft characteristics. However, further information about the effects of additional ice configurations on different aircraft would be beneficial for future work.
Acknowledgments
The author wants to specially thank his colleagues Christian Raab and Per Ohme for their contributing work during the flight tests and data analysis. Moreover, the author wants to express his gratitude to the colleagues from Embraer, especially Celso Braga de Mendonca, for pushing forward the joint Embraer-DLR research activities on aircraft icing.


 Open access