


Abbreviations
- AC
-
Attitude command
- ACT/FHS
-
Active Control Technology/Flying Helicopter Simulator
- AVES
-
DLR’s Air Vehicle Simulator
- DLR
-
Deutsches Zentrum für Luft- und Raumfahrt
- DVE
-
Degraded visual environment
- HQR
-
Handling quality rating
- JND
-
Just-noticeable-difference
- MOU
-
US-German Memorandum of Understanding
- MTE
-
Mission Task Element (from ADS-33)
- PA ATR
-
US-German Project Agreement – Advanced Technologies for Rotorcraft
- PRF
-
Parametric risk field
- SAS
-
Stability augmentation system
1.0 Introduction
A consequence of the ability to hover and do vertical takeoffs and landings is that helicopters are operated close to the ground and thus close to obstacles. Picking up patients in urban areas, aerial work in the mountains or in the forest contain a high risk of collisions.
A review of the annual reports of German Federal Bureau of Aircraft Accident Investigation between 1999 and 2008 showed that 44 of 187 reported helicopter incidents (23.5%) included contact or collision with obstacles [1]. Potential causes are that the crews simply overlooked the obstacles because they were not in the field of view or not visible because of degraded visual conditions (DVE), or because the pilot did underestimate the distance or did not recognise that the helicopter was drifting towards the obstacle. To deal with this problem, technological solutions were developed that detect obstacles with helicopter mounted sensors [Reference Seidel, Schwartz and Kielhorn2] and visualise them on a display [Reference Waanders, Scheiblhofer, Qian, van Noort, Ziegler, Schubert and Koerber3]. Nevertheless, it is likely that such a display will be overlooked, especially near the ground and when there are obstacles, since the visual focus is then mainly outside the cockpit. Addressing other than only the human’s visual modality to warn about obstacles is already common in private cars: Here the distance is cued by an audio tone that is modulated in dependence of the distance allowing the driver to slow down or even stop the car before looking into a visual representation to see on which end of the car the obstacle was actually detected.
On the other hand, the audio channels of pilots can become overloaded, and unfortunately, they are often ignored in stressful situations. Several aircraft and helicopter accidents have occurred due to pilots disregarding repetitive audio warnings that were sounded off by the system or crew for a significant amount of time, sometimes lasting more than a minute.
Another possibility is to use the haptic modality through tactile cues either generated by a tactile vest [Reference Cheung and Bouak5] or belt [Reference Szoboszlay, Davis, Fujizawa, Minor, Osmon and Morford6] or by active inceptors to communicate distance and direction of the obstacle. Active inceptors contain a motor to actively generate the force-feel-characteristics of the inceptor instead of passive elements like spring and damper. But not only can these reproduce the characteristics of passive inceptors, but they can also be used to instantaneously modulate the forces and thus generate cues to warn or guide the pilot. Reference (Reference Taylor, Greenfield and Sahasrabudhe7) gives an overview over the general functionality of active inceptors and typical cueing types, like soft stop, hard stop, detents, gate or stick shaker.
Academia has demonstrated various applications of tactile cueing with active inceptors for helicopters in flight and shown the potential for tactile envelope protection, workload reduction and increase of situational awareness. Industry has adopted the technology and equipped test aircraft or already started new developments or programs to retrofit existing types with active inceptor systems.
DLR equipped their inflight simulator (Active Control Technology/Flying Helicopter Simulator, or ACT/FHS) with active sidesticks. Among the demonstrated applications were a tactile cue for sink rate protection to avoid Vortex Ring State [Reference Abildgaard8], as well as a tactile cue for torque protection [Reference Müllhäuser and Leißling9]. The US Army test helicopter RASCAL was equipped with active inceptors and used in various research and development projects, including risk reduction testing for the later UH60-M [Reference Fletcher10] and CH53-K [Reference Greenfield11] that is now equipped with active inceptors [Reference Spoldi, Faynberg, Egel and Cofelice12]. In a cooperative activity under the scope of former the US-German Memorandum of Understanding (MoU), now US-German Project Agreement (PA) could demonstrate the ability to increase the handling qualities by an adaptation of the force-feel-characteristics of active inceptors to different upper control modes in flight [Reference von Grünhagen, Müllhäuser, Höfinger and Lusardi13]. One of the latest achievements of the cooperation was a common test program of US Army with Deutsches Zentrum für Luft- und Raumfahrt (DLR) that compared different cues for a torque protection [Reference Müllhäuser and Lusardi14].
On the industry side Boeing had retrofit single prototypes based on a CH 47, an AH 64 and a H6, and demonstrated various tactile cueing functions, including a very simply prototype of an obstacle avoidance [Reference Enns, Dryfoos, Lukes, Hayes and Kashawlic15, Reference Enns, Segner and Dryfoos16]. A completely new development program with active inceptors is the Bell 525 [Reference Sung, Bothwell and Fortenbaugh17].
Although several helicopters are or will be equipped by industry with active inceptors to allow tactile cueing, obstacle avoidance was yet not mentioned as a ready developed functionality. This is assumingly because of the higher complexity with respect to required sensors and data processing, but probably also with respect to the higher difficulty in designing the right tactile cueing patterns. As these directly interfere with the controls when close to obstacles, when the risk of collision is high as well as the demand for precise controllability.
2.0 Previous work
Tactile cueing with active inceptors for obstacle avoidance was already proposed by TU Delft for remote operation of unmanned aerial vehicles [Reference Lam18], providing solutions, like the parametric risk field (PRF) as an approach to consider the speed or time-to-collision to identify relevant obstacles in the path of the helicopter. It was later adopted in prior work at DLR, see below [Reference Müllhäuser19]. Office national d’études et de recherches aérospatiales (ONERA) demonstrated a function that was based on a potential field and provided continuous forces that would deflect the stick away from the obstacle [Reference Binet and Rakotomamonjy20]. Both the ONERA approach and the DLR approach are discussed and compared in a common paper concluding with the need to further optimise the cueing patterns [Reference Rakotomamonjy, Binet and Müllhäuser21].
The haptic obstacle avoidance cueing system previously developed by DLR presented the relative distance and the direction to those obstacles identified to be the most dangerous by tactile cues acting on the active cyclic sidestick [Reference Müllhäuser19]. Two different cueing concepts were tested: A “force and stiffness” concept, inspired by [Reference Lam18], that generated continuous counter forces pointing from the obstacle towards the helicopter, that started when the distance between helicopter and obstacle was lower than a predefined minimum distance. It increased when the helicopter approached the obstacle. The other “ticker” concept instead generated short pulses that were becoming more intense and repeated with increasing frequency when the obstacle distance got closer. Pilots rated the “force and stiffness” concept as neutral, as it served as a warning on the one hand, but could impair the sensitivity of the controls on the other hand. The “ticker” concept was rated very useful and satisfying. Due to its pulse pattern, it was alarming and did not interfere with the controls. Nonetheless, some pilots stated that, although they could understand the direction or axis of the obstacle, they could not understand the orientation, i.e. if the obstacle was in front or behind the helicopter. That is why the following rules were defined to be considered in future optimisations:
-
Effectiveness: The cue must be detectable by the pilot in terms of intensity and direction. Human pilot’s sensation of forces differs with the frequency and the ability of active inceptors to correctly present the intended tactile cue is restricted.
-
Lack-of-nuisance: The cue shall disturb as less as possible and not more than acceptable. It must not lead to uncontrollability of the helicopter, i.e. provoke stick deflections that lead to dangerous changes of the helicopter flight state or uncontrollable pilot-induced oscillations.
-
A clear definition of the intention of the cue: avoidance-by-guidance or avoidance-by warning?
Cues with sustained force, such as soft stops, are therefore too invasive for most pilots in this critical flight phase. In addition, a sustained force generates a helicopter reaction, which is undesirable.
The idea of communicating direction by applying asymmetric vibrations on the stick was also analysed by Ref. (Reference Baelen, Ellerbroek, van Paassen, Abbink and Mulder4). The authors compared symmetric triangular vibration shapes with asymmetric sawtooth shapes in a laboratory environment and could show that the necessary, or just-noticeable-difference (JND), of the cueing amplitude is less for the asymmetric shape.
3.0 Ticker design
The ticker is a haptic cue in form of repetitive impulses as a force feedback communicated with an active sidestick on cyclic control. The cue is comparable to the acoustic indications of a parking aid for cars. With sidesticks, however, it is possible to additionally indicate a direction. Also, the ticker’s frequency can be used to show a distance. Contrary to the parking aid for cars, it is less convenient to use the ticker as a main input to control the distance, because it can be disrupting for the pilot. This will be discussed in more detail below.
The parameters of the base ticker are shown in Fig. 1, and they are referred to repeatedly in this paper. In blue the force signal is shown, that is commanded to the sidesticks to generate the basic ticks. This force corresponds to the force that the pilot would apply with his hand. With regard to the illustrated strength, there is a lower limit below which the direction of the cue is no longer perceived well enough. If the selected strength is too high, the ticker becomes annoying for the pilot. In addition, the resulting stick deflections can influence the movement of the helicopter. The same goes for large widths. However, if the ticker is pointing away from the obstacle, this may even be a desired behaviour. With a large width, the ticker feels clunky and less like a tick or impulse. If the width is too narrow, the hardware may not have enough time to overcome the stick’s inertia. Since the ticker is created by impulse commands, which results in very short-term dynamics, the behaviour and how it ultimately feels also depends on the individual sidestick and its system. For the examinations described below we used 32ms as a fixed width and only varied the strength. As a side note, the ticker was also tested with normal long pole sticks. However, the width had to be chosen so large to overcome the large inertia that it felt unacceptably clunky. Back to short pole sidesticks, the frequency parameter is less strictly limited in the meaningful range. It is usually set around the heartbeat of stressful situations. The pullback impulse is not mandatory, but it improves how the ticker feels for the user. It makes it sharper, clearer and less invasive. If the pullback is too large (>50% of strength), this often leads to confusion about the direction of the ticker. In that case the user does not know if the tick or the pullback indicated the direction.

Figure 1. Parameters of the ticker’s force command.
The direction of the ticker can be designed to point towards the obstacle like a person who indicates there is an obstacle; or it can point away from the obstacle like an autopilot or co-pilot that indicates or initiates an evasive direction. Here the away-from-the-obstacle indication was used, because it is expected to be more intuitive with the idea of an autopilot system in the mind. In addition, it corresponds with the control that the pilot must execute instead of contradicting it, thus a lower workload is expected. The pilots also had no problems with it in the simulator campaign described below.
In addition to the direction, the distance to the obstacle is also indicated to the pilot by using different frequencies for the ticker. As shown in Fig. 2, there are three hazard areas – green, orange and red – with its associated ticker frequencies. If the helicopter enters the orange area, which is 1.5 rotor diameters away from the obstacle, the ticker will be activated with 2Hz. The pilots or operators should be able to set the extent of the hazard areas individually. Different obstacle distances are to be expected based on the mission profile and depending on the individual pilot. As an example, in mountain rescue, they often fly closer than a quarter diameter to rock walls. In contrast, many other pilots rarely fly closer than two diameters to obstacles.

Figure 2. Design of the ticker’s distance indication with different frequencies.
A general design idea here is that the ticker only activates as a hazard warning when obstacles have been overlooked and the pilot has flown closer to obstacles than wanted. The extent of the hazard areas must be set accordingly narrow. The reason for this is that the ticker can be annoying and should therefore not be used as a main input to control the distance. The investigations for this disruption are described in more detail below. There is also a button on the stick with which the pilot can deactivate the ticker.
To briefly discuss different metrics to represent obstacle hazards, possible metrics include distance to the obstacle, time-to-collision and risk values, which are a combination of both distance and time. As described, the ticker indicates the distance between helicopter and obstacle. This works well for low speeds such as hovering. However, with higher drift rates, the time to collision is a better predictor of the hazard rating of an obstacle [Reference Padfield, Lee and Bradley22], and even better is a risk value as used in Ref. (Reference Müllhäuser19). The main issue with using time or risk values is that they are more difficult for pilots to interpret. When presented with a distance value, such as “the obstacle is half a rotor radius away,” the pilot has a clear mental image of where the obstacle is located. However, when presented with a time-to-collision value, such as “the obstacle is 4s away,” the pilot may have difficulty envisioning the exact location of the obstacle. The situation becomes even more complicated when using a risk value, such as “there is a 60% chance of collision,” which can make it even harder for the pilot to determine the location of the obstacle. In Ref. (Reference Müllhäuser19) a risk value was indicated and the pilots where often confused about the obstacle location. To keep it simple at first and to have a working system as a starting point, larger drift rates are not yet considered here. The ticker design allows for the possibility of switching from distance to time or risk values by simply redefining the extent of the hazard areas. While these changes were not explored in this study, they represent a possibility for future research.
Also note that the metric for selecting the most dangerous obstacle and the metric, which is displayed to the pilot, may be different. The ticker proposed here uses a risk value from Ref. (Reference Müllhäuser19) to select the most dangerous obstacle, and for this, the distance is indicated to the pilot.
Although obstacle collisions are a 3D problem, the focus here was on rotor strikes in the 2D rotor level and less about collisions with larger sink or climb rates.
A requirement for the ticker is consistency across all situations. The ticker should “always feel the same”. Problems with this can be caused by force-deflection characteristics with varying gradients, non-linear sections or other haptic cues. Very dynamic control inputs and how the pilot holds the stick can also lead to inconsistencies. Some pilots grip with the whole hand, whereas others only use the tips of index finger and thumb to hold the stick very loosely.
The behaviour of the sidestick hardware in response to the force command of the ticker, specifically the stick deflection, depends on multiple factors. These include (a) the individual short-term responses of the sidestick hardware, and (b) the interactions with the pilot’s hand. In order to make the force command parameters, which are heavily utilised in this study, more generalisable to other sidestick hardware, Fig. 3 displays some measured deflections for 3 and 10N ticker strength with hands off.

Figure 3. Stick deflection as a response to the force command of the ticker, with 3N strength on the left and 10N on the right. The variations of the deflections arise due to differences in the motor and measurements of the sidestick hardware.
The values of the final parameters for the ticker, are summarised here:
-
strength = 5N,
-
pullback = 30% of strength,
-
width = 32ms,
orange limit:
-
frequency = 2Hz
-
distance = 1 Ø from obstacle (!)
red limit:
-
frequency = 4Hz
-
distance = 0.5 Ø from obstacle
In terms of timeline, several basic tests were conducted initially, which are described in Sections 5, 6 and 7. Based on these basic tests, the final values listed here were determined. With these final ticker settings, the final system test was then conducted, which is explained in Section 8.
4.0 Pilot campaigns
The campaign was carried out in DLR’s Air Vehicle Simulator (AVES) with seven pilots. The AVES is a versatile research flight simulation facility providing a 6-degree-of-freedom hexapod motion system that enables the use of multiple cockpit layouts through a roll-on-roll-off system [Reference Duda, Gerlach, Advani and Potter23]. The dome projection provides a field of view of 240° × 95°. The Airbus EC135 cockpit has equal dimension and a similar instrumentation as DLR’s research helicopter ACT/FHS. Both the AVES and its helicopter cockpit are shown in Fig. 4.
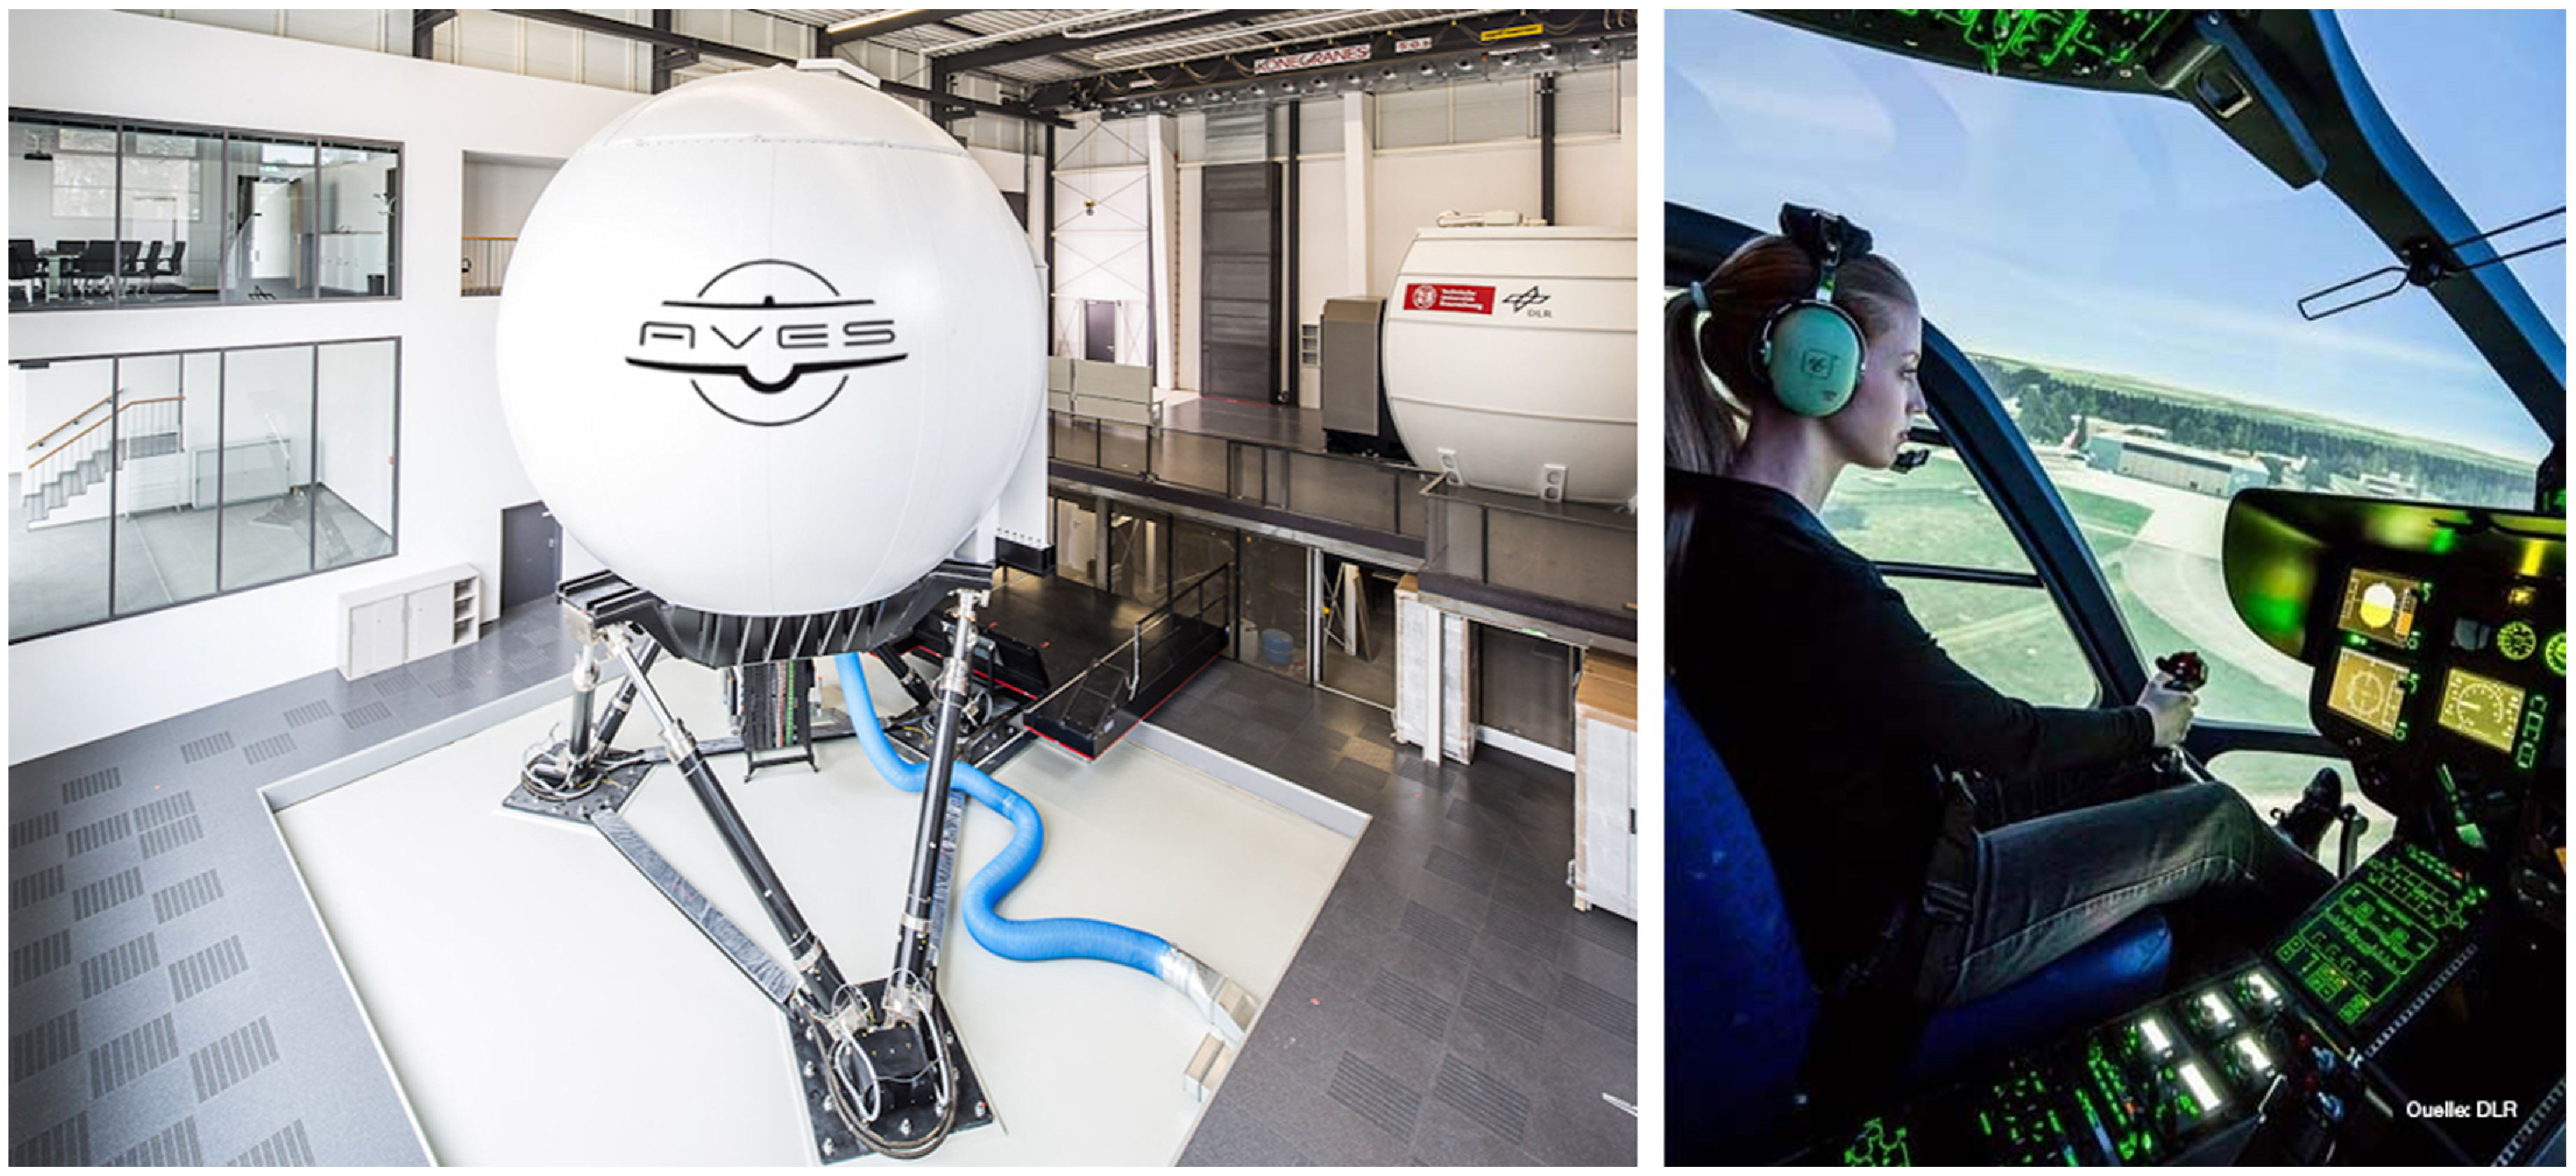
Figure 4. The AVES with its EC135 cockpit at DLR Braunschweig.
All seven participants were experienced, graduated test pilots, each with a background of 2,000–5,000 flight hours. The majority of them had an exclusively military background, with some coming from the German Bundeswehr and others from the US Army. All participating pilots had operational experience with transport and utility helicopters, and a subset of them also had experience with combat helicopters. Each pilot had flying experience in various operations, including search and rescue, mountain and maritime flights, visual flight rules during both day and night, instrument flight rules, night vision goggles and winch-and-load hook operations.
Two campaigns were carried out. The first one was done with four pilots and was more of a fundamental nature. With three experiments, it was examined (a) whether and how well the distance is displayed, (b) how disrupting the ticker is and (c) how well the direction is indicated. With the experience gained, the ticker design was adapted so that the status described above resulted. With these adaptations the second campaign was carried out with five pilots. This campaign was about system and stress tests with moving obstacles, which force potential collisions.
5.0 Distance test
To investigate the quality of the distance indication of the ticker design, simple tests were carried out. The pilot approached a known obstacle without seeing it, once by flying the helicopter backward and once with strong brownout conditions, which initially activates the ticker in the orange hazard area and subsequently in the red hazard area. In the red hazard area, the pilot should not approach the obstacle any further but instead hover briefly and then move back into the orange hazard area. After approaching the first obstacle, such as a building wall, the pilot proceeded to the next obstacle and repeated the procedure. This test was carried out in an artificially created “obstacle city” as shown in Ref. (Reference Müllhäuser19), with all kinds of common obstacles, like trees, house walls, rock walls, power lines, wind turbines, cranes, cars, street and traffic lights and so on. At the beginning, each of the four pilots also had the opportunity to fly around freely in the obstacle city and to play around with the system, in order to first familiarise themselves with the simulated helicopter and then with the ticker cue. Here, too, the indication of the distance was tested by the pilots, but in a freer manner.
In all these cases, the pilots were asked to discuss their current situation and communicate everything related to the ticker while flying. The most important statements were about which hazard area they were in and how confident they felt with the haptic information currently provided. In addition, they were asked afterwards whether it was always clear in which hazard area they were currently in.
As a result, all pilots consistently knew which distance-based hazard area (green, orange, red) they were in, leading to an increase in situational awareness. The distance test consisted of a 10-min free familiarisation period, followed by a 20-min test in which the pilots approached obstacles. Four pilots participated in the test, resulting in a total test time of 2h. Consequently, the false classification rate for hazard area identification was zero errors in 2h of testing.
Additionally, the distance feature was also indirectly tested in the second campaign, during the stress test with moving obstacles from Section 8. That test lasted for approximately 1h and were conducted with five pilots. As the primary task in that study was to avoid collisions under conditions of high workload, communication regarding the hazard area was sometimes incomplete. However, there were no errors in the communicated hazard areas, and none of the pilots reported any confusion or uncertainty about classifying the current hazard area during or after the experiment.
These results are consistent with the observation that it is very easy to distinguish between the 2Hz of the orange hazard area and the 4Hz of the red area. Of course, it is even easier to perceive whether the ticker is active or inactive.
6.0 Disruption test
From the pilot’s point of view, the ticker generates additional, disruptive forces on his most important control element, in one of the most critical situations of the mission. To test how disrupting and annoying the ticker is for the pilot, a hover MTE (Mission Task Element, from ADS-33 [24]) was used in combination with the active ticker. The manoeuver was repeated with different ticker settings in strength and frequency (see Fig. 1) to investigate their effects on the disturbance. This also includes the question of whether there are acceptable settings at all and which are the limits for unacceptable settings.
The pilot’s task in the hover MTE is to first fly towards the hover point with 6 to 10kn ground speed at an angle of 45°. There the helicopter should be stabilised and hovered for a certain time. In the vicinity, the pilot has visual cues about his deviation from the hover point. There are desired and adequate deviation limits in lateral, longitudinal, vertical and heading to evaluate the handling qualities. Following the manoeuver, the pilot evaluates the handling quality rating (HQR) using the Cooper-Harper Rating Scale [Reference Cooper and Harper25]. The ticker settings strength and frequency were varied for each manoeuver but not changed during a manoeuver. As a basis for comparison, manoeuvers without an active ticker (Strength = 0N) were also flown. There was no obstacle, so that the ticker was purely generic without any useful information. The direction of the ticker was changed similar to the second hand of a clock, but slightly faster and with random start direction. This test was carried out with attitude commands (AC) and a stability augmentation system (SAS) for yaw.
Each of the four pilots did the hover MTE ten times. For all resulting HQRs, a multinomial logistic regression was performed:
 \begin{align} B = \left[ {0.8;\,\,2.82;\,\,3.79;\,\,8.65;\,\,17.26; -\!0.965;\, -\!0.49} \right].\end{align}
The values in B represent the estimated coefficients for the predictor variables in the multinomial logistic regression model. Each coefficient corresponds to the effect of a one-unit increase in the corresponding predictor variable on the log-odds of the respective outcome category relative to the reference category. Positive coefficients indicate an increase in the log-odds of the outcome category, whereas negative coefficients indicate a decrease. These coefficients can be used to estimate the probabilities of the different HQRs given the strength and frequency of the ticker.
The result of the multinomial logistic regression is more intuitively presented in Fig. 5, which displays the probability distributions of HQRs 1–6 with respect to the strength of the ticker. Fig. 5 highlights the influence of ticker strength on the likelihood of each HQR. Without the ticker (Strength = 0), Level 1 handling qualities are almost always rated. In contrast, activating the ticker almost always degrades the hover to Level 2 handling qualities. The influence of ticker frequency is relatively small compared to its strength. This can be seen in Fig. 5, with the probability distributions for 2Hz (solid lines) and 4Hz (dashed lines). Increasing the frequency from 2 to 4Hz corresponds to a ticker that is approximately 1.5N stronger. This is evident from the −1.5N shifted distributions of the 4Hz frequencies (dashed lines). The ratio of the level lines of the same HQR probability between frequency and strength is approximately linear in the relevant frequency range of 1–4Hz. Assuming that the degradation of the HQR rating represents the extent to which the pilot is disturbed by the ticker during hover, Fig. 5 provides a nice overview of how much the ticker disrupts the pilot in this flight task. In general, from a disruption perspective, the ticker should be designed as weak as possible.

Figure 5. Regression of HQR for Hover MTE with active ticker. Ratings 4, 5 and 6 are Level 2 handling qualities.
One implication of the disturbance test is that the ticker is primarily used as a hazard warning for unnoticed obstacles or unwanted drift towards an obstacle. In contrast, the ticker should not be used as the main input to regulate the distance to the obstacle. In the latter case, the ticker would be active during the entire mission section (e.g. hover) and would be disruptive. In the first-mentioned case, on the other hand, the ticker is not active at all during normal operation, but only when critical limits are exceeded that were set by the pilot or operator. If the ticker is activated in this case, the pilot wants to fly out of the hazard area and thereby deactivates the disrupting ticker at the same time.
In the system test explained below, the ticker was used excessively as the just described hazard warning. Here, too, the pilots were asked how disrupting the ticker was on a scale from 0 to 6, where 0 = not at all and 6 = unacceptable. Two pilots rated 0 and the other three pilots rated 1. Therefore, the ticker with the warn-only-of-unnoticed-obstacles design is considered to be acceptable in terms of disturbance, because it would not be active in normal operation.
It should be noted that the significant degradation in HQR only applies to precise hover manoeuvers with a useless ticker. For other manoeuvers, such as providing a valuable warning followed by imprecise and arbitrary departure from a hazardous area, where the departure also deactivates the ticker, the ticker is hardly, if at all, disruptive.
Due to the relatively small number of pilots, regressions were also made individually for each pilot. The individual results are all very similar to each other and to Fig. 5. So, the variation between different pilots was small.
7.0 Direction test
This test was intended to examine how well the pilot recognises directions indicated by the sidestick. This was done by generating a tick every 2s with random direction, strength and pullback. Immediately after a tick, the pilot has the task of deflecting the sidestick in the same direction. A run ends after 2 min.
Figure 6 shows an example of a single tick with a random direction and with the subsequent sidestick deflection of the pilot. The error between the two directions is 13°. These errors are then plotted over their associated ticker strength and pullback value in Fig. 7. In cases in which the pilot did not deflect the sidestick, this was assessed as a misclassification and the error was set to 180°. In addition to the data points, box plots give an overview for the respective strength ranges.

Figure 6. Example of a single tick, with the pilot’s indication of the recognised direction and the error in between. The axis represents a top-down view on the sidestick. Since the “stick deflection” (in grey) can also curve in different directions, it is consolidated into one direction as the “pilot direction” (in blue). The grey line is mostly below the blue line in this example.

Figure 7. Error in direction perception of the ticker for different ticker strengths and pullbacks.
In Fig. 7 it can be seen how the errors become very large for small ticker strengths, below 3N. Also, in the range 3 to 6N there are already some misclassifications.
The top 6 outliers for ticker strengths over 4N have been recognised incorrectly to a critical extent and are therefore particularly interesting. It is important that three of these six fail classifications have a very high pullback value. Such high pullback values can lead to the direction being confused.
Figure 7 provides an overview of the range in which reasonable ticker settings lay. The next step is to determine the size of the errors for this reasonable range of settings, specifically the false classification rate and the accuracy of the direction cue. Reasonable ticker settings have a certain range of tolerance, but for the following analysis, it is assumed that the ticker strength is greater than 4N and the pullback is less than 50%. For this range of ticker settings, the failure rate is around 2%; whereby a failure is defined as an error greater than 90°. Furthermore, by excluding these falsely classified cases, the accuracy of the haptic direction indicator can be obtained by determining the mean and standard deviation of the remaining points, which is analogous to the presented box plots in Fig. 7. The resulting mean direction error is 15 degrees, with a standard deviation (of the absolute error) of 11 degrees. If considering errors in both positive and negative directions, the mean error is 0, and the standard deviation is 19 degrees. This level of accuracy is sufficient as the haptic direction indicator is mainly used to determine an avoidance path, for which in almost all cases, the rough direction is sufficient. Exploring the exact impact of the accuracy on the collision rate could be a possible research question for future studies.
In retrospect, only a handful of failure cases were observed, and therefore, obtaining additional data to examine the failure rate more precisely would be of interest. These data could possibly be collected using non-pilots. Based on their experience from the development work and other tests, the authors estimate a conservative failure rate of around 5%.
Apart from the three outliers mentioned in the upper right area, the influence of the pullback on the results is relatively small.
Methodically, this experiment was carried out without a real flight task and without additional workload. The pilots had to hover at any safe altitude, but with an automated controller, which stabilises the hover on its own. Therefore, the pilots could focus purely on the task. Furthermore, they knew that the next moment a tick is coming. In a real operation, however, the pilot would have awareness of his current situation, which could help him to recognise the direction of an indicated obstacle. In addition, there would be several consecutive ticks instead of a single one. Testing the ticker in a more realistic scenario is the subject of the next experiment.
8.0 System test with moving obstacles
This experiment is a system and stress test with moving obstacles. As previously explained, the ticker is primarily intended to warn of unnoticed obstacles. However, collisions with unnoticed obstacles occur extremely rarely in realistic scenarios, since everything possible is done to prevent these situations. Therefore, moving obstacles are used here to force potential collisions. At the same time, the equivalent situation in which the helicopter is drifting unnoticed towards an obstacle is also covered.
The moving obstacle is created by the experimenter at the push of a button without the pilot noticing. The direction of the obstacle is random. It is placed in the green hazard area, and it moves towards the helicopter at a speed of 0.5m/s. However, the obstacle does not chase the helicopter. Instead, the obstacle flies to where the helicopter was when the button was pressed. A collision would therefore not always occur because the helicopter could unintentionally drift away. Only one moving obstacle is active. The obstacles are invisible so that the pilot’s reaction is based on the haptic cues. In order to avoid conflicting information, the obstacles are more likely to arise on the sides or from behind. In addition, a strong brownout is used, which also restricts the view onto obstacles. To expand this experiment in the future, drones could be used as an obstacle to provide additional visual cues.
The scenario was flown in a circular forest clearing with a diameter of five rotor diameters, as shown in Fig. 8. The flight was conducted using attitude command (AC), strong brownout, and strong turbulence conditions. The pilots had the task of hovering 5m above the ground with a safe distance from all obstacles, and if necessary to evade and stabilise again. Climbing out of the forest clearing was only allowed in an emergency, because there was an imaginary danger that the helicopter would be shot at. Overall, the workload was high, to the extent that the pilots found it often difficult to stabilise the hover at all. The exaggerated turbulence forced constant pilot inputs, and the brownout made visibility extremely poor and sometimes completely removed it for a short time.

Figure 8. Simulator scene of the forest clearing.

Figure 9. Histogram of direction errors for the scenario with only the moving obstacle. The pilots reported the direction of the obstacle as a clock-face direction while flying the experiment. The first bin represents all cases where the reported direction was the closest clock-face direction to the actual direction. The second bin represents the second closest clock-face direction, and so on.
The turbulence model is a CETI model for hover conditions with high turbulence settings, as published in Ref. (Reference Seher-Weiß and Jones26). The brownout model used is published in Ref. (Reference Gerlach27). To provide a rough idea of the dynamic brownout effect used, consider the following scenario. In the centre of the forest clearing, with a 20-m distance from the trees and a hover height of 5m during the experiment, visual references from the trees were still visible about 80% of the time, albeit somewhat faintly.
The experiment was divided into three parts: (1) only forest clearing obstacles; (2) only moving obstacles; and (3) both forest clearing and moving obstacles. In the first part, the pilots were able to familiarise themselves with the ticker and play around with it freely for 15min. With the moving obstacles in the other parts, the pilots ideally had to evade and then stabilise the helicopter again into hover. This sequence of hover, moving obstacle, evade, stabilise and hover again was repeated about 50 times with a pilot. At the third part, the pilots often found themselves in a situation where the moving obstacle forced an evasion to the trees. But then the trees got indicated by the ticker, which resulted in rapid changes of the directional cue. Figs. 10, 11, 12 and 13 provide exemplary illustrations of the typical interactions between obstacles, the ticker, the pilot, and the helicopter in this experiment.

Figure 10. Typical example of a moving obstacle approaching the helicopter illustrated as top-down view. After the ticker activates (yellow dots), the pilot moves the helicopter away from the obstacle.

Figure 11. In this example, the helicopter experiences an unwanted backwards drift towards the obstacle when the ticker activates, causing it to swiftly switch from the orange to the red hazard area after 3s. The pilot responds by reducing the helicopter’s drift and then flying in the opposite direction to exit the hazard area.

Figure 12. Illustration of a scenario with multiple obstacles, including trees in the forest clearing (blue +), and a moving obstacle approaching the helicopters initial position (red +). The helicopter initially drifted unintentionally backwards towards the trees away from the moving obstacle. This activated the ticker, and the pilot steered away from the trees, but directly towards the moving obstacle, of which the pilot had no knowledge so far. The ticker switched quite fast to the red hazard area, and the pilot steered the helicopter in the opposite direction again, avoiding the moving obstacle while moving backwards. However, as there were also trees in that direction, the pilot verbally indicated that at this point, he would manoeuver upwards to leave the hazard area.

Figure 13. A second typical example involves the moving obstacle pushing the helicopter towards trees while the pilot is moving back and forth. The initial avoidance manoeuver brings the helicopter too close to the trees (about 2m), so the pilot subsequently increases the distance and eventually ascends upwards to exit the hazard area.
The pilots knew in this experiment that an obstacle could approach, so the surprise effect was minimal. The exact point in time, the direction and the trajectory of the obstacle, however, were unclear. Since the surprise effect is very strong in reality, it would be interesting to also investigate this in the future.
Due to turbulence, brownout and low controller support, the helicopter usually drifted unintentionally, to a varying extent. On the one hand, drift was an issue because it caused the helicopter to miss obstacles and created fewer collision situations. However, the experimental setup aimed to have as many collision situations as possible to collect the data about it. On the other hand, drift was helpful in creating different initial scenarios, such as drifting towards or away from the obstacle or moving sideways. Therefore, the unintentional and sometimes unnoticed drift was also beneficial for the experiment. Ultimately, the ticker is intended to warn of unnoticed drift towards the obstacle, which is equivalent to an object moving towards the helicopter.
While flying the experiment, the pilots reported the clock-face direction of the obstacle. The errors between the actual direction and the reported direction are shown in Fig. 9 as a histogram. These data are complete for the scenario where only the moving obstacle was present. In the case of multiple critical obstacles, the workload was too high, and the direction changes of the ticker were too fast, resulting in the pilots frequently being unable to report the directions.
As a result, the pilots correctly reported the direction of the obstacle 95% of the time when only the moving obstacle was present. “Correctly reporting the direction” means that one of the four closest clock-face directions were reported, which corresponds to a maximal error of 60 degrees.
If there were additional obstacles from the forest clearing, the pilots were frequently “trapped” between the moving obstacle and the trees, resulting in their decision to manoeuver upwards to exit the dangerous situation. In these cases, the ticker was less clear due to frequent direction changes, and the pilots reported being less confident in their interpretation of the direction afterwards. However, due to the pilots manoeuvering upwards to exit the hazard area when “trapped”, collisions occurred in less than rate would have been 85%.
The ticker was rated as very intuitive with almost no training required. Most often, confusion arose when several obstacles from opposite directions became critical. In almost all cases in which the pilots said while flying that they are currently not sure where the obstacle is, they still steered away from the obstacles intuitively. However, in a final system there should be a visual display where the pilots can double check their haptic impressions.
Overall, the feedback from the pilots was very positive, for example: “This is the best haptic feedback I have ever tested.” All five pilots said they would use such a system.
Finally, the pilots were asked to extrapolate the ticker onto real situations based on their operational experience: “How many accidents of this kind could be prevented with this ticker.” Here, “this kind” means perfect obstacle data is available, the drift speed is low and excluding vertical collision. First of all, everyone said it was difficult to answer; but, the reduction of accidents is ultimately the goal of the ticker and therefore the most important measure for evaluation. It is, therefore, a good idea to carry out estimates, and who is better suited to do this than the pilots themselves. However, as result all five pilots independently estimated 75% of these collisions could be prevented with this ticker. Since all pilots responded with the same answer independently, this response suggests that it may be generalisable to other pilots. Nonetheless, it is important to recognise that this estimation has limitations and may not provide a complete or accurate representation of the situation; it only provides an indication.
9.0 Conclusion and outlook
The ticker is implemented with force pulses on a sidestick to warn against unnoticed obstacles in order to reduce the risk of collisions. The current hazard area (green, orange, red) are indicated by activating the ticker and through different frequencies. Due to the ticker, the pilots always knew which hazard area they were in during the experiments.
The ticker is annoying and worsens the handling qualities in the hover task from satisfactory to adequate. In normal operation, the function is therefore not active, but only in an emergency as a hazard warning, but not as a main input to control the distance. As a warning cue the ticker was evaluated as non-disturbing. A regression model was determined for the handling quality rating of the pilots at the hover task. It sums up the result and allows predictions for different settings of the ticker.
The sidestick deflection on its pitch and roll axis indicates the direction away from the most dangerous obstacle. The influence of the ticker strength (and pullback) on the quality of direction recognition was determined experimentally. If the tick impulse is less than 3N $ \cdot $
35ms, the misclassification rates became extremely high. A useful range for the tick impulse is thus something from 4N
$ \cdot $
35ms, the misclassification rates became extremely high. A useful range for the tick impulse is thus something from 4N $ \cdot $
35ms to 7N
$ \cdot $
35ms to 7N $ \cdot $
35ms, whereby the upper limit is determined by the disturbance. Above 4N almost all errors were below 50° and the fail rate was 2%. The standard deviation of the directional error for the correctly classified directions was 19°.
$ \cdot $
35ms, whereby the upper limit is determined by the disturbance. Above 4N almost all errors were below 50° and the fail rate was 2%. The standard deviation of the directional error for the correctly classified directions was 19°.
The method of using moving obstacles to force collisions and thus test the ticker has been proven in this study. Of around 200 collisions that would have happened without the ticker, only 8 actually happened in the simulator experiment. The pilots rated the ticker as very intuitive and almost no training was necessary. Furthermore, all pilots rated the current warning que design as not disruptive. They would all use it and also recommend it to other pilots.
The pilots also noted that an additional visual display could be helpful for them, to double check their haptic impression. A visual display of the ticker with a head-worn display, however, is the subject of further work. This also includes a 3D audio display and investigations into how these systems work together and what advantages different multimodal combinations have.
No pilot made a comment indicating that the direction used (away from the obstacle) was disruptive, confusing or otherwise problematic. This reinforces the authors’ decision to design the ticker to indicate the direction away from the obstacle.
Many of the studies presented here are of a fundamental nature, so that further work can be based on them. One example is comparative studies with other definitions of the hazard area, such as time-to-collision or risk values. A closer look at full 3D movement with vertical collisions in combination with the ticker is also part of further work.
The ticker settings determined here can vary slightly with other sidestick models, because the impulse inputs mean that the stick’s short-term reactions are particularly important.
To sum it up, with the last question of the pilot survey, all five pilots independently estimated 75% of accidents of this kind could be prevented with this ticker.
Acknowledgements
This research was undertaken within the US-GERMAN Project Agreement – Advanced Technologies for Rotorcraft (PA ATR) that is funded by the US and German Ministries of Defence. The authors would like to thank the participating pilots and BAAINBw and WTD61 and the AVES simulator team for their support.


 Open access