

This chapter examines what leads someone to cultivate a reputation as an advocate for the disadvantaged in the US Senate. In particular, it will investigate how certain institutional differences between the House of Representatives and the Senate can affect how members make representational choices. Compared to members of the House, senators have considerably more individual power, and do not face the same pressures to specialize. Senators serve on more committees, are markedly less restrained in their ability to speak on the floor, and are more likely to be a pivotal vote on any given piece of legislation. This expectation that senators will be involved in a broader range of issues allows for considerably more flexibility when crafting their legislative reputations, and makes it less likely that they will solely prioritize advocating for any one particular group. Chapter 3 demonstrated this difference in the incidence of senators with a reputation for primary or secondary advocacy on behalf of disadvantaged groups relative to members of the House in Figure 3.7.
However, it is important to bear in mind that while this increased pressure on senators to diversify their representative activities may make them less likely to craft reputations as primary or secondary advocates for the disadvantaged, they are actually slightly more likely on average to serve as disadvantaged-group advocates at least at a superficial level (as seen in Figure 3.7). Thus, even if senators tend to build reputations as superficial advocates rather than primary or secondary advocates (though these higher levels of advocacy on behalf of disadvantaged groups do still exist within the upper chamber), it remains necessary to determine if the same factors driving the decisions behind reputation formation in the House are also at work in the Senate. The sections to follow take on that task, and work to untangle the ways in which different pressures and institutional constraints can alter the reputation building calculus for members within the two legislative chambers.
In this chapter, I will analyze the impact of the size of a disadvantaged group and the ambient temperature toward a disadvantaged group on reputation formation in the Senate, and compare the effects with what was seen in the House of Representatives. Next, I will introduce and evaluate three alternative hypotheses that take into account senator electoral security and the advocacy environment within the Senate to determine their impact on senator reputation. Following that, I will investigate how the reputations of descriptive representatives in the Senate differ from nondescriptive representatives, and highlight the implications of these differences, particularly relative to descriptive representatives in the House. Finally, I return to the concept of the advocacy window, and discuss how well the concept characterizes the decision to build a reputation as a disadvantaged-group advocate in the US Senate.
5.1 Constituency Characteristics: Group Size and Ambient Temperature
As with the previous chapter, explaining what drives members to cultivate a reputation as an advocate for disadvantaged groups starts with an exploration of the role of group size and group ambient temperature within a state. These variables are a useful place to start this discussion about when and why senators build legislative reputations because a basic understanding of how a democracy should work provides clear expectations. Assuming that, just as in the House, members of the Senate care both about getting reelected and about representing their constituents, one would expect that as the size of a group increases within a state, members will devote more of their efforts to working on their behalf, and be more likely to craft a reputation as a group advocate. Similarly, the more warmly the average person in a district feels toward a group, it seems reasonable to expect that a senator would be even more likely to form a reputation as a defender of that group. In the remainder of this section, I briefly review the operationalization of these two key variables. Next, I utilize models equivalent to those used to explain the formation of member reputations in the House to evaluate the extent to which these expectations hold in the US Senate.
5.1.1 Group Size
For the analysis to follow, group size is measured using the Census counts for the percentage of group members within a state. Racial and ethnic minorities within a state are determined using the percentage of individuals who do not identify as non-Hispanic whites, veterans are the percent of the civilian population that served in any branch of the armed services, seniors are the percentage of individuals over the age of sixty-five, and immigrants are the percentage of residents of a state who are foreign born. The percentage of women in a state is a straightforward count, and the percentage of poor residents are those whose household income is below the federal poverty line. The Census has never asked the sexual orientation or gender identity of respondents, and thus operationalizing the percentage of LGBTQ individuals within a state requires a proxy. Because of this lack of data, I follow the lead of prior researchers and use the percentage of same-sex households within a state to approximate the size of the state LGBTQ population (e.g., Reference WawroWarshaw and Rodden, 2012; Reference HawkesworthHansen and Treul, 2015).Footnote 1
5.1.2 Ambient Temperature
The ambient temperature variable is a unique measure that conceptualizes feeling thermometer scores as a way of determining the average level of hostility or favorability toward a group within a state or district, which was introduced in detail in the previous chapter. For this analysis exploring reputation formation in the Senate, I followed the same procedure from Chapter 4 to estimate the state ambient temperature toward a group (as opposed to congressional district ambient temperature). This was done using multilevel regression and poststratification on the feeling thermometer questions from the ANES time series data, aggregated by decade.Footnote 2 Table 5.1 shows a summary of the state estimates generated for each of the disadvantaged groups analyzed.
Table 5.1 Summary of estimates for state feeling thermometer ratings by group
| Group | N | Mean | Std. Dev. | Min. | Max. |
|---|---|---|---|---|---|
| Seniors | 400 | 78.63 | 2.34 | 72.20 | 85.10 |
| Veterans | 500 | 72.37 | 3.82 | 65.23 | 82.34 |
| Poor | 500 | 68.76 | 2.89 | 61.24 | 77.63 |
| Women | 500 | 55.42 | 3.18 | 46.84 | 63.19 |
| Immigrants | 500 | 40.75 | 7.63 | 26.59 | 57.61 |
| Racial/Ethnic Minorities | 500 | 65.38 | 2.90 | 59.31 | 71.58 |
| LGBTQ | 500 | 46.25 | 7.75 | 21.85 | 64.57 |
5.2 Reputations for Disadvantaged-Group Advocacy in the US Senate
Chapter 3 demonstrated that legislative reputations for disadvantaged-group advocacy are common to both the House and the Senate, with over 50 percent of senators possessing a reputation for at least superficial advocacy of a disadvantaged group. Table 5.2 shows the total number of senators sampled with a reputation for disadvantaged-group advocacy, separated by group and level of advocacy.Footnote 3 Compared to their counterparts in the House, senators are less likely to have reputations as primary or secondary disadvantaged-group advocates, tending to opt for superficial advocacy instead. Given the markedly smaller number of senators compared to members of the House – 100 to 435 – these differences in the level of advocacy a senator or member of the House are known for have important consequences for selecting the most appropriate means of modeling those reputations.
Table 5.2 Number of senators with reputations as advocates for disadvantaged groups in the 103rd, 105th, 108th, 110th, and 113th Congress
| Seniors | Veterans | Women | Poor | Immigrants | Racial/Ethnic Minorities | LGBTQ | |
|---|---|---|---|---|---|---|---|
| Non | 426 | 458 | 430 | 386 | 470 | 476 | 487 |
| Superficial | 52 | 29 | 44 | 76 | 23 | 16 | 9 |
| Secondary | 17 | 13 | 18 | 36 | 6 | 7 | 3 |
| Primary | 5 | 0 | 8 | 2 | 1 | 1 | 1 |
| Total Advocates | 74 | 42 | 70 | 114 | 30 | 24 | 13 |
Table 5.2 shows that, for five out of the seven groups under evaluation, there are fewer than two senators with a primary reputation as group advocates. Because the raw numbers for the highest category are so small, in the analysis to follow, I combine reputations for primary and secondary advocacy into a single category, to create a three-category ordered dependent variable. Using this combined top category allows for better estimation of the impact of relevant explanatory variables on the likelihood that a member will have a reputation for superficial advocacy or higher.Footnote 4
5.3 Group Size, Ambient Temperature, and Reputation Formation in the Senate
Chapter 4 showed that both the size of a disadvantaged group and feelings toward that group play an important role in the legislative reputations that members of the House choose to form. Particularly for groups that are generally considered to be less deserving of government assistance, both group size and ambient temperature had a positive, significant effect on the likelihood that a member would form a reputation as a group advocate when evaluated independently. In this section, I examine the relationship between these variables and member reputation for the US Senate.
To gain a more nuanced understanding of how these explanatory variables impact member reputation and to account for any violations of the parallel regression assumption, I utilize generalized ordered logistic regression models.Footnote 5 Because member reputation has been collapsed into a three-category ordinal variable, each generalized ordered logistic regression model will produce two sets of estimated coefficients, referred to in each instance as Model 0 and Model 1. Model 0 shows the estimated effects of each independent variable on the likelihood that a senator will have a reputation for some level of advocacy relative to non-advocacy, while Model 1’s coefficients represent the estimated effect that a variable has on the likelihood of having a reputation for primary or secondary advocacy, relative to non-advocacy or superficial advocacy. The results of these models are displayed in Tables 5.3–5.6.
5.3.1 Veterans and Seniors
The coefficients of the models evaluating how group size and ambient temperature affect the likelihood of senators building reputations as advocates of veterans and seniors are shown in Table 5.3. For these groups, with a high level of perceived deservingness of government assistance, the forces driving senators to foster reputations as advocates look relatively similar to those that were at work in the House, but with some important exceptions. The percentage of veterans and seniors in a state has a positive and statistically significant impact on whether or not a senator will have some form of reputation as a group advocate, but not on the choice to expand that reputation as a primary or secondary advocate.
This distinction is not unexpected – senators have a great deal of leeway in determining how to allocate their legislative efforts. State demographics do push senators to try to dedicate at least a small portion of their legislative reputation to serving veterans and seniors, but other factors are responsible for determining which senators choose to signal that advocating for these groups are their top priority. Many Florida senators, for instance, despite representing the state with the highest percentage of individuals over the age of sixty-five, have a superficial reputation as an advocate for seniors. People like former Sen. Bob Graham (D-FL), most known for his work on anti-crime legislation (particularly his support for the death penalty), also made sure that he could be described as a supporter of seniors by pushing for prescription drug coverage for Medicare recipients.
State ambient temperature, on the other hand, does not have a statistically significant effect on a senator’s reputation as an advocate of either of these two groups. Because veterans and seniors are broadly considered to be deserving of government assistance, it is not expected that small state-by-state variations in how these groups are viewed would have a large effect on reputation. Senators can be reasonably confident that advocating for these groups will not negatively impact them, and may even provide a boost in how they are regarded by their constituents.
Table 5.3 Group size, ambient temperature, and member reputation for advocacy for veterans and seniors
| Veterans | Seniors | |||||||||||
|---|---|---|---|---|---|---|---|---|---|---|---|---|
| 0 | 1 | 0 | 1 | 0 | 1 | 0 | 1 | 0 | 1 | 0 | 1 | |
| Group Size | 0.325 | 0.461 | – | – | 0.320 | 0.417 | 0.025 | 0.022 | – | – | 0.023 | −0.049 |
| 0.00 | 0.04 | 0.00 | 0.11 | 0.04 | 0.32 | 0.05 | 0.72 | |||||
| Ambient Temperature | – | – | −0.061 | 0.014 | −0.051 | 0.014 | – | – | −0.018 | −0.016 | −0.009 | 0.012 |
| 0.29 | 0.93 | 0.36 | 0.93 | 0.81 | 0.89 | 0.90 | 0.93 | |||||
| Republican | −0.677 | −1.150 | −0.650 | −0.920 | −0.696 | −0.932 | −0.735 | −1.770 | −0.723 | −2.067 | −0.764 | −2.092 |
| 0.11 | 0.08 | 0.12 | 0.37 | 0.09 | 0.36 | 0.04 | 0.01 | 0.05 | 0.01 | 0.04 | 0.01 | |
| Dem Pres Vote | 0.004 | −0.044 | −0.007 | −0.045 | 0.004 | −0.031 | −0.004 | 0.018 | −0.012 | 0.012 | −0.011 | 0.012 |
| 0.89 | 0.48 | 0.78 | 0.43 | 0.88 | 0.62 | 0.84 | 0.52 | 0.52 | 0.74 | 0.56 | 0.75 | |
| South | 0.052 | 0.465 | −0.052 | 0.279 | 0.056 | 0.364 | 0.114 | 0.563 | −0.050 | 0.475 | −0.009 | 0.559 |
| 0.90 | 0.48 | 0.90 | 0.72 | 0.90 | 0.64 | 0.73 | 0.26 | 0.89 | 0.42 | 0.98 | 0.31 | |
| 1990s | −0.660 | −0.131 | −0.610 | 0.438 | −0.956 | −0.110 | −0.210 | −0.420 | −0.477 | −0.564 | −0.543 | −0.498 |
| 0.18 | 0.91 | 0.31 | 0.73 | 0.12 | 0.95 | 0.42 | 0.31 | 0.07 | 0.20 | 0.04 | 0.31 | |
| 2000s | −1.785 | −1.929 | −0.953 | −0.403 | −1.994 | −1.796 | – | – | – | – | – | – |
| 0.00 | 0.05 | 0.06 | 0.56 | 0.00 | 0.14 | |||||||
| First Term | −1.073 | −1.059 | −1.105 | −0.655 | −0.467 | −0.524 | ||||||
| 0.10 | 0.10 | 0.08 | 0.13 | 0.30 | 0.25 | |||||||
| Constant | −5.227 | −5.980 | 3.419 | −2.117 | −1.280 | −7.197 | −1.470 | −3.754 | 1.012 | −1.690 | 0.018 | −3.258 |
| 0.01 | 0.20 | 0.39 | 0.87 | 0.75 | 0.58 | 0.12 | 0.02 | 0.86 | 0.86 | 1.00 | 0.74 | |
| N | 500 | 500 | 500 | 500 | 400 | 400 | ||||||
| Wald’s Chi2 | 41.5 | 26.1 | 46.9 | 21.6 | 19.7 | 23.7 | ||||||
| Pseudo-R2 | 0.0599 | 0.0419 | 0.0638 | 0.0445 | 0.0488 | 0.0563 | ||||||
As was true for members of the House, neither partisan lean nor location in the South has a significant impact on a senator’s choice to build a reputation as a veteran or senior advocate. Democrats are more likely to have a reputation as an advocate for seniors, but, unlike in the House, the choice to become a veterans’ advocate in the Senate is nonpartisan. One last noteworthy but not unexpected difference between the House and the Senate comes in considering the gap in reputation building between first-termers and returning incumbents. In the House, members in their first term simply have not spent long enough within the institution to have amassed the over-time pattern of behavior that is required to build a legislative reputation. Senators, with a full six years before they must face the voters again, have considerably more time in their first term to craft a reputation that reflects their legislative priorities. This also speaks to the erosion of the norm of apprenticeship highlighted by Matthews in The Folkways of the Senate – being in their first term does not deter a senator in the contemporary Congress from taking action to establish their legislative reputation (Reference SmoothSinclair, 1989).
5.3.2 LGBTQ and Racial/Ethnic Minorities
Table 5.4 displays the impact of group size and ambient temperature on the likelihood of a senator having a reputation for advocacy on behalf of the LGBTQ community and racial/ethnic minorities. These models indicate that neither group size nor ambient temperature has a statistically significant impact on a senator’s choice to cultivate a reputation as an LGBTQ or racial/ethnic minority advocate. This is a crucial and telling distinction from what was seen in the previous chapter.
Of all of the disadvantaged groups being studied here, the LGBTQ community and racial/ethnic minorities are generally considered to be the least deserving of government assistance by the country at large, particularly for the time period investigated here. In the House, both the percentage of racial/ethnic minorities and same-sex households and the general feelings toward those groups within a district had a positive and significant effect on the likelihood that a member would form a reputation as an advocate. This connection is critical, because it demonstrates that if a group is large enough in a district, even if they are unpopular nationally, their member of Congress is still more likely to actively represent them within the legislature, and that this is further enhanced by improvements in district ambient temperature.
Table 5.4 Group size, ambient temperature, and member reputation for advocacy for racial/ethnic minorities and the LGBTQ community
| LGBTQ | Race/Ethnicity | ||||||||
|---|---|---|---|---|---|---|---|---|---|
| logit | logit | logit | 0 | 1 | 0 | 1 | 0 | 1 | |
| Group Size | −0.989 | – | −1.824 | 0.009 | −0.001 | – | – | 0.009 | −0.010 |
| 0.75 | 0.46 | 0.48 | 0.97 | 0.52 | 0.70 | ||||
| Ambient Temperature | – | 0.047 | 0.055 | – | – | 0.081 | 0.076 | 0.070 | 0.303 |
| 0.63 | 0.56 | 0.45 | 0.75 | 0.50 | 0.52 | ||||
| Republican | −0.604 | −0.624 | −0.618 | 0.410 | −0.372 | 0.397 | −0.393 | 0.429 | −0.153 |
| 0.55 | 0.55 | 0.55 | 0.41 | 0.60 | 0.41 | 0.69 | 0.38 | 0.85 | |
| Dem Pres Vote | 0.074 | 0.065 | 0.083 | 0.037 | 0.059 | 0.044 | 0.040 | 0.039 | 0.060 |
| 0.10 | 0.08 | 0.04 | 0.25 | 0.44 | 0.14 | 0.42 | 0.23 | 0.43 | |
| South | −0.640 | −0.627 | −0.669 | −1.232 | −14.895 | −1.142 | −15.884 | −1.222 | −16.160 |
| 0.54 | 0.54 | 0.51 | 0.03 | 0.00 | 0.06 | 0.00 | 0.03 | 0.00 | |
| 1990s | −0.823 | 0.282 | −0.380 | 2.172 | 16.927 | 2.558 | 18.091 | 2.559 | 19.664 |
| 0.60 | 0.87 | 0.86 | 0.04 | 0.00 | 0.03 | 0.00 | 0.03 | 0.00 | |
| 2000s | −0.662 | −0.269 | −0.203 | 1.417 | 15.263 | 1.712 | 16.149 | 1.701 | 17.235 |
| 0.40 | 0.84 | 0.88 | 0.19 | 0.00 | 0.14 | 0.00 | 0.14 | 0.00 | |
| First Term | −0.933 | −0.997 | −0.943 | −1.031 | −1.057 | −1.013 | |||
| 0.34 | 0.30 | 0.32 | 0.14 | 0.14 | 0.15 | ||||
| Constant | −6.168 | −8.869 | −9.261 | −6.559 | −22.812 | −12.288 | −27.651 | −11.536 | −44.894 |
| 0.01 | 0.17 | 0.13 | 0.00 | 0.00 | 0.11 | 0.10 | 0.13 | 0.18 | |
| N | 500 | 500 | 500 | 500 | 500 | 500 | |||
| Wald’s Chi2 | 8.4 | 9.2 | 8.8 | 2,049.2 | 1,105.8 | 1,055.6 | |||
| Pseudo-R2 | 0.0814 | 0.0882 | 0.0912 | 0.1176 | 0.1155 | 0.1230 | |||
In the Senate, however, there appears to be a disconnect when it comes to this expected dyadic relationship. An example of this can be seen in the senators from Rhode Island and Vermont. These two northeastern states consistently have one of the highest percentages of same-sex couples, but none of their senators included in the sample have cultivated a reputation as an advocate for LGBTQ individuals. Clearly, other factors outside of the status of the group within a state are the driving force behind a senator’s choice to form a legislative reputation as an advocate for racial/ethnic minorities and the LGBTQ community. Because of this, these groups cannot feel confident that the likelihood of being represented by their own senator will increase even if their numbers or the state-wide feelings toward them as a group go up.
The insignificant impact of partisanship on the chance that a senator will decide to form a reputation as an advocate for these groups is also striking. Even in a context where few senators take on this responsibility and choose to advocate for racial/ethnic minorities or LGBTQ people, Republicans are not significantly more or less likely to take this leap, once the partisan leaning of a state is taken into account. The more Democratic a state is, the more likely it is that a senator will form some portion of their reputation around advocating for the LGBTQ community. Notably, however, the partisan leaning of a state does not impact the choice of a senator to cultivate a reputation as a racial/ethnic minority advocate. Given how closely tied racial/ethnic minorities are to the Democratic coalition, particularly for Black Americans, this relationship (or lack thereof) is stunning. One of the biggest factors influencing if a senator will have a reputation as an advocate for racial/ethnic minorities is instead whether or not they are representing a state in the South. The decade fixed effects also have a particularly strong and significant effect on reputation formation, indicating that the likelihood of having a reputation as an advocate for racial/ethnic minorities in the senate was considerably larger in the 1990s and 2000s than in the 2010s.
5.3.3 Immigrants and the Poor
The models demonstrating the effect of ambient temperature and group size on the likelihood of a senator having a reputation as a group advocate for immigrants and the poor are shown in Table 5.5. Here, too, there are some important similarities and differences in the effects of these variables on senators relative to members of the House. Both the percentage of immigrants and the poor in a district and the group ambient temperature, when evaluated independently, had a significant impact on whether or not a member of the House would craft a reputation as a group advocate. In the Senate, these patterns are different.
Table 5.5 Group size, ambient temperature, and member reputation for advocacy for immigrants and the poor
| Immigrants | Poor | |||||||||||
|---|---|---|---|---|---|---|---|---|---|---|---|---|
| 0 | 1 | 0 | 1 | 0 | 1 | 0 | 1 | 0 | 1 | 0 | 1 | |
| Group Size | 0.104 | −0.076 | – | – | 0.104 | −0.075 | 0.008 | 0.034 | – | – | −0.006 | −0.001 |
| 0.00 | 0.69 | 0.01 | 0.69 | 0.85 | 0.53 | 0.90 | 0.99 | |||||
| Ambient Temperature | – | – | 0.029 | 0.010 | 0.001 | −0.017 | – | – | −0.068 | −0.155 | −0.070 | −0.155 |
| 0.61 | 0.95 | 0.99 | 0.92 | 0.23 | 0.11 | 0.24 | 0.12 | |||||
| Republican | 1.014 | 1.927 | 0.790 | 1.455 | 1.014 | 2.018 | −0.518 | −0.917 | −0.533 | −0.915 | −0.535 | −0.913 |
| 0.03 | 0.09 | 0.07 | 0.16 | 0.03 | 0.16 | 0.08 | 0.03 | 0.07 | 0.03 | 0.07 | 0.03 | |
| Dem Pres Vote | 0.014 | 0.074 | 0.043 | 0.058 | 0.014 | 0.076 | 0.058 | 0.038 | 0.057 | 0.035 | 0.057 | 0.034 |
| 0.58 | 0.20 | 0.07 | 0.03 | 0.59 | 0.18 | 0.02 | 0.25 | 0.01 | 0.26 | 0.02 | 0.28 | |
| South | −0.474 | −16.656 | −0.576 | −14.331 | −0.474 | −16.652 | −0.277 | −1.095 | −0.268 | −0.956 | −0.251 | −0.962 |
| 0.40 | 0.00 | 0.30 | 0.00 | 0.40 | 0.00 | 0.39 | 0.10 | 0.42 | 0.11 | 0.43 | 0.13 | |
| 1990s | −0.136 | −2.751 | −0.233 | −1.166 | −0.122 | −3.079 | 0.465 | 1.258 | 0.220 | 0.665 | 0.206 | 0.662 |
| 0.77 | 0.25 | 0.79 | 0.66 | 0.89 | 0.40 | 0.16 | 0.02 | 0.56 | 0.31 | 0.61 | 0.31 | |
| 2000s | −0.587 | −0.996 | −0.700 | −1.119 | −0.587 | −1.056 | 0.536 | 0.986 | 0.226 | 0.235 | 0.203 | 0.229 |
| 0.15 | 0.26 | 0.08 | 0.28 | 0.15 | 0.35 | 0.12 | 0.12 | 0.57 | 0.76 | 0.65 | 0.76 | |
| First Term | −0.459 | −0.578 | −0.460 | −0.316 | −0.329 | −0.331 | ||||||
| 0.47 | 0.35 | 0.47 | 0.28 | 0.27 | 0.28 | |||||||
| Constant | −4.373 | −6.529 | −6.008 | −7.201 | −4.428 | −5.837 | −4.409 | −5.213 | 0.657 | 6.461 | 0.901 | 6.486 |
| 0.00 | 0.00 | 0.07 | 0.34 | 0.19 | 0.47 | 0.01 | 0.01 | 0.88 | 0.37 | 0.85 | 0.39 | |
| N | 500 | 500 | 500 | 500 | 500 | 500 | ||||||
| Wald’s Chi2 | 988.6 | 1,429.7 | 1,030.9 | 34.6 | 38.1 | 38.6 | ||||||
| Pseudo-R2 | 0.0903 | 0.0536 | 0.0904 | 0.0681 | 0.0743 | 0.0743 | ||||||
As seen in Table 5.5, the percentage of immigrants in a state has a significant and positive effect on whether or not a senator makes the choice to integrate some level of advocacy on behalf of immigrants into their legislative reputation. Reputations for primary or secondary advocacy, though, are not significantly affected by group size within a state. This is similar to the effects observed for senators with reputations as advocates of veterans or seniors – superficial advocacy is significantly driven by state demographics, while higher levels of advocacy in the Senate are encouraged by other factors. Variation in ambient temperature toward immigrants across states, however, consistently does not have a significant effect, even when examined in isolation.
When it comes to senators with reputations for advocating on behalf of the poor, neither group size nor ambient temperature is a significant driver of their decision. This insignificance of group size to the choice to craft a reputation as an advocate of the poor is important. It indicates, much like with advocates of racial/ethnic minorities and the LGBTQ community, that there is a disconnect between senators’ reputation-building choices and what some of the basic principles of a representational democracy would predict for groups that are not generally considered to be highly deserving of government assistance.
The effects of senators’ party affiliation on reputations for advocacy on behalf of immigrants and the poor have several layers of nuance. While Republican senators are less likely to form a reputation as a primary or secondary advocate for the poor, the effects of partisanship dissipate when the bar for advocacy for those in poverty is lowered to a superficial level. Conversely, partisanship has an insignificant effect on the formation of primary or secondary reputations as immigrant advocates, but Republican senators are actually more likely to cultivate at least a superficial reputation around advocating for immigrants. This likely speaks to the fact that, in the 1990s and much of the 2000s, issues pertaining to immigrants were considerably more bipartisan than is the case in the 115th Congress. Republicans like Connie Mack (FL) and Alan Simpson (WY) exemplified this – while advocating for immigrants was never their primary concern in the Senate, they did serve as consistent, supportive voices for a compassionate approach. This was still seen into the 2010s as well, as with the former junior and senior Republican senators from Arizona, Jeff Flake and John McCain.
Senators from the South are significantly less likely to form a primary or secondary reputation as advocates for immigrants, but geography does not have a significant effect on the formation of a reputation that at least reaches the level of superficial advocacy. However, southern senators are no more or less likely to have a reputation as an advocate for the poor, which makes another departure from the dynamics of reputation formation in the House. Democratic-leaning states are more likely to produce senators that openly work to benefit the poor at some level of advocacy, though not primary/secondary advocates in particular, while partisan leaning does not have a significant effect on immigrant advocacy.
5.3.4 Women
Table 5.6 shows the estimated effects of group size and ambient temperature on the likelihood that a senator will have a reputation for advocating on behalf of women. The initial pattern that stands out in these models is that the percentage of women in a state has a significant and negative relationship with senator reputation as a women’s advocate. As discussed in the previous chapter, women are the only disadvantaged group being considered here whose representation should not be dependent upon group size, as women consistently make up roughly 50 percent of the population in each state (give or take about two percentage points). This means that in every state, women are a strong electoral force, and the very small variation across states should have no effect on that. Thus, the fact that the percentage of women in a state has not just a significant relationship, but a significant negative relationship, is at first perplexing. After a more in-depth examination, however, it can be seen that this result is masking other dynamics at work.
Table 5.6 Group size, ambient temperature, and member reputation for advocacy for women
| Women | ||||||
|---|---|---|---|---|---|---|
| 0 | 1 | 0 | 1 | 0 | 1 | |
| Group Size | −0.115 | −0.715 | – | – | −0.114 | −0.739 |
| 0.69 | 0.05 | 0.70 | 0.04 | |||
| Ambient Temperature | – | – | 0.004 | 0.037 | −0.003 | 0.049 |
| 0.95 | 0.55 | 0.96 | 0.52 | |||
| Republican | −0.273 | −0.479 | −0.305 | −0.429 | −0.276 | −0.396 |
| 0.48 | 0.49 | 0.43 | 0.50 | 0.48 | 0.58 | |
| Dem Pres Vote | 0.059 | 0.129 | 0.054 | 0.098 | 0.059 | 0.136 |
| 0.02 | 0.00 | 0.03 | 0.01 | 0.02 | 0.00 | |
| South | −0.364 | 1.364 | −0.439 | 0.632 | −0.362 | 1.320 |
| 0.48 | 0.21 | 0.37 | 0.49 | 0.48 | 0.23 | |
| 1990s | 0.839 | 0.513 | 0.819 | 0.064 | 0.839 | 0.523 |
| 0.02 | 0.41 | 0.03 | 0.90 | 0.02 | 0.39 | |
| 2000s | 0.159 | 0.096 | 0.138 | −0.450 | 0.171 | −0.143 |
| 0.65 | 0.86 | 0.68 | 0.25 | 0.63 | 0.77 | |
| First Term | −0.690 | −0.694 | −0.693 | |||
| 0.05 | 0.05 | 0.05 | ||||
| Constant | 0.796 | 26.104 | −4.916 | −9.995 | 0.889 | 24.312 |
| 0.96 | 0.15 | 0.17 | 0.02 | 0.96 | 0.18 | |
| N | 500 | 500 | 500 | |||
| Wald’s Chi2 | 39.7 | 49.6 | 42.1 | |||
| Pseudo-R2 | 0.093 | 0.0825 | 0.0946 | |||
In Table 5.6, group size essentially serves as an inadvertent proxy for descriptive representation. The states with the highest percentage of women also happen to be states that tend not to elect women to serve in the Senate. The three states with the highest concentration of women – Mississippi, Alabama, and Pennsylvania – have never elected a woman to the US Senate, as of the 2018 elections.Footnote 6 Out of the ten states included in this analysis with the highest percentage of women, six of them have never elected a woman to serve in the Senate, and one of them, Massachusetts, only elected a woman to the Senate for the first time in 2012.Footnote 7
Though untangling the tantalizing riddle of why this negative relationship between the percentage of women in a state and actually electing women to the Senate exists is beyond the scope of this project, its effects are clearly visible. In the Senate, just as in the House, female representatives are markedly and significantly more likely to build reputations as women’s advocates than male representatives. Once the presence of female senators is taken into account, the coefficient showing the estimated effects of group size loses significance. Though the precise effects of descriptive representation across groups are examined in more detail later in the chapter, models retaining all present variables while also adding an indicator that denotes the senator’s gender can be found in Table C-1 of the Appendix.
Table 5.6 also reveals that, once again, ambient temperature does not have a statistically significant effect on a senator’s choice to build a reputation as a women’s advocate. Given that there is very little variation across states and districts in their gender composition, ambient temperature toward women within a state would be expected to play an even larger role in a senator’s decision-making when seeking to build their legislative reputations than might be the case for other disadvantaged groups. This is, in fact, the dynamic that is present in the House, where an increase in the ambient temperature makes members more likely to have a reputation as a women’s advocate, even when considered jointly with group size. But this is not the case in the Senate, where, as with the other groups analyzed here, reputations as women’s advocates are driven by factors outside of the ambient temperature toward women within the state. Additionally, a senator’s party affiliation does not have a significant effect on member reputation, but senators representing states that lean Democratic are more likely to have a reputation as an advocate for women.
5.3.5 Discussion
In each of these cases, when considering those who build reputations as advocates for any one of these disadvantaged groups, the nonsignificant impact of state ambient temperature on those decisions is an important and noteworthy departure from what was seen in the House. The initial hypotheses laid out in Chapter 2 indicate that in states that feel more warmly toward a particular disadvantaged group, a senator should be more likely to incorporate advocacy on that group’s behalf into their legislative reputation, but this is not what these results show. Instead, ambient temperature has no appreciable effect on the reputation a senator chooses to build.
The disparity in effects of group size on senator reputation between the House and the Senate are also critically important for understanding the different forces driving the representation of disadvantaged groups in each of the two chambers. In the House, the size of a disadvantaged group in a district had a significant effect on member reputation for nearly every group (except for women). Thus, in the House, there is a strong dyadic relationship between how many of a representative’s constituents belong to a disadvantaged group, and the intentional effort put in on their behalf.
In the Senate, however, the strength of this dyad appears to rest upon how generally deserving of government assistance a group is broadly perceived to be. For the two groups included in the analysis with a high level of perceived deservingness – veterans and seniors – and one of the groups with a more mixed level of perceived deservingness – immigrants – their size within a state has an important impact on the likelihood that a senator will build a reputation as an advocate on their behalf. But for racial/ethnic minorities, the LGBTQ community, and the poor – groups with generally mixed or lower levels of perceived deservingness of government assistance – variations in the size of their group within a state do not have a significant effect on a member’s decision to include advocating for them in their legislative reputation.
So far, this analysis has demonstrated that while the reputations that members choose to build as disadvantaged-group advocates in the House are significantly impacted by the size and ambient temperature toward that group, senators tend to rely on other factors to make their decisions, especially for groups that are not broadly considered to be deserving of government assistance. But if group size and ambient temperature tend not to be significant elements in the decision to craft a reputation as an advocate for disadvantaged groups, what is? Next, I turn to the institutional and electoral factors that contribute to reputation formation in the US Senate.
5.4 Alternative Drivers of Reputation Formation in the US Senate
In this section, I pursue three alternative explanations to explore the extent to which certain elements of the institutional and electoral environment can take precedence over constituency-specific factors for senators making decisions about whether or not to actively include disadvantaged groups within their legislative reputations. Specifically, I will evaluate the following hypotheses: the electoral insecurity hypothesis, the in-state differentiation hypothesis, and the collective amplification hypothesis.Footnote 8
5.4.1 Electoral Insecurity
Almost as a rule, most members of Congress tend to be fairly risk-averse – they do not want to take actions that have a high likelihood of jeopardizing their chance at being reelected – but this caution is even stronger within the Senate (Reference SellersSchiller, 2000b). On average, incumbent senators have a lower probability of getting reelected than an incumbent member of the House (Reference Kessler and KrehbielJacobson, 2013). Senators are not oblivious to this fact – they know that they are more likely to face a competitive race during their next election cycle, and they make strategic choices in their legislative behavior to try to position themselves as well as possible for that fight. Given this risk-avoidant environment, it is possible that only the senators who perceive themselves to have the safest seats are willing to take the risk of focusing at least some of their legislative reputation around serving disadvantaged groups – especially those that are considered to be less deserving of government assistance.
The electoral insecurity hypothesis builds off of these assumptions, and predicts that the closer a senator’s previous election, the less likely they are to want to be known as an advocate of the disadvantaged. Senators who survived a “close call” in their last election spend more time looking over their shoulder, and may be less inclined to take the chance of alienating constituents in their state who are less comfortable with members of a given disadvantaged group. In the next section, I evaluate this hypothesis by examining the impact of a senator’s state vote share in their most recent election on the likelihood that they will have chosen to build a reputation as a disadvantaged-group advocate.
5.4.2 In-State Differentiation
In her book Partners and Rivals, Wendy Schiller argues that senators seek to differentiate themselves from their same-state counterparts by crafting intentionally distinctive reputations for subject-matter expertise within the institution. She demonstrates this both through case studies and by comparing the legislative similarity of same-state senators across measures such as roll-call votes, committee assignments, and bill cosponsorship, and finds that the legislative pairings of these same-state senators rarely mirror one another. By this logic, same-state senators should also be less likely to form legislative reputations as advocates for the same disadvantaged group. However, the degree to which Schiller’s argument can be expanded to shed additional light on a senator’s decision to include disadvantaged-group advocacy within their legislative reputation is an open question.
During the over two decades that they served together, California senators Barbara Boxer (D) and Diane Feinstein (D) could be an example of this sort of differentiation when it comes to disadvantaged-group advocacy. During her time in the House, Sen. Boxer had already begun developing a reputation as a primary advocate for women, which she continued when she reached the Senate. But despite being a woman herself and coming from a state where such advocacy was clearly not discouraged, Sen. Feinstein developed a legislative reputation that did not include prominent advocacy for women’s issues. This is what would be expected if same-state senators intentionally chose not to develop the same advocacy reputations. As a counter example, though, citizens of Ohio were represented in the 1990s by two senators, John Glenn (D) and Howard Metzenbaum (D), who both had developed legislative reputations as superficial advocates for women.
A primary reason for this uncertainty is that disadvantaged-group advocacy is not always a conventional subset of subject-matter expertise in the way that crime, environmental, or tax policy would be. Disadvantaged-group advocacy can span a huge range of issues and subject areas, and is only occasionally tethered to a singular committee or area of expertise. For example, during a conversation about how members think about their advocacy, one staffer for a member with a reputation for women’s advocacy outright rejected the notion that there exists a single set of “women’s issues.” They explained that women’s concerns are instead incorporated into the broader subject matter that the member focuses on, such as labor or healthcare. Former Kansas Sen. Bob Dole (R) provides another illustration of the distinction between group advocacy and subject-matter expertise. Before his time as a Republican presidential candidate or Senate Majority Leader, Bob Dole was known as an expert on agriculture policy. But within that context, he also built a reputation as an advocate for people in poverty through his concentrated efforts to expand the food stamp program.
Given these important differences between policy-domain expertise and group advocacy, it is worth investigating whether or not a senator takes into account their same-state counterpart’s reputation for disadvantaged-group advocacy when making decisions about their own reputation, in the same way that they would take into account their counterpart’s subject-matter specialization. The in-state differentiation hypothesis predicts that senators with a same-state counterpart who has integrated advocacy for a given disadvantaged group into their legislative reputation will be less likely to have one themselves. To evaluate this hypothesis, I include in the analysis a categorical variable denoting the type of reputation for group advocacy held by a senator’s same-state counterpart.Footnote 9
5.4.3 Collective Amplification
Toddlers, teenagers, and frankly most human beings, are more likely to do something if the people around them are doing it as well. This is particularly true for actions that are potentially risky. A child who has never leapt off a diving board is more likely to take the plunge after watching their friends jump and emerge from the water unscathed. Drivers on the interstate are more likely to exceed the speed limit if the cars around them are speeding as well. So too it may be for senators facing the decision to cultivate a legislative reputation as a disadvantaged-group advocate.
The collective amplification hypothesis predicts that as the total number of disadvantaged-group advocates within the institution increases, other senators will be more likely to incorporate at least a superficial level of advocacy for that group into their legislative reputations as well. As more senators feel comfortable crafting a reputation that includes advocating for a given disadvantaged group, perceptions of the risk associated with including such advocacy into one’s legislative reputation may decline, leading others to then do the same. To evaluate this hypothesis, I add a variable for the number of other senators with a reputation for advocacy for each disadvantaged group in a given Congress.
5.5 Institutional Environment, Electoral History, and Reputation Formation
In this section, the three alternative hypotheses described above are tested by incorporating the relevant variables into the same generalized ordered logistic regression models utilized above. To evaluate the impact of these additional variables on senator reputation relative to that of the constituency variables previously described, I estimate these effects of the institutional and electoral variables both independently and all together. The results of these models are displayed in Tables 5.7–5.10.
5.5.1 Veterans and Seniors
Table 5.7 displays the effects of these additional institutional and electoral variables on the likelihood of a senator having a reputation as an advocate for seniors and veterans. For both of these cases, a senator’s vote share from their most recent election does not significantly impact their choice to serve as an advocate. This implies that, at least when advocacy for these groups is considered, the electoral insecurity hypothesis is not supported. However, because veterans and seniors are generally considered to be broadly deserving of government assistance, it is not unexpected that the negative effects of electoral insecurity would be attenuated – the positive regard with which these groups are held creates a relatively low-risk advocacy environment. Of the two variables representing the advocacy environment within the institution, only one has a statistically significant relationship with senator reputation. As the number of senators who incorporate advocacy for veterans and seniors increases, there is an increased likelihood that other senators will follow suit, at least at the superficial advocacy level. Having a same-state counterpart with a reputation as an advocate for veterans and seniors, however, has no effect on reputation formation. These models provide support for the collective amplification hypothesis, but not the same-state differentiation hypothesis. This evidence of the significance of the institutional advocacy context provides an important layer to understanding when and why senators form reputations as advocates for veterans and seniors, but it also does not eliminate the importance of the district constituency effects – group size remains a significant driver of the choice to incorporate this advocacy at least at a superficial level.
Table 5.7 Institutional, electoral, and constituency effects on member reputation for advocacy for veterans and seniors
| Veterans | Seniors | |||||||||||
|---|---|---|---|---|---|---|---|---|---|---|---|---|
| 0 | 1 | 0 | 1 | 0 | 1 | 0 | 1 | 0 | 1 | 0 | 1 | |
| Total Advocates | 0.167 | −0.083 | – | – | 0.167 | −0.222 | 0.061 | −0.003 | – | – | 0.062 | −0.017 |
| 0.05 | 0.64 | 0.05 | 0.56 | 0.03 | 0.96 | 0.03 | 0.77 | |||||
| Same State Advocate | 0.163 | −0.697 | – | – | 0.190 | −0.585 | 0.086 | −0.394 | – | – | 0.103 | −0.505 |
| 0.64 | 0.31 | 0.59 | 0.43 | 0.67 | 0.30 | 0.60 | 0.24 | |||||
| Previous Vote Share | – | – | −0.015 | −0.029 | −0.011 | −0.063 | – | – | 0.014 | −0.043 | 0.015 | −0.053 |
| 0.49 | 0.54 | 0.61 | 0.45 | 0.36 | 0.23 | 0.35 | 0.14 | |||||
| Group Size | 0.313 | 0.369 | 0.316 | 0.379 | 0.310 | 0.295 | 0.023 | −0.053 | 0.023 | 0.010 | 0.023 | 0.015 |
| 0.00 | 0.16 | 0.00 | 0.24 | 0.01 | 0.36 | 0.06 | 0.68 | 0.05 | 0.86 | 0.05 | 0.66 | |
| Ambient Temperature | −0.051 | 0.087 | −0.053 | 0.022 | −0.055 | 0.117 | −0.006 | −0.008 | −0.006 | −0.006 | −0.003 | −0.036 |
| 0.347 | 0.665 | 0.34 | 0.91 | 0.29 | 0.62 | 0.933 | 0.945 | 0.93 | 0.96 | 0.97 | 0.74 | |
| Republican | −0.744 | −1.081 | −0.690 | −0.946 | −0.741 | −0.896 | −0.687 | −2.150 | −0.783 | −2.162 | −0.690 | −2.394 |
| 0.06 | 0.39 | 0.09 | 0.33 | 0.06 | 0.47 | 0.07 | 0.01 | 0.04 | 0.01 | 0.07 | 0.01 | |
| Dem Pres Vote | −0.001 | −0.038 | 0.005 | −0.031 | 0.000 | −0.025 | −0.001 | 0.003 | −0.011 | 0.032 | −0.001 | 0.020 |
| 0.96 | 0.64 | 0.87 | 0.63 | 0.99 | 0.79 | 0.97 | 0.94 | 0.53 | 0.46 | 0.97 | 0.65 | |
| South | 0.050 | 0.005 | 0.086 | 0.452 | 0.093 | −0.113 | −0.010 | 0.757 | −0.020 | 0.740 | −0.040 | 1.082 |
| 0.91 | 1.00 | 0.84 | 0.50 | 0.82 | 0.92 | 0.98 | 0.23 | 0.96 | 0.23 | 0.91 | 0.10 | |
| 1990s | −0.391 | 0.208 | −0.964 | 0.083 | −0.440 | 0.408 | −0.010 | −0.418 | −0.506 | −0.620 | 0.051 | −0.691 |
| 0.53 | 0.91 | 0.12 | 0.97 | 0.48 | 0.83 | 0.98 | 0.59 | 0.06 | 0.19 | 0.89 | 0.37 | |
| 2000s | −1.059 | −1.534 | −1.954 | −1.569 | −1.042 | −1.960 | – | – | – | – | – | – |
| 0.19 | 0.19 | 0.00 | 0.29 | 0.21 | 0.17 | |||||||
| First Term | −1.115 | −1.166 | −1.152 | −0.474 | −0.473 | −0.431 | ||||||
| 0.08 | 0.07 | 0.07 | 0.29 | 0.29 | 0.32 | |||||||
| Constant | −2.948 | −10.854 | −0.896 | −6.971 | −2.484 | −10.480 | −2.072 | −1.163 | −0.442 | −2.952 | −2.668 | 0.491 |
| 0.46 | 0.52 | 0.82 | 0.59 | 0.52 | 0.51 | 0.73 | 0.90 | 0.94 | 0.76 | 0.64 | 0.96 | |
| N | 500 | 500 | 500 | 400 | 400 | 400 | ||||||
| Wald’s Chi2 | 74.0 | 45.7 | 71.4 | 41.1 | 28.9 | 38.1 | ||||||
| Pseudo-R2 | 0.0875 | 0.0659 | 0.0941 | 0.0709 | 0.0655 | 0.0832 | ||||||
5.5.2 LGBTQ and Racial/Ethnic Minorities
Models estimating the effects of electoral insecurity and institutional advocacy context on senator reputation as an advocate for racial/ethnic minorities and the LGBTQ community are given in Table 5.8. Here too, a senator’s vote share in the previous election does not significantly impact a senator’s decision to cultivate a reputation as a group advocate. Once again, the electoral insecurity hypothesis is not supported. While this was not unexpected when considering advocacy on behalf of groups with a high level of perceived deservingness, the context of advocacy for groups like racial/ethnic minorities and the LGBTQ community is where electoral insecurity should have its strongest effects. Instead, models imply that relative electoral marginality is not a pivotal factor that senators use to make decisions about the reputations they craft as disadvantaged-group advocates.
While electoral insecurity is insignificant across each of the models estimated in Table 5.8, the institutional advocacy context variables do not have the same effect on the likelihood of having a reputation as a racial/ethnic minority advocate as they do reputations for LGBTQ advocacy. The decision to craft a reputation as an advocate for racial/ethnic minorities is not significantly impacted by the number of other senators with reputations as minority advocates nor by the presence of a same-state advocate. The decision to form a reputation as an LGBTQ advocate, however, is significantly related to the number of other advocates within the institution, providing further support for the collective amplification hypothesis.
Table 5.8 Institutional, electoral, and constituency effects on member reputation for advocacy for racial/ethnic minorities and the LGBTQ community
| LGBTQ | Race/Ethnicity | ||||||||
|---|---|---|---|---|---|---|---|---|---|
| logit | logit | logit | 0 | 1 | 0 | 1 | 0 | 1 | |
| Total Advocates | 0.880 | – | 0.902 | 0.251 | 1.249 | – | – | 0.188 | 3.262 |
| 0.04 | 0.03 | 0.10 | 0.48 | 0.23 | 0.16 | ||||
| Same State Advocate | – | – | – | −0.055 | 0.018 | – | – | 0.096 | 7.033 |
| 0.92 | 0.99 | 0.84 | 0.24 | ||||||
| Previous Vote Share | – | −0.006 | −0.012 | – | – | 0.040 | −0.060 | 0.035 | −0.369 |
| 0.81 | 0.57 | 0.10 | 0.58 | 0.17 | 0.26 | ||||
| Group Size | −3.251 | −1.827 | −3.270 | 0.009 | 0.018 | 0.009 | −0.025 | 0.014 | −0.069 |
| 0.30 | 0.46 | 0.30 | 0.49 | 0.72 | 0.49 | 0.38 | 0.29 | 0.28 | |
| Ambient Temperature | 0.062 | 0.055 | 0.063 | 0.071 | 0.440 | 0.069 | 0.459 | 0.037 | 2.123 |
| 0.50 | 0.56 | 0.50 | 0.48 | 0.38 | 0.49 | 0.52 | 0.72 | 0.16 | |
| Republican | −0.534 | −0.619 | −0.544 | 0.477 | 0.751 | 0.582 | −2.361 | 0.795 | −6.477 |
| 0.60 | 0.54 | 0.59 | 0.31 | 0.51 | 0.22 | 0.43 | 0.11 | 0.33 | |
| Dem Pres Vote | 0.119 | 0.085 | 0.124 | 0.052 | 0.146 | 0.045 | 0.038 | 0.052 | 0.677 |
| 0.04 | 0.03 | 0.03 | 0.16 | 0.74 | 0.15 | 0.51 | 0.19 | 0.23 | |
| South | −0.665 | −0.650 | −0.617 | −1.155 | −12.287 | −1.308 | −15.899 | −1.151 | −13.657 |
| 0.52 | 0.52 | 0.55 | 0.05 | 0.00 | 0.03 | 0.00 | 0.06 | 0.00 | |
| 1990s | 0.384 | −0.393 | 0.400 | 0.837 | 10.763 | 2.580 | 20.795 | 0.929 | 5.612 |
| 0.83 | 0.85 | 0.83 | 0.60 | 0.30 | 0.03 | 0.00 | 0.58 | 0.49 | |
| 2000s | 1.559 | −0.189 | 1.635 | 0.906 | 10.962 | 1.616 | 15.815 | 0.892 | 0.976 |
| 0.20 | 0.89 | 0.19 | 0.48 | 0.11 | 0.17 | 0.00 | 0.49 | 0.92 | |
| First Term | −0.803 | −0.959 | −0.834 | −0.927 | −0.817 | −0.516 | |||
| 0.38 | 0.32 | 0.37 | 0.15 | 0.22 | 0.45 | ||||
| Constant | −14.450 | −9.236 | −14.603 | −12.547 | −60.532 | −12.591 | −51.859 | −11.070 | −196.836 |
| 0.01 | 0.13 | 0.01 | 0.09 | 0.27 | 0.09 | 0.31 | 0.13 | 0.13 | |
| N | 500 | 500 | 500 | 500 | 500 | 500 | |||
| Wald’s Chi2 | 13.8 | 14.4 | 19.2 | 1,631.7 | 769.3 | 3,221.8 | |||
| Pseudo-R2 | 0.1166 | 0.0915 | 0.1177 | 0.1577 | 0.1553 | 0.2261 | |||
5.5.3 Immigrants and the Poor
Table 5.9 displays the coefficients demonstrating the estimated effects of electoral insecurity and the institutional advocacy context on the likelihood of a senator having a reputation as an advocate for immigrants and the poor. Across all of these models, the effects of partisanship on senator reputation retain their significance, as does the effect of the percentage of immigrants within a state. Senators from more Democratic-leaning states also remain more likely to have at least a superficial reputation as an advocate for the poor. However, a senator’s previous vote share yet again does not exhibit a significant effect on the choice to build a reputation as a group advocate.
The presence of a same-state senator with a reputation as an advocate for immigrants or the poor once again does not have a significant effect on senator reputation, and thus fails to provide support for the same-state differentiation hypothesis. Additionally, while having a larger number of other senators who are actively known as immigrant advocates does not have a significant impact on the choice to build a reputation as an advocate for immigrants, it does significantly enhance the chances that a senator will have a reputation as at least a superficial advocate for the poor, providing mixed support between these two cases for the collective amplification hypothesis.
Table 5.9 Institutional, electoral, and constituency effects on reputation for advocacy for immigrants and the poor
| Immigrants | Poor | |||||||||||
|---|---|---|---|---|---|---|---|---|---|---|---|---|
| 0 | 1 | 0 | 1 | 0 | 1 | 0 | 1 | 0 | 1 | 0 | 1 | |
| Total Advocates | 0.166 | 1.543 | – | – | 0.174 | 1.653 | 0.099 | 0.055 | – | – | 0.098 | 0.055 |
| 0.58 | 0.15 | 0.56 | 0.25 | 0.02 | 0.29 | 0.02 | 0.30 | |||||
| Same State Advocate | 0.271 | 0.290 | – | – | 0.279 | 0.543 | 0.238 | 0.202 | – | – | 0.231 | 0.204 |
| 0.52 | 0.67 | 0.51 | 0.67 | 0.12 | 0.33 | 0.13 | 0.33 | |||||
| Previous Vote Share | – | – | 0.029 | 0.042 | 0.029 | 0.047 | – | – | 0.008 | 0.000 | 0.006 | −0.002 |
| 0.09 | 0.28 | 0.09 | 0.60 | 0.55 | 0.98 | 0.70 | 0.91 | |||||
| Group Size | 0.104 | −0.108 | 0.114 | −0.063 | 0.114 | −0.097 | −0.002 | 0.001 | −0.008 | −0.003 | −0.003 | 0.000 |
| 0.01 | 0.64 | 0.00 | 0.73 | 0.00 | 0.66 | 0.97 | 0.98 | 0.86 | 0.96 | 0.95 | 1.00 | |
| Ambient Temperature | 0.002 | −0.165 | −0.003 | −0.013 | −0.002 | −0.167 | −0.063 | −0.149 | −0.069 | −0.158 | −0.062 | −0.152 |
| 0.98 | 0.36 | 0.96 | 0.93 | 0.97 | 0.35 | 0.30 | 0.14 | 0.24 | 0.11 | 0.30 | 0.14 | |
| Republican | 0.984 | 2.423 | 1.075 | 2.035 | 1.046 | 1.978 | −0.510 | −0.887 | −0.534 | −0.900 | −0.509 | −0.873 |
| 0.04 | 0.18 | 0.03 | 0.20 | 0.03 | 0.55 | 0.08 | 0.03 | 0.07 | 0.03 | 0.09 | 0.04 | |
| Dem Pres Vote | 0.012 | 0.094 | 0.014 | 0.073 | 0.011 | 0.081 | 0.061 | 0.038 | 0.056 | 0.034 | 0.061 | 0.037 |
| 0.67 | 0.26 | 0.58 | 0.19 | 0.67 | 0.33 | 0.03 | 0.29 | 0.02 | 0.29 | 0.03 | 0.31 | |
| South | −0.448 | −16.794 | −0.467 | −15.305 | −0.439 | −16.764 | −0.234 | −0.905 | −0.265 | −0.954 | −0.244 | −0.893 |
| 0.44 | 0.00 | 0.40 | 0.00 | 0.44 | 0.00 | 0.46 | 0.17 | 0.41 | 0.14 | 0.45 | 0.17 | |
| 1990s | 0.522 | −1.287 | −0.085 | −2.984 | 0.591 | −0.638 | −0.562 | 0.209 | 0.211 | 0.654 | −0.555 | 0.201 |
| 0.73 | 0.71 | 0.92 | 0.40 | 0.69 | 0.89 | 0.24 | 0.79 | 0.60 | 0.33 | 0.24 | 0.80 | |
| 2000s | 0.081 | 4.707 | −0.652 | −1.309 | 0.042 | 4.964 | −0.476 | −0.143 | 0.189 | 0.200 | −0.481 | −0.162 |
| 0.95 | 0.26 | 0.12 | 0.30 | 0.97 | 0.34 | 0.34 | 0.87 | 0.68 | 0.80 | 0.34 | 0.86 | |
| First Term | −0.448 | −0.388 | −0.369 | −0.247 | −0.299 | −0.227 | ||||||
| 0.48 | 0.54 | 0.55 | 0.43 | 0.32 | 0.46 | |||||||
| Constant | −5.891 | −13.363 | −4.875 | −6.725 | −6.395 | −14.427 | −1.670 | −0.247 | 0.758 | 6.726 | −1.753 | 5.156 |
| 0.18 | 0.17 | 0.14 | 0.35 | 0.14 | 0.20 | 0.75 | 0.43 | 0.88 | 0.38 | 0.74 | 0.53 | |
| N | 500 | 500 | 500 | 500 | 500 | 500 | ||||||
| Wald’s Chi2 | 1,247.0 | 970.1 | 1,539.6 | 59.4 | 39.6 | 60.1 | ||||||
| Pseudo-R2 | 0.1053 | 0.0980 | 0.1129 | 0.0864 | 0.0751 | 0.0868 | ||||||
5.5.4 Women
Table 5.10 presents the models demonstrating the effects on senator reputation as a women’s advocate for each of the institutional, electoral, and constituency factors introduced to this point.
Table 5.10 Institutional, electoral, and constituency effects on member reputation for advocacy for women
| Women | ||||||
|---|---|---|---|---|---|---|
| 0 | 1 | 0 | 1 | 0 | 1 | |
| Total Advocates | 0.167 | 0.276 | – | – | 0.167 | 0.265 |
| 0.00 | 0.03 | 0.00 | 0.04 | |||
| Same State Advocate | −0.087 | −0.371 | – | – | −0.114 | −0.354 |
| 0.67 | 0.23 | 0.58 | 0.23 | |||
| Previous Vote Share | – | – | −0.019 | 0.002 | −0.019 | −0.004 |
| 0.37 | 0.95 | 0.38 | 0.88 | |||
| Group Size | −0.176 | −0.953 | −0.102 | −0.798 | −0.172 | −0.950 |
| 0.56 | 0.03 | 0.73 | 0.05 | 0.57 | 0.02 | |
| Ambient Temperature | −0.005 | 0.051 | −0.006 | 0.071 | −0.007 | 0.067 |
| 0.93 | 0.55 | 0.92 | 0.36 | 0.90 | 0.41 | |
| Republican | −0.215 | −0.125 | −0.277 | −0.579 | −0.218 | −0.293 |
| 0.58 | 0.87 | 0.48 | 0.46 | 0.57 | 0.73 | |
| Dem Pres Vote | 0.076 | 0.181 | 0.061 | 0.134 | 0.079 | 0.177 |
| 0.01 | 0.01 | 0.02 | 0.00 | 0.01 | 0.00 | |
| South | −0.277 | 1.553 | −0.332 | 1.362 | −0.231 | 1.542 |
| 0.59 | 0.21 | 0.50 | 0.21 | 0.65 | 0.18 | |
| 1990s | −0.658 | −1.661 | 0.813 | 0.609 | −0.673 | −1.539 |
| 0.15 | 0.11 | 0.02 | 0.31 | 0.15 | 0.15 | |
| 2000s | −0.035 | −0.211 | 0.216 | −0.249 | 0.008 | −0.313 |
| 0.92 | 0.77 | 0.54 | 0.59 | 0.98 | 0.62 | |
| First Term | −0.651 | −0.770 | −0.726 | |||
| 0.06 | 0.03 | 0.04 | ||||
| Constant | 1.588 | 29.493 | 0.689 | 26.228 | 1.640 | 28.898 |
| 0.92 | 0.14 | 0.97 | 0.17 | 0.92 | 0.14 | |
| N | 500 | 500 | 500 | |||
| Wald’s Chi2 | 45.7 | 45.9 | 50.2 | |||
| Pseudo-R2 | 0.1132 | 0.0988 | 0.1166 | |||
These models show that senators representing more Democratic-leaning states remain significantly more likely to have a reputation as an advocate for women, and that the percentage of women within a state retains its significant effect.Footnote 10 As has been the case for all groups for which advocacy on their behalf has been examined, the models also indicate that variation in a senator’s vote share from their most recent election does not have a significant effect on member reputation. These models do, however, provide further support for the collective amplification hypothesis, as evidenced by the significant effect that the total number of women’s advocates has on member reputation for both superficial and primary/secondary advocacy.
5.5.5 Discussion
None of these models demonstrating the relative impact of these institutional, electoral, and constituency factors on senator reputation as a disadvantaged-group advocate support the electoral insecurity hypothesis. Regardless of the particular group that senators are known as advocating for, their vote share in their most recent election does not have a significant effect on the choice to craft such a reputation.Footnote 11 At first look, this result is surprising. Most senators face a more heterogeneous electorate than members of the House, and the average Senate election is more competitive than the average House election. Because it is less likely that a single constituent group will dominate in a state in the same way as in a congressional district, it becomes even more important to be sure that representational decisions on behalf of one group do not inadvertently raise the ire of another. But to understand the lack of support for the electoral insecurity hypothesis, it is important to keep in mind what these results do and do not show.
The insignificance of a senator’s most recent vote share to the reputations they form demonstrates that close reelections themselves do not actively turn a senator off from building a reputation as a disadvantaged-group advocate, even for those groups that are generally viewed more skeptically in American society. It does not imply, however, that reelection concerns play no role in reputation formation. These models are also compatible with a circumstance in which, particularly for groups that are not considered to be highly deserving of government assistance, there is no electoral margin that is “safe” enough to push a senator to form a reputation as a disadvantaged-group advocate in the absence of incentives from other factors. This makes the lack of support for the electoral insecurity hypothesis particularly important, because it implies that a senator’s decisions about the electoral risk of their reputational decisions may be untethered to the reality of their electoral situation.
These models also do not provide support for the same-state differentiation hypothesis. There is no evidence, for any of the group advocacy reputations evaluated, that senators are less likely to decide to build a reputation as a disadvantaged-group advocate on account of their same-state senator being known for similar advocacy work. This serves to demonstrate how unique disadvantaged-group advocacy is relative to more subject-matter specific specializations. These results also actually emphasize the importance of considering representation as a reputation built over time by an assortment of actions (over which a senator has a wide range of latitude), rather than a specific set of policy preferences or predetermined types of member behavior.
The collective amplification hypothesis, however, receives strong support. Women, the poor, the LGBTQ community, veterans, and seniors are significantly more likely to gain additional senators as advocates for their needs as the number of advocates within the institution increases.Footnote 12 Note that this effect was present in a model that controlled for underlying public opinion toward the group. Having higher numbers of senators who include disadvantaged-group advocacy in their legislative reputation not only provides an example to other senators that it can be “safe” to do so, it also raises the salience of issues relevant to these groups. The level of advocacy where the greatest increase is seen is superficial advocacy. Superficial advocates are rarely those who take it upon themselves to insert a disadvantaged group’s needs into the conversation, and instead frequently piggyback off of the actions of others, whether through cosponsorship or some other partnering. Thus, it is perfectly reasonable that as the number of other senators with reputations for advocacy goes up, more senators could be induced to join them.
Women’s advocates are particularly unique in this, because the boost in the number of other senators with reputations for women’s advocacy occurs both for superficial advocates as well as for primary and secondary advocates. This implies that the presence of other advocates within the Senate does not just push others to jump on board with less frequent or lower-key actions like cosponsorship, but rather encourages them to take up a greater role in pushing for the needs and interests of women. In sum, out of all three of these alternative hypotheses, only the collective amplification hypothesis is supported by these models.
5.6 Descriptive Representation and Reputation Formation in the US Senate
As discussed in Chapters 2 and 3, personal experiences as a member of a disadvantaged group may make a legislator more determined to address some of the challenges group members face, and can also serve as a shortcut for crafting a reputation as a credible group advocate. In the House, descriptive representatives – those who are themselves a member of a disadvantaged group – are significantly more likely to form a reputation as an advocate for nearly all disadvantaged groups under consideration (immigrants and seniors being the exceptions). It is expected that descriptive representation will boost the likelihood that a representative will have a reputation as a disadvantaged-group advocate in the Senate as well. Given the amount of leeway that senators possess relative to a member of the House in establishing their legislative reputations, those personal experiences as a member of a disadvantaged group may even have an outsized influence in pushing a senator to form a reputation as an advocate. In this section, I specifically examine that relationship, and estimate the impact of being a descriptive representative on the likelihood of a senator building a reputation as a disadvantaged-group advocate.Footnote 13
5.6.1 Modeling Reputation Formation for Descriptive Representatives
Table 5.11 shows the number of descriptive representatives included in the dataset, broken down by group and level of advocacy. When looking at this table, there is one inescapable fact that must be acknowledged before moving forward in analyzing the effect of descriptive representation on senator reputation: there simply are far fewer descriptive representatives present in the Senate than in the House. This is particularly evident for descriptive representatives of groups that are considered to be anything less than highly deserving of government assistance. There are two particularly important consequences that follow from having such a small number of cases, with the first being qualitative, and the second quantitative.
Table 5.11 Number of members serving as advocates of disadvantaged groups across descriptive and nondescriptive representatives
| Seniors | Veterans | Women | Poor | Immigrants | Racial/Ethnic Minorities | LGBTQ | ||
|---|---|---|---|---|---|---|---|---|
| Non-DR | Non | 417 | 288 | 402 | 365 | 470 | 455 | 487 |
| Superficial | 50 | 15 | 27 | 71 | 21 | 15 | 9 | |
| Secondary | 17 | 7 | 7 | 36 | 6 | 7 | 3 | |
| Primary | 5 | 0 | 0 | 2 | 1 | 0 | 0 | |
| Total | 489 | 310 | 436 | 474 | 498 | 477 | 499 | |
| DR | Non | 9 | 170 | 28 | 21 | 0 | 21 | 0 |
| Superficial | 2 | 14 | 17 | 5 | 2 | 1 | 0 | |
| Secondary | 0 | 6 | 11 | 0 | 0 | 0 | 0 | |
| Primary | 0 | 0 | 8 | 0 | 0 | 1 | 1 | |
| Total | 11 | 190 | 64 | 26 | 2 | 23 | 1 | |
Senators with reputations for disadvantaged-group advocacy in the 103rd, 105th, 108th, 110th, and 113th Congress by group and descriptive representative status.
First, from a qualitative perspective, these basic descriptive statistics regarding the characteristics of people present within the institution already say a great deal about some of the critical differences between the two chambers of Congress. For nearly all disadvantaged groups, descriptive representatives are less likely to successfully make it to the Senate than to the House of Representatives. This discrepancy is most egregious in the case of racial/ethnic minorities, who make up 25 percent of the sample of members of the House, but less than 5 percent of senators. While it is not a new observation that there are fewer descriptive representatives in the Senate than in the House, it has important implications for the analysis to follow.
It is beyond the scope of this current project to pin down all of the reasons for this divergence, but the fact that it exists implies that there may be systematic differences between the types of descriptive representatives that are present in the Senate relative to the House. Just under two thirds of racial/ethnic minorities in the House, for instance, have reputations as advocates for racial/ethnic minorities, compared to less than ten percent of racial/ethnic minorities in the Senate. The implication of this is that, particularly for descriptive representatives for those groups that are not broadly considered to be highly deserving of government assistance, the characteristics it takes to be successful in a Senate election may not be the same as for a House election. This important caveat is addressed in more detail below, when interpreting the results of the analysis for descriptive representatives in the Senate.
Second, from a quantitative perspective, the severely restricted number of cases changes both the best coding of the dependent variable and the type of model that is most appropriate for estimating the effects of descriptive representation. Table 5.11 shows that, among the descriptive representatives in the Senate, there are a number of types of representation for advocacy that are not occupied. To account for the quantity of zeros across these individual categories, reputation is collapsed into a binary variable for the analysis of the effects of descriptive representation on reputation formation in the Senate.Footnote 14 The analysis to follow, then, uses Penalized Maximum Likelihood Estimation (PMLE) models to estimate the impact of descriptive representation on the likelihood that a member will have a reputation as a disadvantaged-group advocate at any level.Footnote 15
5.7 The Impact of Descriptive Representation on Senator Reputation
Table 5.12 presents the coefficients demonstrating the estimated effect of being a member of a disadvantaged group on the likelihood of a senator having a reputation as a group advocate. These models also include all variables incorporated in the sections above, to evaluate their relative impacts. Given the data constraints discussed above, these models should not be treated as perfect estimates, but rather as the best means available to glean important insights about the general relationship between descriptive representation and reputations for disadvantaged-group advocacy in the Senate.
5.7.1 Veterans, Seniors, and Racial/Ethnic Minorities
The first three columns of Table 5.12 show the impact that descriptive representation in the Senate can have on the representation of groups that are broadly considered to be the most deserving of government assistance, like veterans and seniors, and those groups that are considered to be less deserving of assistance, like racial/ethnic minorities. For the highest deservingness groups, results are mixed. Veterans in the Senate are significantly more likely to form reputations as veterans’ advocates, just as they were in the House. For seniors, however, entering the institution over the age of sixty-five does not make a senator more likely to serve as a senior advocate. With groups that are considered to be the most deserving of government assistance, descriptive representation is expected to be less important to a senator’s decisions about the reputation they craft. The results for seniors, then, fit in with these expectations. Veterans may still be more likely to form reputations as veterans’ advocates than nonveterans because of the extra credibility that is granted to them as a result of their military service. Also noteworthy is that group size remains a significant factor in member reputation as an advocate even after descriptive representation is taken into account.
Table 5.12 Descriptive representatives and senator reputation for advocacy
| Veterans | Seniors | Race/Ethnicity | Poor | Immigrants | Women | |||||||
|---|---|---|---|---|---|---|---|---|---|---|---|---|
| logit | logit | logit | logit | logit | logit | logit | logit | logit | logit | logit | logit | |
| Total Advocates | 0.160 | 0.160 | 0.057 | 0.056 | 0.234 | 0.242 | 0.092 | 0.092 | 0.144 | 0.144 | 0.208 | 0.216 |
| 0.09 | 0.09 | 0.07 | 0.07 | 0.09 | 0.08 | 0.03 | 0.03 | 0.63 | 0.63 | 0.01 | 0.01 | |
| Same State Advocate | 0.307 | 0.320 | 0.116 | 0.118 | 0.001 | 0.002 | 0.303 | 0.320 | 0.392 | 0.391 | −0.479 | −0.528 |
| 0.37 | 0.35 | 0.60 | 0.60 | 1.00 | 1.00 | 0.08 | 0.06 | 0.31 | 0.31 | 0.10 | 0.08 | |
| Previous Vote Share | −0.015 | −0.015 | 0.015 | 0.018 | 0.036 | 0.040 | 0.005 | 0.005 | 0.031 | 0.031 | −0.007 | −0.007 |
| 0.45 | 0.44 | 0.33 | 0.24 | 0.12 | 0.09 | 0.71 | 0.68 | 0.13 | 0.13 | 0.73 | 0.70 | |
| Group Size | 0.313 | 0.307 | 0.023 | 0.023 | 0.008 | 0.017 | −0.002 | 0.000 | 0.098 | 0.098 | 0.142 | 0.117 |
| 0.01 | 0.01 | 0.04 | 0.04 | 0.64 | 0.35 | 0.95 | 0.99 | 0.01 | 0.01 | 0.52 | 0.59 | |
| Descriptive Representative | 0.701 | 6.032 | 0.180 | 115.938 | 0.233 | 48.317 | −0.659 | −6.126 | 3.883 | 7.615 | 3.688 | −2.941 |
| 0.05 | 0.337 | 0.81 | 0.28 | 0.81 | 0.07 | 0.20 | 0.528 | 0.02 | 0.90 | 0.00 | 0.64 | |
| Ambient Temperature | −0.048 | −0.007 | −0.005 | 0.005 | 0.070 | 0.111 | −0.062 | −0.069 | 0.006 | 0.006 | −0.063 | −0.094 |
| 0.374 | 0.919 | 0.93 | 0.93 | 0.50 | 0.30 | 0.19 | 0.161 | 0.92 | 0.92 | 0.27 | 0.15 | |
| Ambient Temp. & DR | – | −0.074 | – | −1.487 | – | −0.739 | – | 0.081 | – | −0.091 | – | 0.118 |
| 0.40 | 0.28 | 0.08 | 0.57 | 0.94 | 0.30 | |||||||
| Republican | −0.766 | −0.745 | −0.667 | −0.659 | 0.512 | 0.578 | −0.554 | −0.563 | 0.864 | 0.863 | 0.072 | 0.062 |
| 0.04 | 0.05 | 0.03 | 0.03 | 0.28 | 0.23 | 0.03 | 0.03 | 0.08 | 0.08 | 0.83 | 0.86 | |
| Dem Pres Vote | −0.001 | 0.000 | −0.001 | 0.002 | 0.052 | 0.055 | 0.057 | 0.057 | 0.000 | 0.001 | 0.054 | 0.055 |
| 0.98 | 0.99 | 0.97 | 0.92 | 0.09 | 0.08 | 0.00 | 0.00 | 0.99 | 0.98 | 0.03 | 0.03 | |
| South | 0.075 | 0.110 | −0.003 | −0.073 | −1.178 | −1.282 | −0.218 | −0.199 | −0.578 | −0.580 | −0.714 | −0.731 |
| 0.83 | 0.76 | 0.99 | 0.81 | 0.07 | 0.05 | 0.44 | 0.48 | 0.25 | 0.25 | 0.10 | 0.09 | |
| 1990s | −0.673 | −0.614 | −0.011 | 0.019 | 0.658 | 0.881 | −0.524 | −0.524 | 0.763 | 0.758 | 0.223 | 0.040 |
| 0.30 | 0.35 | 0.98 | 0.96 | 0.64 | 0.55 | 0.29 | 0.29 | 0.58 | 0.58 | 0.79 | 0.96 | |
| 2000s | −1.146 | −1.032 | – | – | 0.564 | 0.729 | −0.419 | −0.420 | 0.018 | 0.012 | 0.543 | 0.431 |
| 0.16 | 0.21 | 0.61 | 0.51 | 0.41 | 0.41 | 0.99 | 0.99 | 0.33 | 0.44 | |||
| First Term | −0.924 | −0.931 | −0.345 | −0.320 | −0.629 | −0.881 | −0.156 | −0.159 | −0.568 | −0.558 | −1.518 | −1.462 |
| 0.12 | 0.12 | 0.44 | 0.48 | 0.38 | 0.27 | 0.63 | 0.62 | 0.41 | 0.42 | 0.01 | 0.01 | |
| Constant | −2.973 | −5.993 | −2.379 | −3.347 | −12.598 | −15.860 | −1.406 | −0.960 | −5.699 | −5.701 | −12.088 | −9.107 |
| 0.53 | 0.31 | 0.61 | 0.48 | 0.10 | 0.05 | 0.72 | 0.81 | 0.14 | 0.14 | 0.28 | 0.42 | |
| N | 500 | 500 | 400 | 400 | 500 | 500 | 500 | 500 | 500 | 500 | 500 | 500 |
| Wald’s Chi2 | 20.8 | 21.4 | 18.6 | 18.8 | 18.4 | 20.6 | 43.6 | 43.8 | 23.1 | 25.4 | 78.1 | 79.5 |
| Prob > Chi2 | 0.0538 | 0.0663 | 0.0679 | 0.0949 | 0.1034 | 0.0809 | 0.0000 | 0.0000 | 0.0267 | 0.0205 | 0.0000 | 0.0000 |
For groups with lower levels of perceived deservingness of government assistance, results are vastly different from those seen in the House of Representatives. In the House, members who were themselves racial/ethnic minorities were considerably more likely to form a reputation as a minority advocate. As seen in the third column of Table 5.12, however, this significant effect is absent in the Senate. As highlighted above, this has some particularly important implications. First, this further supports the contention that there are systematic differences in the characteristics and priorities of racial/ethnic minorities who are elected to the House, relative to the Senate. Second, this difference is critical because it speaks to the representational inequalities in the Senate when it comes to racial/ethnic minorities. One of the most notable elements of Table 5.12 is that none of the explanatory variables included in the model have a significant, positive effect on a senator forming a reputation as an advocate for racial/ethnic minorities. This demonstrates that, even relative to other disadvantaged groups, racial/ethnic minorities receive especially low levels of representation, and there is not an immediately apparent means that can be pointed to of rectifying it.
5.7.2 Immigrants, the Poor, and Women
Immigrants, women, and the poor are groups that have a more mixed position in the American psyche, and tend not to be seen as either broadly deserving or not deserving of government assistance. For these groups as well, the effects of descriptive representation are also mixed, as seen in the final three columns of Table 5.12. Senators who are themselves women and immigrants are significantly more likely to form reputations as group advocates, while those with a personal history of poverty are not. This is different from that which was seen in the House, where the impact on reputation of having personally spent time in poverty and emigrating from another country are inverted. For the poor, the lack of the significance of descriptive representation could stem from the fact that any US senator is likely to be very far removed from their days in poverty, even relative to members of the House, leaving them less connected to individuals who are currently experiencing poverty.
Immigrants, on the other hand, stand out as the only other group outside of veterans and seniors for whom group size retains its significant effect on senator reputation. Though the number of immigrants that have served in the Senate and are included in the sample is small – there are only two of them – each incorporated advocacy for immigrants into their reputations. The first, Democratic Sen. Mazie Hirono (HI), fought for benefits for Filipino service members who immigrated to the United States, and the second, Republican Sen. Mel Martinez (FL), worked to pass an immigration reform bill that included a path to citizenship for undocumented immigrants.
In both the House and the Senate, female members are significantly more likely to have a reputation as women’s advocates than male members. The positive effect of more Democratic states being more likely to have a senator with a reputation as an advocate for women also retains its significance, as does the presence of additional women’s advocates within the institution. Also in these models, once women in office are themselves accounted for, the percentage of women within a state loses its misleading prior significance.
5.7.3 Interactive Effects of Descriptive Representation on Reputation
As in the previous chapter, I next turn to examine the differences in the impact that ambient temperature has on descriptive representatives relative to nondescriptive representatives. As shown in the earlier analysis in this chapter, ambient temperature has not been seen to have a statistically significant effect on senator reputation, even when analyzed independently from group size or descriptive representation. Thus, the object of this analysis is to determine if ambient temperature takes on a significant role for descriptive representatives, as would be expected by the theory laid out in Chapter 2, despite these effects being masked when examining the Senate as a whole.
Figure 5.1 displays the predicted effects of ambient temperature on member reputation for senators who are themselves members of a given disadvantaged group relative to those who are not. For women’s advocates, these effects in the Senate very closely resemble those of the House. Regardless of the ambient temperature toward women in a state or district, female senators and members of the House are consistently and significantly more likely to have a reputation as an advocate for women. The difference in the predicted effects of being a woman is even larger in the Senate than in the House – the predicted likelihood that a female senator will have a reputation for some level of women’s advocacy is over 50 percent, compared to less than one percent for male senators.

Figure 5.1 Predicted effects of ambient temperature for members with reputations as advocates relative to non-advocates for descriptive representatives
Note: Figures show the predicted marginal effects of ambient temperature on reputation for superficial, secondary, or primary advocacy relative to non-advocacy for members who are themselves descriptive representatives of the group and members who are not. Predicted marginal effects are calculated using Stata’s margins command for the models containing interactions between descriptive representative and ambient temperature shown in Tables 5.12. All other variables are held to their mean values within the dataset. Clockwise from the top left, the groups whose representation is being analyzed are veterans, seniors, the poor, women, immigrants, and racial/ethnic minorities.
For all other groups, the effects shown in Figure 5.1 may not be consistently statistically significant, but the trajectories of the predicted effects still provide important insight into the role of descriptive representatives as group advocates in the Senate. As can be readily seen by comparing Figures 4.2 and 5.1, for the majority of groups examined, the pattern of the effects are quite different in the Senate than in the House. In the Senate, descriptive representatives are more likely than nondescriptive representatives to build a reputation as a group advocate in instances where ambient temperature is low. However, this distinction fades when the group ambient temperature increases. This is essentially the opposite from what is seen in the House, where members who are themselves descriptive representatives become more likely to build a reputation for group advocacy as the ambient temperature in a district increases.
5.8 The Advocacy Window and the US Senate
The analysis contained within this chapter also allows for the evaluation of the concept of the advocacy window in the context of the US Senate. The advocacy window, as introduced in Chapter 2, is a means of conceptualizing the discretion that a legislator has when making decisions about the legislative reputation they seek to cultivate. It argues that for any disadvantaged group, there is essentially a “floor” level of representation that is expected, and that the placement of this floor is tied to the size of the group within a state or district. There is also a “ceiling” for group representation that marks the higher end of the level of representation that will be tolerated in a given state or district, which is based on the general feelings toward a group in a state or district. If a group is popular, a legislator can devote more of their time and energy to serving the needs of those group members without provoking a negative response from the rest of the state or district as a whole (and thus without risking unnecessary electoral reprisals). If a group is unpopular in a state or district, legislators have less space in which they can exercise discretion over the amount of representation they provide without risking the ire of the majority of the state or district.
In the House, the advocacy window is a fairly effective means of conceptualizing the decisions that members make in regards to the reputations for disadvantaged-group advocacy that they choose to cultivate. For nearly all groups evaluated, the likelihood of a member having a reputation for some level of advocacy increases as the size of a group in a district increases, and as positive views toward a disadvantaged group within a district go up. Also, as per expectations, there is evidence that descriptive representatives are more likely to take advantage of a large advocacy window, especially for those groups that are generally considered to be less deserving of government assistance.
When it comes to the advocacy window, there are important differences between the House and the Senate. First, while group size played an important role in the House in determining whether or not a member would have a reputation for at least a superficial level of advocacy, in the Senate, group size plays a significant role for only a limited number of groups. Specifically, group size has the expected significant and positive effect for those groups that are broadly considered to be deserving of government assistance, like seniors and veterans. For nearly all other groups, the size of the group constituency within a state is not a significant factor.
This implies that, in the Senate, the acceptable “floor” for groups that are not held in high esteem in the country is in fact doing nothing at all. Generally speaking, there are more constituent groups that are vying for the attention of a senator than a member of the House, and any one particular group is less likely to be a dominant force in a state, compared to a congressional district. Therefore, it tends to be only the disadvantaged groups who are held in high regard who are able to command enough influence to raise the floor of their advocacy window to match their presence within the state. Other constituent groups are markedly less likely to be resentful of a senator who advocates for the veterans and seniors in their state, for example, than for other disadvantaged groups that are viewed skeptically, making it a less electorally risky choice.
Second, while group ambient temperature may well still serve as a ceiling for the potential level of representation a legislator can offer a group, hardly any senators actually aim to reach that ceiling. When evaluated independently, having a higher ambient temperature in and of itself does not make a senator more likely to form a reputation as a disadvantaged-group advocate, regardless of the group being considered. Bringing descriptive representatives into the mix, however, adds important nuance into this discussion.
In the House, descriptive representatives are generally more likely to form a reputation as a group advocate as ambient temperature goes up and the advocacy window increases in size. But in the Senate, descriptive representatives tend to invert that behavior – they are more likely to have a reputation as a group advocate when the ambient temperature in a state is low, with that advantage over nondescriptive representatives fading away as ambient temperature and the advocacy window increases. This implies that there is a fundamental difference between members of the House and the Senate in how they view their advocacy window, and when they are sparked into action.
As a general rule, for both senators and members of the House, descriptive representatives tend to be more likely to craft a reputation as a group advocate. But in the Senate, these descriptive representatives may instead be more likely to act when things feel dire – when the advocacy window is closer to closing. Senators who are themselves disadvantaged group members (especially those who are descriptive representatives for less well-regarded groups) face a constant pressure between group identity and electoral viability, and tend to be pushed into action only when they perceive the threat level against their group to be particularly high. Members of the House, on the other hand, will act when they see the greatest opportunity at the lowest risk – when the advocacy window is large.
The tale of two senators from Illinois can illustrate both the vast level of discretion that senators possess when cultivating their reputations, as well as the additional levels of risk that descriptive representatives may sometimes be willing to take on relative to senators who are not themselves a member of a disadvantaged group. Illinois is one of the more racially/ethnically diverse states in the country, and has become even more so over the course of the last few decades. During the 1990s, Illinois was also a state with one of the lowest ambient temperatures toward racial/ethnic minorities. In 1992, Carol Moseley-Braun (D) became the first Black woman elected to the US Senate. During her first and only term in the Senate, she built a reputation as a primary advocate for racial/ethnic minorities, despite the relatively low ceiling of her advocacy window in Illinois. Less than a decade after Sen. Moseley-Braun’s defeat in her reelection battle, Illinois sent another Black representative to the Senate. Sen. Barack Obama (D), likely with his eyes on a national constituency rather than the state of Illinois alone, made the opposite decision, and chose not to integrate racial advocacy into his legislative reputation.
5.9 Conclusion
Senators tend to face additional stressors as the result of responsibilities that come with representing an entire state. Relative to the average congressional district, states contain considerably more groups that a senator must adjudicate between when making decisions about the legislative reputation they wish to cultivate. As discussed in Chapter 3, it is simply not possible to build a reputation as an advocate for all the different groups that are present within their state – they must be strategic, and they must choose wisely. This makes them much less likely to stick their neck out to represent a group that is generally viewed as being less deserving of government assistance, out of fears that it will frustrate non-group members, and diminish their chances of reelection.
This chapter has shown that, unlike in the House, the size of a disadvantaged group within a district generally does not increase the likelihood that a senator will form a reputation as a disadvantaged-group advocate, unless the group is broadly considered to be deserving of government assistance. Likewise, though group ambient temperature had a positive independent effect on member reputation in the House, in the Senate, disadvantaged group ambient temperature is not a significant driving factor in reputation formation. These distinctions also shed light on important differences in the way that senators and members of the House make use of the advocacy window.
In the House, the advocacy window holds up well as a means of representing the amount of discretion a member has in choosing the extent to which they devote their legislative reputation to serving the needs of disadvantaged group members, with descriptive representatives as the most likely to take advantage of a large advocacy window. In the Senate, however, the advocacy window works slightly differently. Rather than having a floor of expected advocacy that is in line with the size of the group within a district, the minimum level of anticipated advocacy in the Senate tends to be none at all, unless a disadvantaged group is considered to be particularly deserving of government assistance. Additionally, given their risk-averse nature, senators only rarely shoot for the ceiling of their advocacy window, as set by the general ambient temperature toward a group in a district, unless they are themselves a descriptive representative. And if they are, unlike in the House, where descriptive representatives are more likely to take advantage of a larger advocacy window, senators feel more pressure to act in the face of an advocacy window that is especially narrow.
To account for some of the variations in the institutional and electoral environments faced by members of the House and the Senate, this chapter also introduced and evaluated three alternative hypotheses to explain reputation formation in the Senate. The first, the electoral insecurity hypothesis, argued that senators with more marginal victories in their most recent elections would be less likely to work to craft a reputation as a disadvantaged-group advocate, out of fear that it would reduce their chances of success in their upcoming election. The second, the in-state differentiation hypothesis, built off of insights from Reference SellersSchiller (2000b) to assert that senators with a same-state counterpart who already has a reputation as a disadvantaged-group advocate are less likely to themselves have a reputation for advocacy of the same group. Finally, the collective amplification hypothesis asserted that the larger the number of senators with reputations as group advocates present in a given Congress, the more likely that others would elect to incorporate such advocacy into their reputation. After performing the analysis, only the collective amplification hypothesis was supported, implying that the presence of other advocates within the institution will encourage additional senators to include advocacy for disadvantaged groups in their own legislative reputation as well, at least at a superficial level.
In the next and penultimate chapter, I flip on its head the analysis as it has been performed up to this point, and instead consider member reputation as a pivotal explanatory variable. In doing so, I am able to specifically evaluate several of the potential drawbacks inherent to prior research in which specific legislative actions are assumed to be the preferred means of representing disadvantaged groups, and thereby carve out a new potential direction for legislative scholars to follow. Specifically, I analyze the extent to which members with reputations for disadvantaged-group advocacy tend to use bill sponsorship and cosponsorship as tools for building or maintaining their legislative reputations, and discuss the role that the committee structure and the perceived deservingness of a particular group can play in shaping sponsorship and cosponsorship decisions. This provides further evidence of the value of using legislative reputation as a primary measure of representation with the inherent flexibility required to apply across the range of disadvantaged groups.
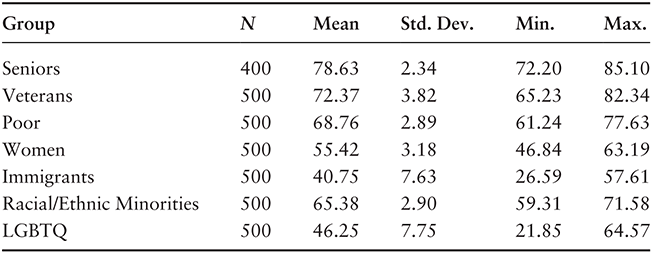
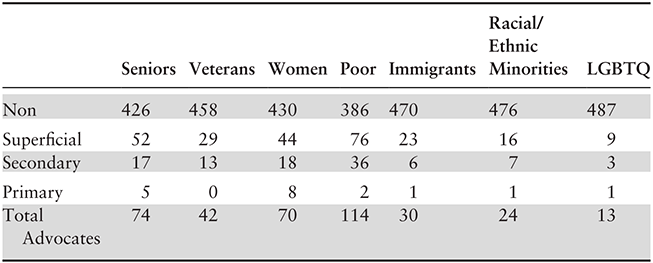
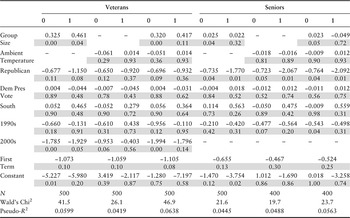
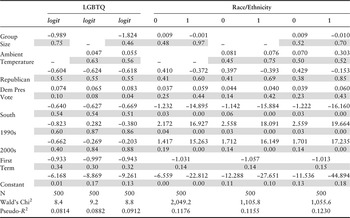
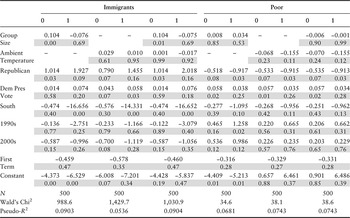
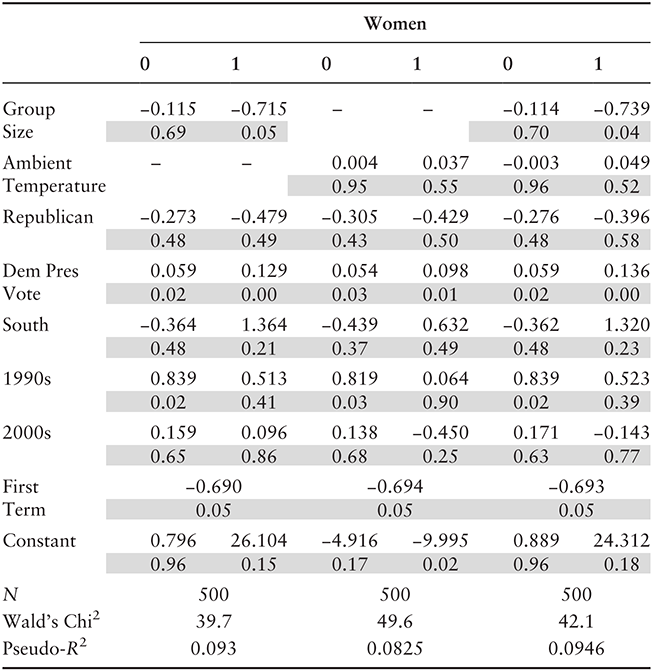
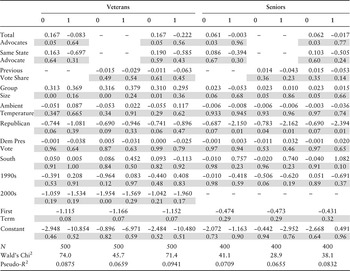
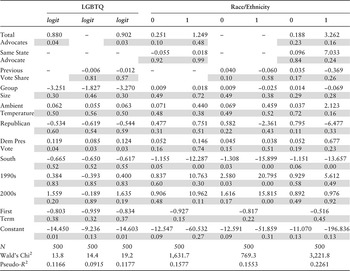
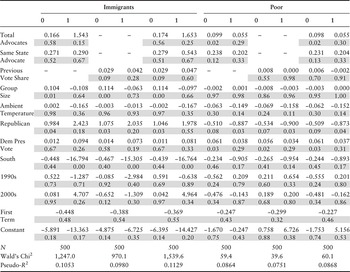
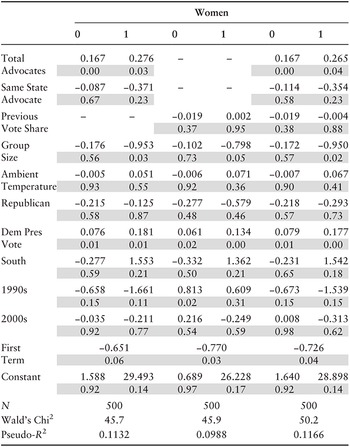
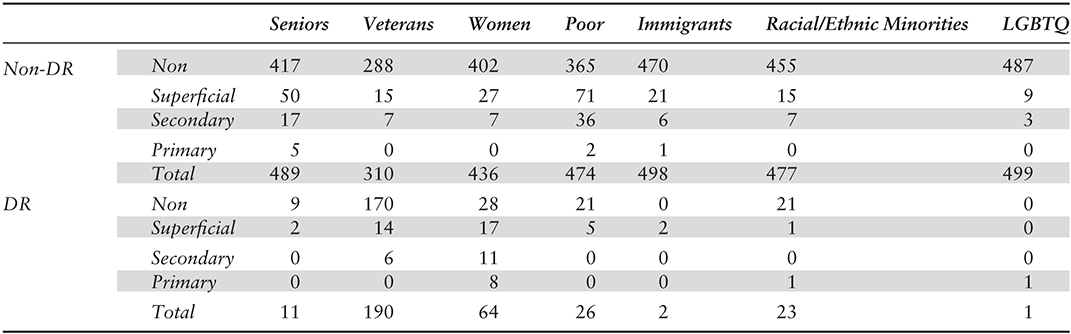
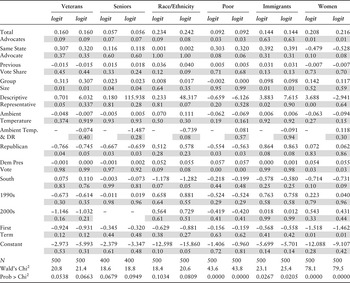


 Open access