

8.1 Introduction
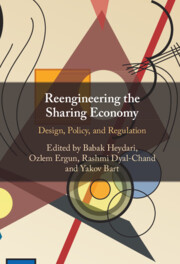
The advance of GPS technologies and the swift adoption of smartphones has enabled the rapid growth of on-demand ride services. People, being connected to the network anywhere anytime, started to see the benefits of having on-demand access to a ride from multiple competing providers. It was a convenient system for all involved parties. Moreover, not adapting to the new network-based system meant missing out on benefits for the riders and losing the market share for the ride-hailing companies. As a result, as Figure 8.1 illustrates, even traditional street hailing services adopted e-hailing systems quite quickly. On-demand ride-hailing platforms, such as Uber and Lyft, have grown rapidly in the last decade in almost all countries; in some markets, they doubled the number of riders each year. It is fascinating to see a service that did not exist just ten years ago become so significant. It is now the fastest-growing transportation mode, has gained a larger market share than taxis in many cities, and has provided another transportation option and much more flexibility to passengers. It has altered the urban mobility landscape in a significant way. However, just like any other disruptive technology in its early years, it has brought some problems too. Municipal officials are concerned about congestion and pollution, drivers complain about their working terms (as evident in the forum [1]), taxi companies are enraged about unfair competition, and passengers are often agitated with sudden spikes in fares, all suggesting that this new experience is far from being stabilized.
Figure 8.1 The figure shows the categories of for-hire vehicles (FHV) in New York City and the fact that they all adopted e-hail/e-dispatch systems by 2015 [2].
One of the primary questions about ridesharing services is whether they decrease or increase traffic congestion (and relatedly carbon dioxide [CO2] emissions). Traffic congestion is a serious and growing concern in modern life in metropolitan areas. The 2019 Urban Mobility Report of the Texas Transportation Institute [Reference Schrank, Bill and Tim3] shows that the national congestion cost in the United States has risen from $75 billion in 2000 to $179 billion in 2017 (both in 2017 dollars), a whopping 139 percent increase in less than two decades that signifies the urgency of addressing this issue. Due to the rapid expansion of ridesharing services in urban areas in the last decade, the question of their impact on traffic congestion and carbon emissions has gained considerable interest among researchers and policymakers. Researchers are clearly split between advocates and critics of ridesharing services. On the one hand, these platform-enabled ride-hailing services may decrease traffic by increasing capacity utilization and reducing ownership/use of private cars. On the other hand, this type of ride-hailing may increase traffic congestion and pollution by replacing carpooling and nondriving modes such as mass transit, biking, and walking with separate and nonshared platform-initiated rides or motivating a new trip that would have not been made otherwise. These latter findings have surprised many observers since these services were expected to help mitigate traffic congestion.
This chapter reviews the literature and analyzes different perspectives on this debate,Footnote 1 describes key policy measures, and determines the future research opportunities that could help to settle this debate. The remainder of this chapter is organized as follows. Section 8.2 provides a historical overview of ridesharing services. Section 8.3 details the arguments on each side of the debate concerning ridesharing and traffic congestion. Section 8.4 reviews some policy measures for mitigating the negative impact of ridesharing services on congestion. Finally, Section 8.5 identifies the research gaps in this area for future research.
8.2 Ridesharing – A Historical Overview
The idea of ridesharing (people sharing a trip in the same vehicle) is as old as the history of transportation and human traveling. Additionally, the negative externalities and challenges that appear to be associated with ridesharing services are similar to the negative externalities brought with any other disruptive technology throughout history. In the field of urban mobility, when the first hackney coach/carriage, the ancestor of modern days taxis [Reference Gilbey4], was introduced in London in 1605, everybody was excited and pleased with the service. However, the number of hackney coaches grew very fast, brought great nuisances to the streets of London, and raised fierce competition and bitterness between hackney coaches, wherries, barges, and sedan chairs (the popular urban transportation modes of that time) [Reference Gilbey4]. By 1635 Charles I, the king of England, issued a proclamationFootnote 2 banning and limiting the usage of hackney coaches in specific regions [Reference Anderson7]. Hackney coaches had a bumpy road with many ups and downs until the 1660s, when finally the Hackney Carriages Act of 1662 recognized the hackney carriages as one of the modes of transportation and regulated their usage concerning fares, crawling, days and hours of operation, licensing, the permissible number of licensed coaches, and specifications of horses used [Reference Gilbey4]. The current questions and debates about ridesharing services and some of the policy responses are remarkably similar. As Mark Twain famously said: “History doesn’t repeat itself, but it often rhymes.”
By the end of the twentieth century, ridesharing became a necessary and inseparable part of modern life. Because of the rapid expansion of technologies and inventions in recent decades and the complexities of modern societies, current app-based ridesharing services are conglomerates of different features of older ridesharing services, each having a different history. It is useful to learn these histories to understand their impact on current transportation systems. The rest of this section briefly reviews the histories of dial-a-ride transit, carpooling, and carsharing as the predecessors of modern ridesharing options, and then it reviews the history of platform-based services.
8.2.1 Dial-a-Ride Transit
The paratransit system, commonly known as Dial-a-Ride, is a door-to-door or curb-to-curb transportation service for people with special needs, including seniors and people with disabilities, who cannot use the standard fixed-route transit systems. People can request this service for commuting to work or school, going to a hospital, visiting a friend, or just shopping or doing groceries, typically trips constrained within a geographic zone. The establishment of the service in the United States dates back to 1970 when it started in Mansfield, Ohio in a collaboration project with Ford Motors. Two years later it was followed by a similar service in the United Kingdom in the town of Abingdon [Reference Oxley8]. The service is technically an on-demand service, but in reality most often it must be prescheduled. There is a spectrum of services in different paratransit systems where on the one end the service could be an on-demand ridesharing service that would go through a fixed route and on the other end, it could be a fully responsive transport system providing door-to-door service from any origin to any destination within a city or a specified service area. The vehicles are usually specialized cars, minivans, vans, or minibuses well-equipped to handle passengers with wheelchairs or other special needs. The passengers are pooled together to share a ride based on their origin–destination (OD) pairs and requested time intervals.Footnote 3
8.2.2 Carpooling
The concept of carpooling (and vanpooling) goes back for decades and in the United States it became very common during World War II with efforts to save fuel for the war (see Figure 8.2). It again became popular during the oil crisis in the 1970s, due to the high cost of gasoline, before gradually declining in the years that followed [Reference Ferguson10, Reference Morency11]. Carpooling can occur in three different ways: 1) commute carpooling, where people arrange their commute on a long-term basis and commit to mutually agreed and predetermined pick-up and drop-off locations and times; 2) long-distance carpooling, where drivers and riders match for a potentially one-time long-distance trip with advance scheduling and typically with an abundance of flexibility; and 3) casual carpooling (also known as “slugging”) [Reference Kelly12], where drivers and riders start a one-time relatively short rideshare trip on the spot similar to hailing a taxi on the street.Footnote 4

Figure 8.2 World War II posters promoting carpooling for work commute.
8.2.3 Carsharing
Carsharing typically refers to short-time car rentals, often for less than an hour, for a single trip within the city. The fleet usually is comprised of small electric/hybrid cars and is geographically distributed in different parts of the city. The members of a carsharing club can see the location of the closest car on a map in the carshare provider’s mobile application. Depending on city regulations, sometimes they have specific parking places, and sometimes they can be parked at any free curbside parking spot. Notable providers of this service in the last fifty years include Witkar, Communauto, ZipCar, FlexCar, City Car Club, and City CarShare. In recent years peer-to-peer carsharing is also becoming popular through services such as RelayRides and Getaround.Footnote 5
8.2.4 Application-Based Ridesharing Services
It is difficult to pinpoint the first app-based or peer-to-peer ridesharing service. Neither Lyft nor Uber gets the credit, as many other platforms started offering ridesharing services ahead of them. These platforms include Craigslist Ride Board, CarPoolWorld, BlaBlaCar, GoLoco, PickupPal, Avego (currently Carma), ZimRide, Flinc, SideCar, and Tickengo (currently Wingz).
Among these platforms perhaps SideCar is the most notable. It was the first ridesharing service that started operation in San Francisco in 2011, and its purchase by General Motors in 2015 was very well-publicized [Reference Nagesh16, Reference Paul17], bringing more attention to app-based ridesharing services. SideCar could also be credited as the inventor of platform-based, on-demand, short-distance, intracity ridesourcing, as Chief Executive Officer (CEO) Sunil Paul’s Reference Paul2002 patent suggests [Reference Paul18]. Another notable platform is ZimRide. ZimRide is a long-distance, intercity ridesharing service initially targeting college students and was founded in 2007 after one of its founders observed strangers to each other sharing a ride in Zimbabwe. ZimRide connected drivers and riders through Facebook to ensure security.
The currently dominant ridesharing services were born through these early experiences. Lyft was started as a side project within Zimride to provide intracity ride services and initially launched in San Francisco in May 2012. Since the market was extremely asymmetric in favor of Lyft, the founders offloaded the intercity carpooling section of the company and sold ZimRide to the car-rental giant Enterprise in 2013 to focus more on developing Lyft. Uber was founded in 2009 and officially launched its service in San Francisco in 2011 as a limousine or luxury black car service for more affluent customers. Later, in the summer of 2012, it developed into the ridesharing service as we know it now by launching Uber X, which allows individuals to be Uber drivers with their own cars. This was about the time of Didi’s inception in China, which later became the second largest ridesharing service in the world, as Lyft and Uber also started to expand globally. Many other similar services were developed in other countries; see Table 8.1 for a short list.
Table 8.1 Some of the non-United States platform-based ridesharing companies
Company | Country of Origin | Operation Started in |
|---|---|---|
BlaBlaCar | France | 2006 |
Carma (formerly Avego) | Ireland | 2007 |
Flinc | Germany | 2010 |
Ola | India | 2010 |
Gett | Israel | 2010 |
Cabify | Spain | 2011 |
Yandex | Russia | 2011 |
Didi | China | 2012 |
Grab | Singapore | 2012 |
Careem | UAE | 2012 |
Via | Israel | 2012 |
Bolt (formerly Taxify) | Estonia | 2013 |
Snapp | Iran | 2014 |
Gojek | Indonesia | 2015 |
FreeNow | Germany | 2019 |
Initially, neither Lyft nor Uber had a carpooling or ridesharing option leading many transportation experts to use the term “ridesourcing” for their service instead of any term that would include “pooling” or “sharing.” It could be the case that the adoption of the term “ridesharing” by many of these platforms in the early years of their operation when they were essentially operating as de facto taxi companies, was to avoid regulations surrounding taxis. To finally remove the ambiguity, in 2013, a new category of mobility service was defined in the United States as transportation network companies (TNCs) to distinguish the operation of these services from taxis, chauffeured car services, and other for-hire vehicles [Reference Geron19].
Eventually, in 2014 Lyft Line and Uber Pool were introduced, where multiple passengers could “share” a ride [Reference Rodriquez20]. Later in 2015 and 2016, new services such as Uber Commute, Uber Destinations, and Lyft Carpool were launched, where drivers were assumed to have a predetermined destination towards which they would pick up those passengers heading in that same direction. This was very similar to classical commuting carpooling and casual carpooling [Reference Byford21, Reference Hawkins22, Reference Hawkins23]. Uber also launched Uber HOP in 2015 [Reference Hawkins24, Reference Soper25], which appears to have morphed into Uber Express Pool in late 2017 and early 2018 [Reference Etherington26], in which riders have to walk to an efficient pickup location, in exchange for a cheaper fare, and share the ride with other passengers to drop off locations that are close to (but not exactly) their destinations. It was followed by a similar service by Lyft called Shared Saver in early 2019 [Reference Hawkins27].
It is important to keep in mind the above chronology of events in the development of ridesharing services when reviewing the literature in the next section, as some of the studies span a certain period of time.
8.3 Is Ridesharing a Solution or a Concern?
Early studies about ridesharing platforms mostly promoted ridesharing services as having the potential to improve the overall efficiency of the transportation system by reducing the idle capacity of vehicles. Data from the National Household Transport Survey (NHTS) [28] show that during the period April 2016 to March 2017 about 94 percent of personal vehicles in Massachusetts were idle (parked) 94 percent of the time (see Figure 8.3). Platform-based ridesharing held the promise of using some portion of this idle capacity, thereby contributing to the overall economy. These early studies also proposed the idea that app-based ridesharing services may reduce road congestion and carbon emissions in metropolitan areas, primarily by increasing capacity utilization in each trip [Reference Li, Hong and Zhang29, Reference Li, Hong and Zhang30]. These studies showed that a significant level of ridesharing adoption would have considerable benefits for reducing traffic and CO2 emissions.

Figure 8.3 Distribution of active time percentage of personal vehicles in Massachusetts from April 2016 to March 2017.
However, as the early fascination faded and people experienced the new system, some reports suggested that ridesharing services such as Uber may be actually contributing to congestion instead of decreasing it [Reference Rayle, Dai, Chan, Cervero and Shaheen31], while other reports were inconclusive [Reference Merrill and Coote32]. These studies, and highly publicized challenges such as the feud between Uber and New York City [Reference Flegenheimer33, Reference Flegenheimer34] and the lawsuits that Uber faced in recent years which resulted in bans on Uber’s operation in many cities and countries around the world [35, Reference Rhodes36], initiated the idea of regulating the industry. Policymakers around the world considered a broad range of regulations, including a cap on the number of operating vehicles, a limit on the growth rate of these platforms in a city, a ceiling on surge pricing,Footnote 6 as well as zoning restrictions and congestion pricing. These almost contradictory studies, along with the regulatory efforts and legal challenges backed by municipal and governmental administrations and taxi companies around the world, sparked a debate on the true impact of ridesharing services on urban congestion and the necessity of further regulations and policies.
This section summarizes the arguments and research findings that either claim ridesharing services have helped mitigate congestion and pollution problems or suggest that instead they are contributing to these problems.
8.3.1 Ridesharing as a Solution
The main argument claiming a positive impact from ridesharing services is based upon the notion that modern ridesharing at its core is a way of carpooling or carsharing. Indeed, before the rise of app-based ridesharing services, the concepts of carpooling and ridesharing were almost synonymous. Thus, consistent with the generally positive understanding of the impact of carpoolingFootnote 7 and carsharing,Footnote 8 it was expected that ridesharing services should also provide some savings in vehicle miles traveled (VMT),Footnote 9 CO2 emissions, travel time, and travel/fuel cost.
Not surprisingly, early studies of what we now recognize as app-based ridesharing services were a natural progression from carpooling studies. Most such studies assumed a dynamic ridesharing system in which trips could be coordinated between people with similar itineraries and scheduled on short notice (a few hours to a few minutes in advance) or even in the course of the trip [Reference Gruebele41–Reference Amey, Attanucci and Mishalani45]. For example, Agatz et al. [Reference Agatz, Erera, Martin, Savelsbergh and Wang43] propose an optimization approach for the problem of matching drivers and riders in real-time.Footnote 10 The appearance of the concept of dynamic ridesharing coincided with the rise of app-based services and created a new branch of research in the quest for designing more efficient transportation systems regarding different criteria including congestion.
Another classic body of research on platform-based ridesharing services is the well-known pickup and delivery problem (PDP). In PDP, a single vehicle, or a fleet of them, has to visit pickup locations to pick up goods or people and drop them off at delivery locations while minimizing the total distance or cost of all the routes. PDPs have many different varieties. The dial-a-ride transit service discussed earlier is a special example of this problem. Dynamic one-to-one multiple vehicle PDPs relate directly to ridesharing services. Here, the service is provided by a fleet of vehicles serving customers’ requests that are initiated on a dynamic basis, originated at one location, and destined for another.Footnote 11 Most studies of PDPs focus on logistics and cost minimization rather than on congestion-related aspects. Among the relevant studies, Wang et al. [Reference Wang, Dessouky and Ordonez50] show that in the presence of congestion and high occupancy vehicle (HOV) lanes and existing policies of discounted toll rates on HOVs, taking detours to pick up additional passengers, that is, sharing the ride, and using HOV lanes can reduce the cost of a ride as well as the travel time (thereby reducing congestion and emissions).
The true shared services such as Uber Pool and Lyft Line were built upon this rich literature of PDPs. Uber’s then CEO Travis Kalanick once described Uber Pool as a major evolution of Uber’s business model:
Two people taking a similar route are now taking one car instead of two. And when you chain enough of these rides together, you can imagine a perpetual trip — the driver picks up one customer, then picks up another, then drops one of them off, then picks up another. [Reference Anand51]
Because of this pooling and sharing of rides, initially, there was great hope and expectation for ridesharing services, as a revolution in urban mobility, to reduce congestion in addition to increasing consumer welfare. To analyze this, Li et al. [Reference Li, Hong and Zhang29, Reference Li, Hong and Zhang30] conduct a difference-in-difference (DID) analysisFootnote 12 with travel time index (TTI),Footnote 13 commuter stress index (CSI),Footnote 14 and delay as primary dependent variables to measure the impact of Uber on congestion in 101 urban areas. They conclude that Uber’s entry into these urban areas significantly reduced congestion. Hall et al. [Reference Hall, Palsson and Price52] also use a difference-in-difference analysis on a data set of transit ridership in U.S. metropolitan areas from 2004–2015 to show that Uber has had a complementary effect to public transit, suggesting a potential to reduce congestion, and that its effect on the increase in mass transit ridership grows over time. They also conclude that Uber’s biggest complementary effect is on the public transit system that had the smallest ridership before Uber’s entry. The article, while having a generally positive view on ridesharing services, does not directly study Uber’s impact on congestion but raises a speculative concern that an increase in ridership might lead to increased traffic and suggests that it needs further investigation. Furthermore, a study [2], conducted by the Office of the Mayor of New York City, shows that most of the increase in app-initiated rides in New York City during 2014 and 2015 were substitutions for rides in yellow cabs and thus did not contribute to the observed increase in total VMT (or VHT) and congestion during that period. Similar to the study in New York City, a study using data from Boston [Reference Alexander and González53] found that under moderate to high adoption rate scenarios, ridesharing is likely to result in a noticeable decline in urban traffic and congested travel times. These studies make the case for supporting policies that promote the use of ridesharing services to reduce congestion.
8.3.2 Ridesharing as a Concern
Despite the expected positive effects of ridesharing services on congestion, more recent studies have suggested that there might also be some rebound effects, that is, the reemergence of congestion in another form. These rebound effects include modal shift,Footnote 15 induced traffic,Footnote 16 deadheading,Footnote 17 encouraging car usage, and relocation of people further within metropolitan areas. While it is expected that ridesharing reduces the number of vehicles on the road, as well as total VMT and CO2 emissions, it may also make people more accustomed to car usage and result in mode switching from public transit or other nondriving modes to cars in the short-term. In the long-term, ridesharing could cause people to relocate further away from metropolitan centers, thereby adding to congestion and pollution. It was mentioned in the last section that the New York City’s report [2] exonerated the app-based ridesharing services from contributing to the observed increase in traffic congestion during 2014 and 2015. However, it warned against the potential of rapid growth in e-hailed rides in the future, leading to a decrease in public transportation trips, which in turn would increase total VMT (or VHT). A ride switched from a yellow cab to a ride-hailing service has a chance of being a shared ride; therefore, generally, this type of switch will decrease congestion and pollution. However, a switch from public transportation to ride-hailing would have a detrimental impact on congestion; the report suggests that a switch in less than 1 percent of public transit rides is enough to offset the congestion mitigation earned by an 11–13 percent switch in yellow cab trips.
The studies that suggest ridesharing services contribute to congestion usually focus on one or some of these rebound effects and try to analyze their offsetting or negating impact on the savings gained by shared rides. For example, Yin et al. [Reference Yin, Liu, Coulombel and Viguie54] use an integrated land-use transport model to investigate the environmental impact of carpooling in the Paris region taking into account the impact of rebound effects. They conclude that under long-term scenarios for 2030 the rebound effects of ridesharing decisions will cut the expected CO2 emission savings of carpooling substantially. For short-term scenarios, similar results are obtained by a study [Reference Rayle, Dai, Chan, Cervero and Shaheen31], which conducted an intercept surveyFootnote 18 in three spots in downtown San Francisco during May and June of 2014 mostly concentrated on nighttime and social trips. Among the results are observations about induced travels and transportation mode substitution where passengers were asked if they would make the trip and how would they do it had they not used the ridesharing services. The survey shows that if ridesharing services were not available, about 8 percent of the respondents would not have made the trip. Among the rest, about 39 percent would have taken a taxi, 33 percent would have used public transit, 8 percent would have walked, 2 percent would have used a bike, 8 percent would have used their own car, and 1 percent would have shared a ride with a friend or family member. This means about half of the respondents would have either not taken the trip or would have used a nondriving mode for their trip. This is also confirmed by a recent longitudinal analysisFootnote 19 using monthly transit ridership data from twenty-two transit agencies and four modes of transportation (commuter rail, heavy rail, light rail, and motorbus) across major U.S. cities that shows that in fact, ridesharing services after entering a market draw passenger from heavy rail services by 1.3 percent per year and bus services by 1.7 percent per year [Reference Graehler, Alexander Mucci and Erhardt55].
Similarly, a survey of nearly 1,000 ride-hailing passengers in the Boston metropolitan area in late 2017 [Reference Gehrke, Felix and Reardon56], conducted by Boston’s Metropolitan Area Planning Council (MAPC), finds some concerning facts. It indicates that if ride-hailing services had not been available, approximately 42 percent of passengers would have taken a train or a bus for their trip, 12 percent would have walked or biked, 5 percent would not have made the trip at all, and the remaining 41 percent would have used a personal vehicle or taken a taxi. This means 59 percent of all ride-hailing trips in this survey were contributing to the total VMT and thus overall congestion. The 42 percent substitution from public transit trips is particularly alarming! A similar study [Reference Clewlow and Mishra57] considers seven major U.S. cities from 2014 to 2016. The results show that if TNC services were not available, 49 percent to 61 percent of TNC trips either would not have been made at all or would have been made using a nondriving mode (transit, bike, walk). It also suggests that ridesharing services reduce the ridership from bus and light rail services but have a complementary effect on commuter rail services. Confirming these results, a 2018 study [Reference Schaller58] shows that ridesharing services have added 2.6 new vehicle miles on the road for each mile of personal driving removed, a 160 percent increase in driving on city streets of nine large, densely populated metropolitan areas (New York, Los Angeles, Chicago, Boston, San Francisco, Miami, Philadelphia, Seattle, and Washington DC). In these cities, about 60 percent of users of ridesharing services would have taken public transportation, walked, biked, or not made the trip if these services had not been available, while 40 percent would have used their own car or a taxi. The study suggests that in most cases, the ridesharing services are targeting the same customer base as public transportation, just as the New York City warned in 2015.
There are also other studies that suggest an increase in congestion without delving into the reasons behind it. For example, a report [59] prepared by the London Assembly, names ridesharing services as one of the factors contributing to congestion in London. The report shows that there has been a 70 percent increase in the number of registered ridesharing vehicles between 2012 and 2017. In 2017, private hire vehicles, with a sharp increase since 2013, accounted for 38 percent of total car traffic volume in London’s congestion charging zone; this is roughly double the proportion of taxis, which is a remarkable growth in less than five years for an already congested city. Likewise, Schaller [Reference Schaller60] presents the results of a study on TNC ridership data in New York City from June 2013 to June 2016. Most notably, he shows the following: 1) the introduction of pool options such as Uber Pool and Lyft Line in TNCs helped ridership to grow faster than the number of licensed vehicles (i.e., higher utilization for TNC cars); 2) the net increase in ridership of hire vehicles due to the growth of TNCs in three years was 52 million passengers, 31 million trips, and 600 million miles; and 3) the net mileage increase due to the ridesharing services was 3.5 percent of the city’s total VMT while this percentage of total VMT for Manhattan was more than two times larger. This is a significant increase in VMT in an already congested area.
A similar report about New York City, Shcaller [Reference Schaller61] illustrates a 59 percent increase in hire vehicle hours in the central business district (CBD) between 2013 and 2017. The increase in weekday mileage of these vehicles in the CBD in the same period was lower at 36 percent due to slower vehicle speed – the overall traffic speeds declined by 15 percent. As passenger trips with taxis declined, the trips with ridesharing platforms increased but at a higher pace; the net increase in passenger trips with hire vehicles was 15 percent during this period. It is also notable that the unoccupied hire vehicle hours increased by 81 percent versus a 48 percent increase in occupied hours during these four years. Similarly a study of Denver, Colorado [Reference Henao62] surveys 416 rides of 311 passengers of Uber and Lyft and performs a before-and-after analysis.Footnote 20 Among the various results, it demonstrates that with the introduction of ridesharing services the ratio PMT/VMT has dropped from 112.3 percent to 60.8 percent and the overall VMT increased by 84.6 percent, both suggesting an increase in congestion.
More recently, a 2019 study [Reference Erhardt, Roy, Cooper, Sana, Chen and Castiglione63] claims that TNCs are the biggest contributor to congestion in San Francisco. The study conducted a before-and-after analysis and was based on a data set scraped from the application interface of Uber and Lyft in 2016 and was combined with San Francisco’s travel demand model, SF-CHAMP, to control for background factors that may also impact congestion. The study shows that the average speed decreased from 25.6 miles per hour (mph) in 2010 to 22.2 mph in 2016 and that the vehicle hours of delay (VHD) increased by 63 percent over the same period. A 2020 study in Santiago, Chile [Reference Tirachini and Gomez-Lobo64] uses a Monte Carlo simulation method and shows that ride-hailing services increase the total vehicle kilometers traveled (VKT) unless the average occupancy rate is significantly increased by actually sharing/pooling the rides.
All these studies were conducted while the ridesharing services were present in the regions of study. Among them, some relied on a before-and-after comparison to obtain a better understanding of their impact on congestion after they entered those regions. However, even such before-and-after analyses may not be adequately conclusive as the comparison is done over a long period, usually several years. A very recent study [Reference Agarwal, Mani and Telang65] takes an interesting and different approach, and yet suggests similar conclusions. It focuses on the city-wide strikes by drivers for these services as exogenous shocks in three major Indian cities (Mumbai, New Delhi, and Bangalore). It implements a regression analysis to study the impact of ride-hailing services on traffic congestion. It suggests the conclusion that congestion was reduced during these strikes as much as 40–53 percent of the reduction observed during a typical holiday. It also reports a public transport substitution effect suggesting that ride-hailing services were drawing passengers from mass transit.
8.3.3 Analysis of the Discrepancies in the Results
As has been demonstrated in the previous sections, the existing studies on the question of whether TNCs contribute to congestion have conflicting results. Because these studies are mostly empirical, statistical, or simulation-based, they naturally inherit some degree of uncertainty due to the methodologies. However, as the remainder of this section discusses, several avoidable factors are contributing to the inconsistency of the results.
Missing Factors: The studies discussed earlier are not always comprehensive in terms of the factors they consider. For example, in Schaller’s report [Reference Schaller61], a fraction of the reported 15 percent net increase in passenger trips with hire vehicles could be associated with other factors such as population growth, replacement of personal car usage, and deadheading. Although it is clear from the metrics used in this report alongside those in his earlier report [Reference Schaller60] that ridesharing services had contributed to the overall traffic volume in the CBD during 2013–2017, the magnitude of this contribution could be different if one would include those factors in the study. The New York City’s report [2], on the other hand, accounts for the TNC rides that are replacements of the use of private vehicles, but this report also does not account for the population growth or deadheading. The exclusion of certain critical factors from these studies could be the source of some of the disparities between the results.
The Scale of Truly Shared Rides: Another factor that leads to inconsistent results is the misunderstanding of the true scale of sharing in different cities. An advocate of ridesharing services may argue that the studies that view ridesharing services as a source of congestion are not fully capturing the full effect of sharing rides, and if we properly account for all shared and pooled trips the conclusion might be different. However, according to a recently published data set [66], on average, only about 13 percent of Uber rides in New York City in 2019 were actually shared; the number for Lyft was 24.7 percent. Figure 8.4 shows the monthly percentage of shared trips in New York City for Uber and Lyft – as the two currently dominant ride-hailing companies there. The charts show that the maximum percentage has never exceeded 30 percent for either of them (28.6 percent for Uber and 28.5 percent for Lyft). They also show a divergence between the two service providers which could be due to their different ride options and pricing schemes. The fact that Uber’s percentage is declining is a matter of concern as Uber had more than three times as many rides as Lyft in the same period. The weighted average of their combined percentages of shared trips in 2019 was just 15.7 percent of all trips. Misunderstanding the real scale of shared rides in the ridesharing services, which may lead to wrong assumptions, or missing to control for this factor can explain some of the inconsistencies between the results in different studies.

Figure 8.4 Percentage of shared trips in New York City for (a) Uber, and (b) Lyft.
Adequacy of Data: Availability of data, the type of available data, and the sample size can have an enormous impact on the way these studies are conducted and on their results. For instance, the data used by Erhardt et al. [Reference Erhardt, Roy, Cooper, Sana, Chen and Castiglione63] does not capture shared trips, and in any sequence of pickups and drop-offs, it only takes into account the first pickup and the last drop-off and none of the stops in between. Moreover, the first pickup location is not exactly the passenger’s location but rather the point at which the driver accepts the new order. This is because the data were collected by a tracing system that would only track out-of-service TNC vehicles. The study’s dependence on this data set may skew the results towards the conclusion that ridesharing services contribute to congestion, as it leaves the main congestion reducing force of these services, namely shared rides, out of the analysis.
Choice of Congestion Metric: It appears that the choice of the congestion metric has a big impact on the result of the study. For example, TTI and CSI are used by Li et al. in [Reference Li, Hong and Zhang29, Reference Li, Hong and Zhang30]. Both TTI and CSI are very good at measuring commuting-related congestion but may not be accurate measures for the overall ridesharing-related congestion observed in a city as they are merely based on two snapshots of peak time and free-flow time. As another example, Clewlow et al. [Reference Clewlow and Mishra57] mention that 49 percent to 61 percent of “trips” would have been either avoided or made by a nondriving mode such as walking, biking, or transit. However, it does not study the translation of this increase in the number of car-based trips into actual additional VMT or VHT, thus making it hard to realize the significance of this change.Footnote 21
Availability of Services: Availability and the existing usage levels of public transit, carpooling, carsharing, and shared bikes in a city might have a considerable impact on the type of service that riders would receive from TNCs. For example, a high level of carpooling adoption in a city may shift TNC rides more towards nonshared ones. Consider two studies focusing on two cities, one with a high level and another with a low level of public transit and carpooling. Assuming that there are no modal shifts, the rides in the latter are expected to have a higher percentage of shared rides. This combined with a choice of congestion metric like the ratio PMT/VMT could give us inconsistent conclusions on the congestion contribution of ridesharing services in these two studies. This would also lead us to the next attribute, that is, the spatial differences of these studies.
Spatial Differences: Most existing studies are limited locally while making conclusions globally. A local study may not give us the overall picture of the impact on traffic congestion in a country. Further and more comprehensive studies would be required to find out the global impact of ridesharing services on congestion. However, when making policies, as will be discussed more in the next section, it is generally better to rely on local studies with local conclusions. The results from a dense and populous city may not translate to a small town or vice versa, as both supply and demand sides of a ridesharing market in a large city are vastly different from that of a small city. The number of active ridesharing services in a city and the number and percentage of people using them can have a tremendous impact on the number of shared rides. Moreover, many other factors such as accessibility of public transit, demographics, and geography also play a role and force policymakers to rely mostly on local data and analyses. Therefore, the locational differences in cities that were the subject of the existing studies could help explain the difference in their results.
Temporal Differences: Similarly, collecting data or surveying trips at different times of the day or different days of the week may skew the analysis. For instance, the intercept survey used by Rayle at al. [Reference Rayle, Dai, Chan, Cervero and Shaheen31] is heavily weighted towards Downtown San Francisco’s social hot spots, where parking for a personal vehicle is a big problem, and in the evening when public transit is less frequent and people are more inclined towards taking a TNC vehicle to avoid driving under the influence. Furthermore, the effect of TNCs on congestion could vastly differ from one year to another. Consider four studies that rely on data from the following periods (as some of the studies discussed above do): 2014,Footnote 22 2014–2015, 2015–2016, and 2016. One should not expect consistent results from these four studies as the industry evolved dramatically during this period. For example, New York City’s report [2] suggests that TNCs did not contribute to the observed increase in congestion in New York City during 2014 to 2015 but could contribute to congestion in a significant way in the future if they draw passengers from public transportation. One year later, Schaller [Reference Schaller60] suggests that the net mileage increase due to the ridesharing services from 2013 to 2016 is 3.5 percent of the city’s total VMT. The exponential growth of TNC services during 2015–2016 could explain these seemingly different results. When the underlying subject is doubling in size every year, it would not be surprising if these studies come to different conclusions.
8.4 Policy Measures to Reduce Congestion
As mentioned in the previous section, the answer to the question of whether ridesharing services have a positive or negative impact on congestion depends on the location and the time. If at the local level in a certain region and a certain period a negative impact is observed, it is necessary to devise policy measures for controlling or mitigating this impact. This section reviews some of these measures, focusing just on policy responses that can directly mitigate congestion caused by ridesharing services. Despite some overlaps, other sources of traffic congestion may require different measures.
Infrastructure Expansion: Adding more roads, tunnels, bridges, subway/bus lines, and bike lanes can provide a long-term solution for the congestion problems caused by ridesharing services, as can expansion of the city towards the outskirts. However, these options require an increase in taxation to finance infrastructure projects, which is not always politically popular. Also, in many cases cities may face geographic barriers for expansion, and even if the expansion is possible it may not resolve the congestion issue in downtown areas and business districts. This pushes the cities to rely on more short-term solutions such as designing restricted traffic zones and congestion pricing [Reference Santora67, 68].
Restricted Traffic Zones: Restricted/limited traffic zones (RTZs or LTZs) are areas within a city where entry to these zones requires permission and may be subject to a fee. Entry to such zones could also be limited to certain hours of the day or certain days of the week, or for certain types of vehicles or groups of people (such as residents, public workers, and disabled motorists). LTZs are very common in Italian cities such as Rome, Florence, and Milan. In many cases, LTZs are complemented with either pollution charges or congestion charges. Odd-Even Zones (OEZs) apply similar restrictions to odd or even license-plate numbers during the weekdays. Tehran and Beijing are notable examples of the implementation of this policy. Tehran is particularly interesting, as its use of this practice dates back to late 1979 and it implements concentric layers of OEZs and RTZs together [Reference Salarvandian, Dijst and Helbich69].
Zero-emission Vehicles Zones and Pollution Charges: To promote electric and environmentally clean vehicles in congested urban areas, cities can design zero-emission zones (ZEZs) or low-emission zones (LEZs) in which only electric vehicles or ultra-low emission vehicles could travel. An alternative for cities with medium congestion or pollution levels is to impose a pollution charge in specific areas of the city on vehicles that fail to meet certain standards. This would reduce pollution as well as the traffic volume in such areas. Milan’s Ecopass System [Reference Martino70] is a prime example of this policy.
Congestion Pricing: Congestion pricing is the practice of charging a flat or variable rate fee to vehicles that drive in a specified zone within a city to reduce traffic and pollution in that zone. There are multiple successful cases of this policy around the world. A report prepared by the Center for City Solutions [71] reviews the results of congestion pricing in Singapore, London, and Stockholm. With its Area Licensing Scheme (ALS) designed in 1973, and updated with an Electronic Road Pricing (ERP) system in 1998, Singapore is perhaps one of the leading cities in the world in designing a congestion pricing scheme to solve traffic issues caused by rapid economic development and geographic restrictions. Singapore’s congestion pricing scheme resulted in a 24 percent decrease in inner city traffic, 6 mph increase in average vehicle speeds, 15 percent increase in public transit ridership, and 10–15 percent reduction in greenhouse gas emissions in the inner city. In London, congestion pricing resulted in a 9.9 percent reduction in traffic between 2000 and 2015 despite a 20 percent increase in population; it also added 30 percent to average vehicle speeds and 8.5 percent to the city’s transportation revenue. In Stockholm, despite population growth, the traffic volume decreased by 22 percent, VMT declined by 16 percent and 5percent for the inner and outer city respectively, and the government had net earnings of $143 million per year. Milan’s Area C program is another successful example of congestion pricing that within two months of implementation delivered a 36 percent decline in commercial and private traffic, a 50 percent decrease in accidents, an 11 percent increase in average vehicle speed, and a 24–45 percent cut in greenhouse gas emissions [Reference Martino72]. Despite the lack of a successful case in the United States, the concept of congestion pricing or zone pricing is not new to U.S. cities, as there have been multiple attempts to establish such systems in cities such as New York and San Francisco [Reference Elinson73]. New York is set to be the first city in the United States to adopt a congestion pricing policy. In 2017, Governor Andrew Cuomo announced his plan to impose a fare on traffic in Manhattan’s CBD (south of 60th street) to both reduce traffic and raise funding to fix New York City’s failing public transit system [Reference Santora67]. A similar attempt in 2008 led by Mayor Michael Bloomberg to charge $8 on entries to the most congested parts of Manhattan failed to gain the support of other boroughs [Reference Confessore74]. The new three-phase plan was finally approved by the state in 2019 [Reference Durkin and Artauni75] and the first two phases are already implemented, including $2–5 per trip surcharges for for-hire vehicles in the congestion zone. The third phase, which involves congestion pricing for all entries to the CBD, was scheduled to be implemented in January 2021. It is now scheduled for late 2023. If the initial estimates of entry fees – $11.52 for cars and $25.34 for trucks [Reference Sankar76] – are implemented, it is expected that the annual revenue from the plan will exceed $1 billion, which could be spent for the revival of public transit infrastructure. The plan’s third phase is pending approval from the Federal Highway Administration (FHA) [Reference Berger77]. However, it is unclear how much this program would reduce the congestion caused by TNCs in Manhattan, as about half of their trips in the CBD zone start and end within that zone [Reference Schaller60].
Capping Number of Hire Vehicles and Limiting Zones of Operation: In some cities, limitations on the number of taxicabs and their operation areas are already in place. For example, in New York City, restrictions on the number of yellow and green (Boro) taxicabs and service zone limitations for green cabs have been in place for many years. Green cabs are only allowed to operate in upper Manhattan and the outer boroughs [Reference Mann78]. This helps cities in many ways, including by ensuring equity and access to reliable transportation in underserved areas of the city, facilitating fair competition and leveling playing fields, making the urban transportation sector economically sustainable while keeping fares affordable, and mitigating congestion in certain areas. Similar measures can be applied to ridesharing services by defining areas of operation for each TNC or putting a cap on the number of TNC vehicles in the entire city or certain areas within the city.
Learning from the Popularity of TNCs: It might be the easiest approach for policymakers to suppress TNCs with different measures or to impose outright bans on them to mitigate the congestion caused by them. However, policy choices ultimately boil down to satisfying customers’ needs one way or another. As mentioned in the historical review section, water wherries would have had a better outcome if they had focused on improving their service rather than fighting with hackney coaches. This is why the National Association of City Transportation Officials recommends encouraging taxi companies to adopt new technologies for staying competitive [79]. Focusing on the reasons that made platform-based ridesharing services very popular and mimicking them in other ride services such as taxis, buses, and trains can immensely improve the quality of rides passengers receive from those services. These reasons include, but are not limited to, providing additional information to the rider on the app and thus reducing uncertainties, enhancing the convenience of paying fares, providing broader spatial and temporal access to TNC vehicles, charging attractive prices relative to the convenience of the trip, reducing wait times, increasing the convenience of leaving a review for the ride experience, and more generally satisfying a younger and more technology-friendly generation by providing a more technology-friendly experience. For example, the additional information provided by a TNC app, such as GPS data, origin–destination route, estimated time of arrival, and travel time, can significantly reduce the uncertainties of a trip. One could imagine the stress and anxiety associated with making an appointment and relying on public transportation without too much buffer time. City transit authorities can incorporate many of these features into other modes of transportation, making them more popular and efficient. This can particularly reduce the number of riders that switch from public transport (the least convenient experience) to TNCs (the most convenient experience), thereby mitigating congestion.
8.5 Research Gaps & Future Directions
A complete answer about the impact of ridesharing services on traffic congestion requires more comprehensive, multifaceted, multidisciplinary research. This section discusses some of the research gaps, opportunities, and directions for further investigation of this question.Footnote 23
Traffic Zoning: One important research opportunity concerns the design of optimal RTZs, OEZs, ZEZs, and LEZs. For example, there is a lack of research on the use of geographic optimization methods to reduce congestion. Computational geometric approaches when combined with optimization methods could be very helpful to policymakers in designing such zones in a city and solving the related utility optimization problems. Geographic optimization methods can find the optimal boundaries of the zones and the optimal pricing for permit fees in each zone and can balance the traffic between the zones.Footnote 24
Congestion Pricing: If New York City’s congestion pricing plan goes into full implementation, it may soon be followed by San Francisco, Los Angeles, Chicago, and other big cities in the United States. This provides a research opportunity for helping especially urban policymakers to find the optimal entry fees and surcharges for ridesharing services as a mechanism to control traffic volumes generated by these services.Footnote 25
Micromobility Services: One of the policy measures discussed in the last section was the expansion of transportation infrastructure, which includes bike lanes and shared bike terminals. This could be generalized to almost all micromobility services. City bikes and shared electric scooters can be efficient and green alternatives to private cars and ridesharing services, despite shortcomings such as the seasonal nature of these options. Their relatively low costs (in both initial investment and usage fare), high accessibility, and ease of use makes them strong competitors to the currently dominant modes of urban mobility. The significance of these services can also be seen in the rapid growth of micromobility companies such as Lime and Bird in the last three years and the recent focus of ridesharing companies such as Uber and Lyft on offering these services. However, many cities are not ready for this new trend: Public bike-sharing stations and the allocation and reallocation of bikes between the terminals are not well-optimized; many cities do not have an adequate number of dedicated lanes for bikes and scooters; and scooter businesses are not regulated. A comprehensive and interdisciplinary study of micromobility systems is necessary and urgent. This necessity and urgency can be seen by, for example, the big surprise and chaos that communities, city officials, and transportation authorities faced by the sudden emergence of electric scooters in the technology-friendly cities of San Francisco and Los Angeles [Reference Matthews82, Reference Newberry83].
Elimination of Cruising for Parking: An aspect missing in current studies on the impact of ridesharing on congestion is the impact of cruising for parking by personal vehicles. As Shoup [Reference Shoup84] suggests, on average and over the long term, approximately 30 percent of traffic is due to such cruising. If a TNC trip replaces a trip that would have been made by a personal vehicle, it not only replaces the personal vehicle mileage for the distance between the origin and destination of the trip but also removes the potential need to cruise for parking and its additional VMT (VHT). This could reduce congestion and thus warrants further study.
Self-driving/Autonomous Vehicles: It is notoriously difficult to achieve an equilibrium in a dynamically changing two-sided market and even harder to maintain it. Any such equilibrium state will be short-lived, as the supply (drivers) and demand (riders) are steadily changing. It will also be very sensitive to any change in the decision-making parameters such as ride fare, waiting time, and travel distance. Moreover, the whole system is also prone to short- and long-term exogenous events such as sports events, gas prices, local mass layoffs, and new regulations. Therefore, the platforms inevitably have to move towards reducing the uncertainty on the side they have more control over, which is the supply side. This leaves TNCs with three options: 1) using significant incentives to make the supply side more predictable; 2) hiring a fraction of drivers as employees with a predetermined working schedule, adding a layer of certainty to the supply side; or 3) deploying a fleet of self-driving/autonomous cars to constitute a fraction of the supply. The first option is currently being implemented with much difficulty and very little success for a variety of reasons including competition with other platforms that may provide better incentives or the unpredictability of human behavior when faced with incentives. The second option is unlikely to be followed, as the currently active ridesharing platforms such as Uber and Lyft have gone through many legal challenges to avoid the costs of treating their drivers as employees. However, the third option appears to be promising. A simulation model by Fagnant and Kockelman [Reference Fagnant and Kockelman85] shows that each shared autonomous vehicle can remove up to 11 conventional vehicles from the streets while adding only up to 10 percent to the VMT due to more deadheading. This could simultaneously make the planning easier for TNCs and mitigate the congestion issue for cities,Footnote 26 More studies are required to better understand the magnitude of its mitigating impact on congestion.
Large Cities versus Small Cities: Due to network effects and the large population in major cities, it is expected that a significant number of people use ridesharing services just because people in their social network use them and not necessarily out of a need. This could have an immense impact on congestion. Moreover, due to the large market size in big cities, competitor companies have more time to enter the market and gain a share after the first TNC’s entry and to enjoy the network effect in their growth. Soon there will be several TNCs active in the city competing with each other in a race to the bottom by providing more and more incentives for the drivers. This may lead to an oversupply of drivers deadheading or offering very cheap fares to customers, thereby encouraging mode switches and causing induced traffic. Ultimately, these effects could contribute to congestion from both sides of the market. In contrast, small cities are more likely to have a monopoly or something close to that as the first TNC can grab the entire market quickly after its entry, making it extremely hard for any competitor to enter that market or efficiently compete there. Any new competitor would have to reach a critical mass or a significant number of drivers and riders to remain operationally sustainable. A monopoly in the ridesharing market in small cities could lower the congestion by reaching equilibrium more efficiently and increasing the number of shared trips. A game-theoretic approach might be fruitful in analyzing these two different situations.
Impact of E-commerce on Traffic Congestion: A meaningful portion of the recent increase in congestion observed in metropolitan areas could be due to the massive increase in the movement of commercial trucks after the boom in e-commerce. It is worth investigating the impact of e-commerce on traffic congestion. It appears to have a sizable impact (maybe bigger than that of ridesharing) on congestion, especially during the COVID-19 pandemic as people tended to do most of their shopping online. There has been very little attention in the literature to control for this significant factor. Studying the congestion impact of ridesharing services and e-commerce activities together could be very valuable, leading to more accurate conclusions.
Integrated Urban Mobility Systems: It is notable that the complementary effect that ridesharing services have on public transit, by improving first and last mile access especially for the longer distance services such as commuter rail [Reference Stiglic, Agatz, Savelsbergh and Gradisar86], has not gained much research attention. A similar statement can be made about the impact of ridesharing services on parking spaces. To prevent ridesharing services from taking public transit’s market share, we may find interesting solutions in measures such as integration of ridesharing databases with that of public transit, putting a quota for each ridesharing company or a limit for all of them combined, data-driven and geographic-based pricing, and taxation of rides originating in the vicinity of transit routes excluding those trips to or from a transit station. An interdisciplinary approach to develop a framework, along with models and methodological tools for analyzing problems arising in this field, could be a powerful approach to tackling this and other similar research questions, leading to more effective policies.
Comprehensive Study: A negative externality such as congestion (pollution) is just a small piece of a big puzzle. Policymaking in this area requires a holistic view. No matter how harmful ridesharing might be in one aspect, such as congestion, it may have greater benefits for society in other aspects. For example, a collaborative study between Uber, the University of Oxford, and the University of Chicago [Reference Cohen, Hahn, Hall, Levitt and Metcalfe87] shows that in 2015 Uber X in San Francisco, Los Angeles, New York, and Chicago rendered a total of $2.9 billion in consumer surplus. More independent research is needed to understand the overall socioeconomic impact of ridesharing services better.
It would be ideal if future research could address the root causes of traffic congestion by designing comprehensive studies that control for more factors, ensure the adequacy of data, compare the most suitable (and possibly multiple) congestion metrics, and take into account the spatial and temporal differences.
Acknowledgment
The author acknowledges that the charts in Figure 8.1 are used with permission of the City of New York.Footnote 27
9.1 Introduction
The last few years have seen a tremendous growth of mobility companies, referred to as Transportation Network Companies (TNCs), such as Uber, Lyft, and Via, that have introduced a variety of on-demand services. TNCs have grown exponentially. It took Uber six years to reach its first billion rides but only six months to reach the next billion [Reference Schaller1].
The popularity comes with concerns about the impact of these services on congestion and traffic conditions in general. In 2018, there were 42,201,375 TNC rides starting in the Boston municipality, with an average of 68.3 rides per habitant. According to the Massachusetts Department of Public Utilities (DPU), rides increased by 21 percent from 2017 [2]. The San Francisco County Transportation Authority (SFCTA) reports that TNCs were responsible for half of the increase in congestion in San Francisco from 2010 to 2016 (while employment and population growth contributed the other half). The report also finds that TNC trips account for an estimated 25 percent of the total congestion in the city and 36 percent of delays in the downtown area. On a typical day, they add 170,000 vehicle trips and more than 570,000 vehicle miles traveled (VMT) (20 percent of all local daily VMT). TNCs contribute to congestion at all times of the day, especially in the evenings [3, 4]. Furthermore, in general, the fraction of rides that are actually shared is small, meaning that TNC services are operating, in principle, as taxi services with a ride arranged through apps. This actually adds extra mileage rather than reducing traffic, considering the mileage driving to pick up passengers. Schaller [Reference Schaller1] reported that the non-shared ride TNC services (UberX, Lyft) put 2.8 new vehicle miles on the road for each mile of personal driving removed, for an overall 180 percent increase. The increased congestion brings other negative externalities as well, for example, reduced safety. According to a study [Reference Barrios, Hochberg and Yi5], the rise of TNC services has increased traffic deaths by 2–3 percent in the United States since 2011, equivalent to as many as 1,100 fatalities a year.
TNC services also compete with sustainable modes of travel such as public transport, walking, and biking, while they are, in general, less competitive with personal automobiles. The main factors impacting mode-choice, such as price, speed, convenience, and comfort, result in shifting passengers to TNCs from public transport and nonmotorized modes rather than cars. Many surveys show that if TNC services were to disappear, about 60 percent of current TNC users would switch to public transport, walking, and biking (or not make the trip), about 20 percent would use their own car, and 20 percent would use a taxi [Reference Schaller1]. Many traditional public transport services have been recently experiencing a reduction in ridership, especially buses. This decline is partially attributed to direct competition from TNCs [6]. The Chicago Transit Authority (CTA), for example, is reporting that the decline in ridership is partly caused by competition from TNCs, like Uber and Lyft. Equally alarming is the decline in student ridership. The Metropolitan Transportation Authority (MTA) in New York reported a 12.7 percent decline in student ridership in buses in 2018 [7].
Despite their popularity and large market, on-demand mobility services are far from profitable. Uber reported an operating loss of $8.5 billion in 2019 after losing more than $3 billion the previous year [8]. This lack of profitability seems to be a characteristic of the on-demand mobility service industry. Currie and Fournier [Reference Currie and Fournier9] compiled a database of 120 systems, including traditional dial-a-ride, demand-responsive transit (DRT), and Microtransit, from nineteen countries since the 1970s. They found that most of the systems eventually failed (for example, 67 percent in the United Kingdom), and 40 percent lasted fewer than three years. High operating costs are the main contributor to their failure. The use of new technologies, such as apps and the mobile internet that enabled the recent developments, has not helped, with profitability, at least not yet. Results also show that services with simpler operations (for example, “many-to-few” systems, where trips may have many [any] origin locations but all go to one or very few destinations and vice-versa providing economies of scale) have lower failure rates, compared to the complex all-to-all services (where requests can have any origin location and can go to any destination location). Enoch et al. [Reference Enoch, Potter, Parkhurst and Smith10] also concluded that systems are often not properly designed and there is a tendency to offer too much flexibility, which increases costs.
Ride-pooling is a strategy that can address all of these concerns, regarding societal impacts (on congestion, traffic, and competition with public transport) and TNC profitability (operating costs and overall efficiency). Using taxi-trip data from New York City, for example, Santi et al. [Reference Santi, Resta, Szell, Sobolevsky, Strogatz and Ratti11] concluded that even if trips are shared by only two passengers, a significant reduction in total VMT can be achieved in dense metropolitan areas, such as Manhattan. Alonso-Mora et al. [Reference Alonso-Mora, Samaranayake, Wallar, Frazzoli and Rus12] showed that, if all trips are shared, 25 percent of active taxis in NYC can satisfy 98 percent of the ride requests with an average waiting time of 2.8 minutes and mean trip delay of 3.5 minutes. This represents a significant reduction in required fleet size and hence, improvement in efficiency.
Because of the potential of ride-pooling to improve operating efficiency and, at the same time, reduce the impact of TNCs on congestion, experts have begun developing approaches to increase the number of shared trips. These approaches include alternative operating models on one hand, and long-term strategic partnerships with other service providers, such as public transport operators, on the other, which can result in simpler operations and economies of scale [Reference Enoch, Potter, Parkhurst and Smith10].
This chapter discusses opportunities for on-demand mobility services to improve sharing performance as a means to improve not only operating efficiency but also environmental sustainability. It explores, empirically through a large TNC dataset, the potential of these approaches to reduce on-demand mobility impacts, especially from a sustainability point of view using metrics such as VMT (a good surrogate of congestion and environmental impacts). It examines the impact of various factors (such as the fraction of requests known in advance, the percentage of shared requests, and the level of service expectations). It also reports on the experience with field tests and other experiments of coordinated public transport/TNC services and highlights lessons learned.
9.2 Background and Definitions
The concept of on-demand transportation services is not new. The first experiments were carried out in Atlantic City, New Jersey, in 1916 and some form of on-demand, shared-taxicab services have existed in US communities since at least the 1930s. By 1974 there were approximately twenty systems operating in North America, often referred to as dial-a-ride, demand-responsive, and paratransit systems [Reference Kirby, Bhatt, Kemp, McGillivray and Wohl13] used to complement regular transit services. Dial-a-ride was introduced as a form of shared transport where passengers make reservations (typically a day in advance). Requests are organized in itineraries satisfying a certain level of service constraints (for example, maximum wait time from desired departure time). Vehicles do not have a fixed route or timetable. Systematic research into dial-a-ride started in the 1960s by researchers at the General Motors Research Laboratories, Massachusetts Institute of Technology (MIT), and Northwestern University. The federally funded project Computer-Aided Routing System (CARS) at MIT focused on all (operating) aspects of dial-a-ride from all points of view, including the development of computerized algorithms for optimal routing and scheduling [Reference Strobel14]. Wilson et al. [Reference Wilson, Weissberg and Hauser15] were among the first to explore the potential of computers to plan and control dial-a-ride systems. Their efforts resulted in algorithms to assign requests to the most appropriate vehicles. They also investigated the problem of integrated dial-a-ride and fixed route public transport services and coordinated dial-a-ride systems. They aimed to design effective hybrid systems, in which dial-a-ride serves low volume and short trips, fixed-route public transport serves high volume trips, and a coordinated fixed-route/dial-a-ride system serves long but low-volume trips [Reference Wilson, Weissberg and Hauser15]. Today dial-a-ride, referred to as paratransit or demand responsive, services are mainly offered by public transport agencies in order to comply with the 1990 Americans with Disabilities Act (ADA). Qualified individuals can make reservations through a centralized system to use the service to access medical facilities as well as locations of other activities.
Today’s mobility on-demand services (for example, Uber, Lyft, Via) are fundamentally app-based dial-a-ride services with centralized dispatching and flexible driver arrangements [Reference Currie and Fournier9], with most of the requests placed in real-time. These new services appear under various names; however, the terminology used to define them is often inconsistent. For this discussion, we mainly use the terminology introduced by the Society of Automotive Engineers, SAE [16] as summarized by:
1. Shared mobility refers to the shared use of a vehicle, scooter, bicycle, or other travel modes. Users have short-term access to the travel mode on an as-needed basis [Reference Pangbourne, Meyer and Shaheen17, Reference Cohen and Shaheen18]
2. TNC services (also called ridesourcing or ridehailing services) are prearranged or on-demand transportation services for compensation, in which drivers and passengers connect via digital apps that support booking, electronic payment, and ratings of the services.
3. Ridesharing is the formal or informal sharing of rides between drivers and passengers with similar origin-destination pairs. Ridesharing may include carpooling and vanpooling, where several passengers share the cost of using a vehicle, and in some cases, driving responsibility.
4. Ride-pooling, also known as shared TNC services that are organized on-demand, enables people to share a vehicle ride with others. UberPool, UberExpressPool, and Lyft Line are examples of ride-pooling services [19].
5. Microtransit is a privately or publicly operated, technology-enabled public transport service, that typically uses vans to provide on-demand or fixed-schedule services with either dynamic or fixed routing.
6. Demand-responsive transit (DRT), also known as demand responsive transport, flexible transport, or Dial-a-Ride Transit (DART), is a form of public transport where vehicles can alter their routes based on demand rather than using a fixed route or timetable [Reference Brake, Nelson and Wright20].
9.3 Increasing Shareability
Recognizing the need for and potential of ride-pooling, TNCs are adjusting their technology and operating models to deliver more shared rides. They increasingly focus on ways to promote ride-pooling, with services such as UberPool, UberExpress, and Lyftline, offered at reduced prices. In the first two months of LyftLine’s service in San Francisco, one-third of all Lyft rides were LyftLines [Reference Nagy21]. Lyft recently redesigned its app and is developing strategies to improve ride pooling [22]. New operational models to increase ride-pooling opportunities have also been proposed in the literature, such as meeting points at origins and destinations [Reference Stiglic, Agatz, Savelsbergh and Gradisar23] and transfer points to switch vehicles [Reference Masoud and Jayakrishnan24].
Studies in the literature also show that coordination and integration of TNC operations and regular public transport services [25–28] has the potential to be beneficial to both parties involved. For example, Fan and Zhang [Reference Fan and Zhang28] concluded that there are financial benefits in the integrated operation of public transport and shared mobility services in Santa Clara, through increased economies of scale. As a result, not only does TNC operating efficiency improve, but also there is a positive impact on the demand for public transport. There is strong evidence that public transport agencies and TNCs are interested in exploring the coordination between public transport and TNCs. Uber and Lyft have recently added public transport directions and fares to their apps [Reference Blumenthal29, Reference Hawkins30]. In Denver, riders can purchase public transport tickets via the Uber app [Reference Bussewitz31]. Google has plans to show in Google map the multimodal trip options that combine public transport and TNCs [Reference Carrasqueira32]. The service already provides directions to walk or drive to public transport. By adding on-demand services, the app can also support the option of using a ride to a public transport station. At the same time, various public transport agencies, such as the Greater Richmond Transit Company, are pursuing an integrated design of public transport and TNC services that can be mutually beneficial [Reference Goffman33].
Although TNCs have been heavily investing in improving and promoting their shared services, such as UberPool, ExpressPool, and LyftLine, the majority of trips are actually singly served. For example, Uber reported that only 20 percent of Uber trips are shared/pooled trips in the major cities where UberPool service is provided. Lyft estimates that 37 percent of the users in cities with a LyftLine option request a LyftLine trip, but the actual rides being shared is substantially lower (22 percent in New York City in February 2018) [Reference Schaller1]. Even in a shared ride, some portion of the trip may involve just one passenger (for example, between the first and second pick-up).
Several studies explore the factors impacting the potential for shared trips using real-world data. Tachet et al. [Reference Tachet, Sagarra, Santi, Resta, Szell, Strogatz and Ratti34] present a simple index that measures the potential for ride-pooling as a function of trip generation rates, the amount of trip delay time that is acceptable to passengers, average traffic speed, and city size. They show that various metropolitan areas (New York, San Francisco, Singapore, and Vienna) exhibit similar behavior in terms of shareability potential, indicating that the same operating strategies to increase shared rides could work in different metropolitan areas.
In general, the factors impacting the ability of ride-pooling services to attract and match ride pooling requests are both demand and supply related. Demand-related factors include customers’ willingness to share (demand for ride-pooling) and level of service (LOS) expectations (extra ride time, waiting for a vehicle, etc.). They also include spatiotemporal distribution of requests, which determines the opportunity to match ride pooling requests. Supply-related factors include market fragmentation (various mobility service providers operating independently), which impacts the sharing of information and service resources (leading to inability to match requests across TNCs). They also include operating strategies and partnerships to facilitate ride-pooling and take advantage of the available opportunities for pooling requests to the full extent (request matching, vehicle dispatching and rebalancing, etc.). The remainder of this section reviews these factors.
9.3.1 Customer Willingness to Share and LOS Expectations
Passenger willingness to share and tolerance for increased waiting and trip detour times (additional time due to sharing a trip compared to a direct trip) affect ride-pooling opportunities [Reference Santi, Resta, Szell, Sobolevsky, Strogatz and Ratti11, Reference Alonso-Mora, Samaranayake, Wallar, Frazzoli and Rus12, Reference Tachet, Sagarra, Santi, Resta, Szell, Strogatz and Ratti34–Reference Alonso-Mora, Wallar and Rus35]. While several existing studies explore the factors affecting the adoption of TNC services and the frequency of use [36–39], studies on the types of TNC services customers use and the factors impacting these choices are rather limited. In a recent TNC survey [Reference Zhou, Ma, Hirschmann and Lao40], respondents were asked about their TNC use frequency, the characteristics of their most recent TNC trip, and their willingness to share rides with others, wait for service, walk to a pick-up/drop-off location, and place requests in advance. The results show that 54 percent of the respondents prefer using the pool/shared services (for example, UberPool, LyftLine). Of the responders, 83 percent indicated that they would choose to walk to/from a pick-up/drop-off location for a discount, with 57 percent willing to walk more than 5 minutes. Furthermore, 75 percent of the respondents would also place requests in advance (at least 15 minutes ahead of their desired departure time). Users with higher income, age, and bike and car ownership tend to use TNC services less frequently. They also use pool services less. Lower-income, age, and no bike/car ownership groups, as well as groups with membership in sharing services (car/bike sharing), use TNCs more and also preferred pool services more than other groups [Reference Zhou, Ma, Hirschmann and Lao40].
9.3.2 Spatiotemporal Distribution of Requests
Current ride-pooling systems aim at pooling passengers with similar origin-destinations (OD) and departure times. In addition to the complexities of assigning a vehicle to several requests and designing a route plan that serves them most efficiently, pooling of trips with similar OD pairs and time frames, at its core, suffers from the spatiotemporal sparseness of real-time requests that could actually be matched [Reference Schaller1]. The spatiotemporal distribution of requests for shared rides and their destinations determines the potential that two or more requests could be matched and served efficiently by a single vehicle, given their pickup/drop-off time windows and locations. Requests with similar paths and time windows can be assigned to the same vehicle. Trip origins and destinations are generally spread over numerous OD pairs which makes it difficult to find passengers who have compatible OD pairs. Moreover, potential ride-pooling passengers should also have compatible departure times. The likelihood of finding passengers who are willing to take a shared ride and are heading in the same direction at the same time is rather low and has hindered the effectiveness of real-time ride-pooling. To increase the likelihood of shared rides, the radius of matching passenger origins or destinations could be increased, or the time window of the departure time could be more flexible. In such cases the scheduling of the trips has to be sensitive to the level of service, as passengers may experience longer travel and waiting times. If the level of service deteriorates this may discourage passengers from choosing a shared ride in the future and hence, reduces the demand for shared services.
9.3.3 Market Fragmentation
Market fragmentation refers to multiple service providers/platforms, typically operating independently (except for some drivers working for multiple platforms). Multiple platforms fragment demand and myopically optimize their systems to serve their own customers. This may potentially result in a higher cost to society (pollution, fuel consumption, congestion), customers (fare, time), and their own services (fleet, crew). Séjourné et al. [Reference Séjourné, Samaranayake and Banerjee41] analyzed the impact of competition among on-demand mobility companies on operating costs. Their analysis sheds light into the benefits of aggregating pickup and drop-off locations, increasing the flexibility of pickup times, and allowing drivers work on multiple platforms (also known as multihoming). Pandey et al. [Reference Pandey, Monteil, Gambella and Simonetto42], using New York City taxicab data, conclude that competition among service providers degrades the level of service compared to a centralized model. Integrating all service providers is clearly not practical. However, mechanisms such as multihoming partially mitigate the efficiency loss and increase shared trips. Multihoming has the potential to provide a more flexible supply of labor, which not only increases ride pooling opportunities but also reduces costs, for example, by minimizing the need for rebalancing [Reference Bryan and Gans43].
9.3.4 Operating Strategies and Partnerships
Various studies have proposed and evaluated novel service models for the purpose of facilitating trip matching in order to increase its likelihood. These strategies have the potential to provide more opportunities to share rides by seeking broader consolidation opportunities (in terms of space and time) to efficiently group travelers, while maintaining a high level of service. Several examples follow.
Advanced requests [Reference Ma, Koutsopoulos and Zheng44]. In this scenario, requests are placed ahead of time with desired pickup and drop-off time windows. In general, the service can accommodate passengers with different advanced request intervals and different price sensitivities. Advanced requests are expected to increase the likelihood of sharing trips while reducing operating costs for TNCs. Pricing the service accordingly can be the means of incentivizing passengers to make requests in advance. Uber recently added a similar function to incentivize travelers to depart later than their desired departure times. For example, users can get a $1 Uber cash back if they are willing to depart in ten minutes and $2 if they depart within twenty minutes.
Dynamic waiting [Reference Korolko, Woodard, Yan and Zhu45]. In this scenario, requests are placed in real-time with desired pick-up times. As with advanced bookings, requests wait to be matched to a driver for a period of time (waiting time window). The waiting window is dynamic, depending on market conditions. For example, it increases when the supply of vehicles is constrained. The waiting window is used to increase the opportunities to pool together requests whose origin and destination locations are close to each other (within walkable distance).
Meeting points [Reference Stiglic, Agatz, Savelsbergh and Gradisar23]. In this scenario, requests are placed in real-time with desired pick-up times. Passengers walk to pick up locations and share a ride with other passengers. After alighting, passengers may have to walk from the drop-off spot to their destination. The meeting points are determined dynamically, given the request location and expected LOS of passengers already on-board.
Intermediate transfer points [Reference Masson, Lehuédé and Péton46, Reference Deleplanque and Quilliot47]. In this scenario, requests are placed in real-time with desired pick-up times. Users that are picked up may change vehicles during their trip. A transfer can occur at pre-specified locations in a static manner or can happen dynamically based on how trips are pooled together. Transfers increase the opportunity of matching rides as users from different origins can be pooled together at the transfer locations to a common destination.
Partnerships with other service providers [Reference Schwieterman and Livingston48, Reference Rao49]. In this scenario, on-demand TNCs and public transport agencies work in partnership. For example, hybrid on-demand and public transport services allow passengers to place requests with desired pickup times and origin/destination information. Passengers can be picked up at their origins by on-demand services and dropped off at an “optimal” public transport station. Alternatively, they can take a bus or metro, and then either walk or take another TNC to their destinations, or they can be directly served (door-to-door) by TNC services.
9.4 Assessing Opportunities
Successful outcomes with respect to increasing shared trips probably require a combination of approaches. We focus the discussion on two promising strategies for their potential to improve shared trips and reduce impacts such as VMT: a) advanced requests and b) partnerships with public transport agencies.
The advanced requests strategy is representative of the first three operating strategies discussed earlier. It relies solely on the TNCs to adopt alternative operating models by adding options to their services. Advanced requests can be viewed as a more formal way to extend some of the current offerings, for example, dynamic waiting. Therefore, from an implementation point of view, it represents incremental changes that are more likely to be adopted by companies and users. By contrast, strategies such as meeting points and intermediate transfer points may require significant changes to the digital infrastructure and deviate quite substantially from the core operating models currently deployed.
The second strategy we focus on, partnerships, is quite different from pure operating strategies, as it requires collaboration between TNCs and traditional public transport agencies. It represents an opportunity to take advantage of natural synergies that exist between TNCs and public transport services and has the potential to benefit both stakeholders. Public transport and TNCs both offer shared rides but with different degrees of flexibility. Partnerships between the two help address the weakness of one through the strength of the other.
9.4.1 An Empirical Evaluation of Advanced Requests
Given the on-demand nature of most requests, from a scheduling point of view, the short time between the placing of a request and the initiation of the service limits the ability of customer matching and vehicle scheduling algorithms to take full advantage of the shareability opportunities. A number of studies point out this inefficiency of the on-demand nature of TNC services. Alonso-Mora et al. [Reference Alonso-Mora, Wallar and Rus35] show that predicting future demand accurately could improve the efficiency of TNC operations. Using TNC ride data from three US cities (San Francisco, New York, and Los Angeles), Chen et al. [Reference Chen, Jauhri and Shen50] reported that ride-pooling with approximated future requests can yield significant benefits by reducing total fuel consumption (by 15 percent) and fleet size (by 30 percent). Various surveys indicate that TNC users report optimal waiting times for their ride to be five–eight minutes. In one study [Reference Zhou, Ma, Hirschmann and Lao40], it is reported that 68 percent of the TNC users in the survey actually waited more than four minutes for their service to arrive. Even more importantly, 75 percent of the users are willing to place requests more than fifteen minutes in advance, in return for a fare discount.
Given the inefficiency introduced by real-time requests and also the expressed willingness of users to place requests in advance, at the right fare, we examine in detail the potential of an advanced requests operating model for TNCs. Advance knowledge of future requests gives TNCs more flexibility to schedule trips and identify opportunities to match requests. We evaluate the performance of an advanced requests system relative to current practices using a large-scale dataset from the operations of a major on-demand ride-hailing company in China. In addition to the overall potential of such a strategy in reducing VMT (directly related to energy consumption and emissions) and operating efficiently, the impact of various design aspects of the advanced requests system (for example, advanced requests horizon, vehicle capacity) on its cost and performance is also of interest, as well as the sensitivity of the results to user preferences in terms of level of service (time to be served and excess trip time) and willingness to share.
The advanced requests system that we examine follows the one proposed by Ma et al. [Reference Ma, Koutsopoulos and Zheng44]. Requests are placed ahead of time with desired pick-up time windows. Let H be the advanced reservation horizon (how far ahead requests for service should be placed). Scheduling decisions are made every ∆t seconds (decision epoch), with ∆t ≤ H. That means every ∆t seconds, utilizing all available information on advanced requests and vehicle status, all requests are processed. At each decision epoch, all advanced requests within the advanced reservation horizon H are known. The decisions respect requests that have already been assigned to trips and, either assign pending requests to an existing trip, or start new trips.
The above model is quite general and can represent alternative operating models. For example, for H = 0 the model represents existing, on-demand, ride-pooling services, where passengers make requests expecting immediate service. Existing on-demand ride-pooling services are reactive with requests collected during a short time window, for example, thirty seconds, after which they are assigned to different vehicles and the service stops (pickup and drop-off locations) are scheduled accordingly.
We analyze performance metrics with respect to mobility (VMT) and level of service (LOS) that passengers experience (waiting time and trip delay time). We consider different operating characteristics of the ride-pooling service in terms of the advanced requests horizon and the decision epoch. We also consider different user preferences and traffic conditions. The overall experimental design is summarized in Table 9.1.
Table 9.1 Experimental design parameters.
Dimension | Parameter | Settings |
|---|---|---|
Operating model | Advanced requests horizon Decision epoch Vehicle capacity | H∈ {0, 5, 15, 30} minutes Δt∈ {30, 60, 120} seconds {2, 4, 7, 10} passengers per vehicle |
User preferences | Willingness to share | % of customers requesting shared service ∈ {0, 25, 50, 75, 100} |
LOS | Strict users <=2 min, =5-min> Neutral users <=5 min, =10 min> Flexible users <=7 min, =15 min> | |
User groups | All customers are strict All customers are neutral All customers are flexible Mixed <20% strict, 60% neutral, 20% flexible> | |
Traffic conditions | Travel time | Traffic conditions ∈ {low congestion, normal congestion, heavy congestion} |
A large-scale on-demand trip request data set from Chengdu, China from November 01–30, 2016, provided by DiDi Chuxing, a TNC in China, is used in the analysis. To assess the impact of various factors on the performance of ride pooling services, we use requests with pickups and drop-offs within the third ring of the city (20 km × 20 km area, covering 85 percent of all requests). For each trip, the dataset contains a request ID, vehicle ID, and the time of the request and pickup and drop-off locations (approximately 7 million trips). Figure 9.1 shows the heatmap of the distribution of pickups and drop-offs for a morning period (7.30–8:.0 a.m.). The pick-up and drop-off locations are scattered throughout the network, with drop-offs relatively more concentrated in the city center.

Figure 9.1 Distribution of TNC pickups and drop-offs for a morning peak period 7.30–8.30 a.m.
We evaluate the performance of the system for all possible combinations of the above experimental design resulting in 2,880 cases. Requests are scheduled with the objective of minimizing vehicle miles traveled (VMT). The scenario with advanced requests horizon H = 0 and decision epoch ∆t = 30 sec represents (as close as possible) current operations of various TNC services (for example, Uber, Lyft). For the model with advanced requests, the vehicle schedule is optimized every decision epoch, for example, thirty seconds, given vehicle states and real-time and advanced requests within the time horizon, for example, fifteen minutes. The scheduled requests are kept in the request pool until picked up and can be reassigned if a better schedule is found before pickup. The base case is the scenario where all requests are for single trips. If all requests are for single trips, 30,000 kilometers are required to serve all requests (7,500), for the period 7.30–8.30 a.m.
Figure 9.2 shows the impact on VMT of passengers’ willingness to share, for different user types and advanced request horizons. As expected, VMT decreases with the increase of the percentage of passengers willing to share trips. Compared to the base case, VMT is reduced by 14 percent, 25 percent, and 35 percent, when the sharing percentages are 50 percent, 75 percent and 100 percent respectively, for services with an advanced request horizon of fifteen minutes, vehicle capacity of four, and normal traffic conditions. Interestingly, no significant difference is found for the VMT to serve neutral, flexible, and mixed users (given the same settings on other variables in Table 9.1), while it consistently requires more VMT to serve strict users than the other user types. This suggests that, from the perspective of users’ preferences, most of the VMT reductions could be achieved if passengers are willing to wait for five minutes maximum or can tolerate a trip delay of ten minutes maximum.

Figure 9.2 Impact on VMT of willingness to share (vehicle capacity four, normal traffic).
Operating models with advanced requests perform better than operating models with no advanced requests (advanced request horizon 0) from a VMT standpoint without deteriorating the level of service. Advanced requests facilitate a better matching of requests to vehicles as more information is available for decision making. For example, the operating model with an advanced requests horizon of fifteen minutes reduces the base case VMT (all requests are for single trips) by 35 percent, while the current practice model (with no advanced requests) saves 19 percent of the base case VMT if all requests are for shared trips. It is also interesting to note that even a short advanced requests horizon (for example, five to fifteen minutes) provides most of the benefits in terms of VMT reduction.
Figure 9.3 shows the impact on VMT of vehicle capacity for different user types and advanced request horizons. Higher capacity vehicles increase the sharing opportunities as more users can be assigned to the same vehicle and thus decrease the total VMT to serve all the requests. However, there are diminishing returns when the capacity exceeds seven. For example, if all passengers are willing to share, the operating model with advanced requests horizon fifteen minutes saves 35 percent, 40 percent, and 40 percent of the base case VMT for vehicle capacity of four, seven, and ten, respectively. The operating model with no advanced requests reduces the base case VMT by 19 percent, 23 percent, and 24 percent for vehicle capacity of four, seven, and ten, respectively.

Figure 9.3 Impact on VMT of vehicle capacity (all shared, normal traffic).
Figure 9.4 compares the performance of the operating model with advanced requests, assuming a fifteen minutes advanced request horizon and a thirty seconds decision epoch, to the performance of current services (for example, no advanced requests). It is assumed that all passengers are willing to share and have mixed preferences. Vehicle capacity is four and traffic conditions normal. The base case of only single trip requests is also shown. The results are based on the application of the model over the entire day.

Figure 9.4 Comparison of VMT over the course of a day for different operating models: no advanced requests, advanced requests with, H = 15 min 100 percent willingness to share, mixed user preferences, decision epoch thirty sec, vehicle capacity four, and normal traffic.
The advanced requests operating model performs consistently better than a system with no advanced requests across different time periods of the day. Compared to the base case when all requests are for single trips, on average, if all passengers are willing to share, a system with no advanced requests will reduce VMT by 20 percent, while the operating model with fifteen minutes advanced requests will save 35 percent of the total VMT. The 35 percent VMT reduction represents not only a reduction in congestion but also in environmental impacts. In terms of the LOS for the passengers, the no advanced requests system yields an average waiting time of 1.8 minutes and trip delay time of 3.3 minutes, while the advanced requests model has an average waiting time of 2.3 minutes and trip delay time of 5.8 minutes.
In conclusion, operating strategies based on requests in advance have the potential to improve shared rides and reduce the environmental footprint of TNC services. Even short advance request horizons offer substantial benefits at the cost of a small increase in waiting and travel delays. Furthermore, survey data indicate that users are actually interested in using such services.
9.4.2 Partnerships with Public Transport
Recently, there has been a growing interest in exploring partnerships between public transport agencies and TNCs. Such partnerships have the potential to increase shareability opportunities. Many commuting trips for example, take place at the same time and could use the same rail station. This increases the chances of pooling requests that go to the same public transport station (many-to-few case), providing economies of scale for the TNC and also feeding potentially new users to public transport services. In general, public transport agencies may partner with TNCs for various reasons, such as improving mobility where public transport is scarce or cutting down on costs and attracting new customers. TNCs on the other hand, view such partnerships as a means to increase revenue by serving markets with favorable spatio-temporal characteristics. Various studies indeed suggest that TNC and public transport services can be used collaboratively [Reference Schwieterman and Livingston48]. Uber data, for example show a strong relationship between the origin and destination of the rides and the location of public transport stops. Almost 40 percent of Uber rides in London either start or end near a Tube stop [Reference Rao49]. Uber reported a 22 percent increase in the number of its trips that began within 200 meters of a Tube stop after London launched a limited nighttime Tube service in 2016 [Reference Rao49]. In Portland, Oregon, 25 percent of Uber trips occur within a quarter-mile of a public transport station [51]. Lyft rides follow the same pattern, with 25 percent of Lyft riders using the service to connect to public transport. In Boston, 33 percent of Lyft rides start or end near a public transport (MBTA) stop [Reference Kaufman52].
The initial partnerships emerged due to safety concerns. The goal of the partnerships was to motivate people to use public transport to attend social and entertainment activities and, later in the night, when public transport services are not available, help them get back home safely with subsidized TNC rides. The Dallas Area Rapid Transit (DART) partnered with Uber on St. Patrick’s Day to reduce drunk driving casualties during one of the deadliest holidays [Reference Lyons53]. In 2014, the University of Florida proposed a pilot to complement late-night circulatory bus services with subsidized Uber trips to discourage late night-driving [54]. The success of these trials triggered a wider interest in partnerships between TNCs and public transport agencies. The experience with such emerging partnerships however, varies among agencies, ranging from failures such as Bridje in Kansas City, which attracted only a total of 1,452 rides in a year (2016) and was terminated, to the successful Uber partnership with the city of Innisfil, Ontario, with 8,000 rides per month.
In general, three main types of partnerships are observed between public transport and TNCs: First/Last Mile connections, paratransit, and bus route replacement.
First/Last Mile connections: Providing on-demand rides that connect riders to public transport options is the most common partnership. Schwieterman and Livingston [Reference Schwieterman and Livingston55] reviewed twenty-nine agencies in North America and found that since 2016, at least six offered discounted TNC rides to/from public transport rail stations [Reference Schwieterman and Livingston55]. The Pinellas Suncoast Transit Authority (PSTA), for example, became the first public transport agency in the United States to partner with a TNC to provide first/last mile services. “Direct connect” was a pilot service that used public funds to subsidize Uber rides that would allow riders to get to and from a bus stop. “Direct Connect” replaced underperforming, low-frequency bus routes that were carrying less than five passengers per stop per day [54]. The pilot showed promise to reduce costs and the city allocated additional funds to expand the service to ten times the number of bus stops originally served [54]. European cities are also forming similar partnerships, such as BerlKonig in Berlin, Germany [56], and ViaVan in Espoo, Finland [57].
Some partnerships in this group however, experienced poor results. Centennial, Colorado, terminated a partnership with Lyft that offered free trips to light rail stations (Go Centennial). The city had to spend more (compared to the traditional paratransit service they offered, known as Call-n-Ride service), while serving fewer rides [Reference Arellano58]. A report on the “Go Centennial” program blames lack of systematic integration between regional public transport services and the Lyft service for the poor results. Trips were not synchronized with the light rail schedule and alighting riders had to wait for Lyft to arrive. The same report also acknowledges the presence of parallel services (from other demand responsive services) that caused inefficiencies and limited the benefits that come from economies of scale [59].
Paratransit (dial-a-ride): It is typically very expensive to operate traditional paratransit services, which are often mandated by the Americans with Disabilities Act. The Brookings Institute estimates that in 2013, 12.2 percent of the operating costs of public transport agencies (approximately $5.2 billion) went to paratransit. Contracts with TNCs to provide paratransit services are particularly interesting, as agencies are under pressure to find innovative solutions to deal with the ever-growing paratransit costs. The experience from partnerships between public transport and TNCs to offer paratransit services is promising. Agencies, such as in Boston (MBTA) and Las Vegas (RTC), use TNCs as platforms to provide paratransit services that are easier for passengers to use and at a lower cost for the agency [Reference Marshall60, Reference Marroquin61]. In Boston, the MBTA recently renewed a three-year contract with Uber and Lyft to supplement their paratransit services [62], even though the TNC-based service may have problems serving some wheelchair users who have to be accommodated through other means [Reference Daniel and Alulema63]. In Las Vegas, RTC aimed to reduce the $32 per ride cost for traditional paratransit services by outsourcing the trips to Lyft. The public transport agency estimates that each Lyft ride costs about $15 [64].
Bus route replacement: Another type of collaboration is using TNC services to replace bus routes. The town of Innisfil, Ontario, decided to partially subsidize TNC trips in place of the traditional public transport system operating in the city. The average subsidy of $5.62 per passenger is lower than the subsidy for a typical bus ride [Reference Schwieterman and Livingston55]. Uber reports that the partnership is saving Innisfil $8 million a year [65]. In Arlington, Texas, the town’s entire bus service was replaced by services provided by Via, making Arlington the largest US city without a typical public transport system [Reference Etherington66]. The Via rides cost between $3 and $5, depending on distance and origin/destination of the trip. The customer is notified of the expected pickup time but, in general, waiting time is less than ten to twelve minutes, which makes the service particularly attractive. The program has been successful, and the contract was renewed with expanded service from 30 percent coverage to 100 percent coverage [Reference Hanna67].
In summary, partnering with TNCs can have benefits for public transport authorities. Connecting riders to public transport, replacing inefficient bus routes, and providing cost-effective paratransit services are the most promising areas of collaboration. Collaboration can also be beneficial to TNCs. As mentioned earlier, TNCs are more cost-effective when trips are concentrated (for example, many-to-few). Partnerships with public transport favor and greatly facilitate such operations. The lessons learned from the current efforts suggest that service design, business models, demand spatio-temporal characteristics, marketing, and demographics are important for the success of public transport-TNC partnerships. The degree of complementarity (TNCs working together with public transport agencies) and substitution (TNC trips replacing public transport trips) between TNCs and public transport varies. The substitution effect is expected to be larger for example, in cities or areas where public transportation LOS is low (for example, high travel times, low frequency of service) compared to places with a strong public transport system.
9.5 Conclusion
TNC services have seen significant growth in recent years. While they play an important role in supporting urban mobility, they may also introduce negative externalities. Increasing ride pooling has the potential both to reduce the negative societal impacts and to improve operating efficiency (which is of great concern to TNCs). Although increasing the number of shared trips is a desirable goal, experience suggests that shared trips are currently only a small fraction of all trips. The chapter summarized the factors impacting ride-pooling and synthesized the main approaches that can be deployed to increase ride pooling. Two representative approaches to increase the number of shared trips discussed in detail, operations where requests are required to be known in advance (with short time horizons), and partnerships with public transport agencies for providing multimodal services, have shown promising results.
A case study with data from a large TNC showed that significant benefits (VMT savings) can be realized when advanced requests are combined with an increased willingness to share. Even short, advanced request intervals (five to fifteen minutes) can capture the majority of the benefits of advanced requests. The VMT savings are realized at the expense of a small reduction in LOS.
Partnerships between public transport and TNCs can be beneficial to both sides, in terms of reducing costs, improving level of service, and potentially increasing demand. Three main types of partnerships are observed: offering first/last mile connections, providing paratransit services, and substituting for unproductive bus routes. The discussion suggests that service design, business models, consumer attitudes, and demographics, are important for achieving increased ride pooling.
However, the success of these strategies depends on many factors that can play a key role in shaping the future role of TNCs as an integral part of a sustainable urban mobility system, especially considering that public transport should and will always be the backbone of urban transportation.
Pricing is an important lever that TNCs can use to drive demand for various services. Pricing, properly differentiated by service type, impacts consumer choices (along with level of service). Currently, prices for the typical TNC service (ride alone) are rather low, set aggressively to increase market share. Fares are subsidized by the venture capital the companies have attracted and do not always reflect the true cost of the trips. As a result, given this low ceiling (price for the single trips), there is currently limited room to set prices appropriately for the other products. Price differentiation is not strong enough to incentivize users to switch to the more sustainable options, such as ride-pooling.
Policy can play an important role in guiding TNCs to offer more sustainable services. A recent study proposes a number of financial instruments, including surcharges to help cities recover TNC-associated costs and externalities (management, curb utilization, congestion, and pollution), fees designed to penalize inefficient routes, and rewards for shared trips and trips that are complementary with public transport [68].
Integrated fare platforms, providing fare bundles for trips involving public transport/TNC connections is a logical next step in the development of partnerships between public transport and TNCs. Such integrated fare platforms eliminate the obstacle and inconvenience of separate payment means for customers, facilitate revenue allocation among stakeholders, and promote multimodal trip searching and recommendations.
Finally, it should be pointed out that, currently, data sharing between TNCs and public transportation agencies and city authorities is rather limited. Data sharing and greater transparency are important to further develop integrated, inclusive, multimodal services that promote sustainable mobility and accessibility in urban areas.
9.6 Acknowledgments
The authors would like to thank DiDi Chuxing, China for providing the data for this research, and the Massachusetts Green High-Performance Computing Center (MGHPCC) for the computational resources.
10.1 Introduction
The “sharing economy” has been lauded for decentralizing commercial transactions, allowing individuals to directly transfer products and services. Less often discussed is how it has precipitated a parallel geographic decentralization. Whereas historically the industries being disrupted by these platforms have been concentrated in downtown centers and business districts, the same transactions are now spreading throughout cities and towns. Uber and Lyft drivers make many more pick-ups and drop-offs in residential areas than traditional taxis(Lam & Liu, Reference Lam and Liu2017). Airbnb listings offer short-term lodging in residential neighborhoods that have never had hotels. When this is discussed, it is often done in terms of supply and demand. First, some describe it as a boon to both the seller and the buyer as it expands the opportunity for each to deliver and receive services in locations that are more convenient to them. Second, there is sometimes concern, especially in the case of Airbnb, that these new transactions are removing products (for example, housing) from existing markets, shifting their balance. This market-oriented perspective, however, fails to engage the more fundamental implication of sharing economy platforms for neighborhoods: By shifting the geographic distribution of commercial transactions, they have the potential to alter who is in a neighborhood at a given time and what they do – whether residents or visitors – while they are there. This could lead to pervasive impacts to the social and behavioral dynamics, going beyond questions of supply and demand.
Here we present a generalized theory of how sharing economy platforms can and do impact neighborhoods. Our rhetorical focus is on urban neighborhoods, and we draw heavily from literature on cities, but the argument is relevant to suburban and even rural areas as well. After articulating this model more fully, we apply it to Airbnb, treating its incursion into the neighborhoods of Boston, MA as a test case. Along the way, we discuss some of the conceptual challenges that must be taken into account in such analyses.
10.2 A Framework for How Sharing Economy Platforms Can Impact Neighborhoods
The sharing economy has enabled private citizens to directly exchange services and products. This “peer- to-peer” construction has also changed the places where such transactions are likely or even possible. We propose a three-step framework for how these shifts in the commercial landscape of the city can affect the social and behavioral dynamics of neighborhoods (see Figure 10.1). Throughout, we use Airbnb and ride-sharing services (Uber and Lyft) as illustrative examples as they are the most common sharing economy platforms. That said, we go deeper into the implications of the model for Airbnb in the next section.

Figure 10.1 Three-step model of the sharing economy.
First, the sharing economy alters the traditional geographic distribution of service supply. Many services have historically been concentrated in business districts because of the incentives of agglomeration and access to consumers and the relatively high cost of serving areas with low expected demand. Sharing economy platforms have disrupted these mechanisms by lowering the transaction cost of offering services, thus enabling producers and consumers to find each other in less densely populated areas. This can be seen in both Airbnb and ride-hailing services. In terms of the former, researchers examining New York City, Boston, San Francisco, and Barcelona have found that Airbnb listings are common in neighborhoods that did not previously have hotels (Benítez-Aurioles, Reference Benítez-Aurioles2017; Horn & Merante, Reference Horn and Merante2017; Koster, van Ommeren, & Volkhausen, Reference Koster, van Ommeren and Volkhausen2021). Likewise, much has been written about how ride-sharing has increased access to taxis in residential neighborhoods, especially in New York City, where taxis notoriously concentrate in Manhattan and rarely venture out to the other four boroughs (Correa Diego, 2017).
Second, these geographic shifts in supply and demand can generate unexpected positive and negative externalities for communities. Oftentimes the impacts of the sharing economy are articulated in terms of city- or region-wide industry patterns, like drops in overall hotel revenue (Dogru, Mody, & Suess, Reference Dogru, Mody and Suess2017; Zervas, Proserpio, & Byers, Reference Zervas, Proserpio and Byers2017). We are concerned here with more local impacts at the neighborhood level as the introduction of services brings in people and activities that were not there previously. These impacts might be economic in nature, but they also could arise from the social interplay between these visitors, the services themselves, and the local community. Such effects might be positive. For example, a sharing economy platform can stimulate economic development by increasing access to flexible jobs and foot traffic by outsiders who will frequent local establishments. For instance, one study in New York City found that neighborhoods with more Airbnb listings saw an increase in business, as reflected by expanded staff hiring (Alyakoob & Rahman, Reference Alyakoob and Rahman2019). On the other hand, the increased activity might bring nuisances, like unpleasant guests or burdensome traffic, or, as has been seen, lower the supply and in turn raise prices for rental units in the community. We find the example of Airbnb leading to additional crime intriguing, in fact, as it might implicate either of two mechanisms instigated by a density of short-term rentals. As tourists begin to spend more time in the neighborhood, they might commit crimes, create disorder, or be targets for those who might do so themselves (Biagi & Detotto, Reference Biagi and Detotto2014; Brunt, Mawby, & Hambly, Reference Brunt, Mawby and Hambly2000; De Albuquerque & McElroy, Reference De Albuquerque and McElroy1999; Harper, Reference Harper2001; Ryan, Reference Ryan1993; Schiebler, Crofts, & Hollinger, Reference Schiebler, Crotts, Hollinger, Pizam and Mansfield1996; Stults & Hasbrouck, Reference Stults and Hasbrouck2015). Alternatively, the replacement of stable (or at least semi-stable) renter households with short-term rental units can create gaps in local social networks, potentially undermining a community’s natural ability to prevent crime (Kawachi, Kennedy, & Wilkinson, Reference Kawachi, Kennedy and Wilkinson1999; Sampson, Reference Sampson2012; Sampson & Groves, Reference Sampson and Groves1989).
Third, local governments are tasked with designing policies and regulations that capitalize on the positive externalities of the sharing economy while minimizing the negative externalities. This third component of the model is a response to the first two factors we have described, they also will create a feedback loop, reshaping the distribution and consequences of both the sharing economy activity and its consequences. For instance, regulatory and legislative approaches to Airbnb and ridesharing have often focused on specific (and, at times, anecdotal) concerns about the impacts of these platforms on neighborhoods. In the case of New York City’s negotiations with Uber and Lyft, the emphasis was primarily on increased traffic. For Airbnb in Boston, it was gentrification and displacement of the incumbent community. It is not to say that these considerations were incorrect, but that a more extensive science of the kinds of externalities we suggest here will be critical to developing fully informed policy. In the work we present here, our goal is not necessarily to critique current policy strategies for regulating the sharing economy, but to recommend a scientifically informed process for designing such regulations. That said, it is likely that in many cases the latter will give rise to the former.
Our three-part framework lays the groundwork for various research questions and practical implications for the sharing economy. In terms of the first component of the model, to what extent do sharing economy platforms shift the geographic distribution of a given service? Which neighborhoods see the greatest change? Are these changes correlated with demographic factors? As we progress to the second part of the model, what are the externalities arising from the geographic shifts resulting from a given sharing economy platform? To what extent are they consequential? Do they affect certain communities more than others? Critically, answers to these questions make it possible for policymakers to take action at the third stage of the model. They will be better equipped to determine which policy tools are most effective in managing the externalities surrounding the sharing economy. How do we design them to best effect and which neighborhoods most need attention? We thus encourage researchers and policymakers to partner under the perspective that these three components – the geography of supply and demand, localized social and behavioral dynamics, and public policy – are deeply intertwined in determining how the sharing economy contributes to the ongoing evolution of neighborhoods. With luck, such partnerships will provide the depth of knowledge necessary to design and advance “next-generation” regulatory approaches that move past traditional policy tools.
10.3 Airbnb and Urban Neighborhoods
Airbnb and other peer-to-peer rental platforms make an ideal test case for our framework on how sharing economy platforms can impact neighborhoods. Per the first component of our model, travelers are no longer limited to districts with hotels, which are often concentrated around downtown neighborhoods with commercial and industrial zoning. Instead, they are now able to stay in apartments, houses, and condominiums in residential neighborhoods. This newly introduced commercial activity and the visitors it brings with it can have a variety of externalities, as stated in component two of our model. These can be both positive and negative, thereby impacting the character and trajectory of a neighborhood. An understanding of these externalities should in turn influence the regulation of short-term rentals, which have been the subject of much public discourse and policy debates in cities around the world. This is the culmination and third piece of our model.
To date, most research on the impact of Airbnb rentals on communities has centered on two main outcomes, each related to patterns of supply and demand – the revenue of the hotel industry and the price of housing. The former line of inquiry has found that Airbnb draws potential customers away from hotels and thus lowers their revenue, especially for middle- and low-end hotels (Dogru et al., Reference Dogru, Mody and Suess2017; Zervas et al., Reference Zervas, Proserpio and Byers2017). This work, however, has been more about the way that Airbnb disrupts the hotel industry in a city or broader region, and not about how Airbnb impacts neighborhoods. Meanwhile, research on the relationship between Airbnb and housing values works off the assumption that many Airbnb listings are for units that would otherwise be owner-occupied or rental properties. By lowering this supply, Airbnb in turn leads to increases in housing value and rental prices, a result that has been found in multiple cities in North America and Europe (Ayouba et al., Reference Ayouba, Breuillé, Grivault and Le Gallo2019; Barron, Kung, & Proserpio, Reference Barron, Kung and Proserpio2018; Horn & Merante, Reference Horn and Merante2017; Garcia-López et al., Reference Garcia-López, Jofre-Monseny, Martínez-Mazza and Segú2020; Sheppard & Udell, Reference Sheppard and Udell2016).
Less attention has been paid, however, to the ways that the prevalence of Airbnb in a neighborhood might impact other aspects of a neighborhood. This is important scientifically and practically, as it allows us to better understand how short-term rentals interact with local social dynamics and can provide guidance for policies and regulations that balance their costs and benefits for local residents and businesses. In order to enumerate these possibilities, we must first consider what it means to have tourists in a residential neighborhood. First, tourists tend to frequent local establishments, especially for food and drink, which could increase economic activity in “main street” districts that serve local communities. For example, Alyakoob & Rahman (Reference Alyakoob and Rahman2019) found that New York City neighborhoods with a greater presence of Airbnb listings experienced more growth in restaurant employment. They attributed this effect to visitors using Yelp reviews data. Likewise, Schild (Reference Schild2019) identified a positive impact of Airbnb usage on the number of firms in the entertainment sector.
Although they might contribute to the local economy, Airbnb users might not have an exclusively positive effect on neighborhoods. Tourists can potentially be disruptive by keeping different hours than locals and possibly partaking more avidly in alcohol or other disruptive activities. They also are more vulnerable to property crime than locals as they lack protective relationships and have money and valuables with them. Criminologists have regularly found that neighborhoods with more tourists tend to have greater crime (Boakye, Reference Boakye2010; Harper, Reference Harper2001; Schiebler et al., Reference Schiebler, Crotts, Hollinger, Pizam and Mansfield1996). No one has yet directly tested, however, whether the presence of Airbnb in a neighborhood leads to rises in crime and disorder via this mechanism.
Additionally, as we stated earlier, there is also the possibility that the tourists themselves are not responsible for rises in crime, but that the diminished number of stable households in the neighborhood interrupts the function of local social networks, which are known to be crucial in the management of crime and disorder (Sampson & Groves, Reference Sampson and Groves1989). To illustrate, if a sufficient number of units throughout a community have been converted to short-term rentals – the most transient form of occupancy possible – fewer neighbors are present to sustain a strong social network, also referred to as the social organization (Sampson, Reference Sampson2012), and establish the “social capital,” including trust, reciprocity, and social cooperation, known to be crucial to communities (Coleman, Reference Coleman1988). Regardless of the specific terminologies used, researchers have found these processes to be active in diminishing crime (Kennedy et al., Reference Kennedy, Kawachi, Prothrow-Stith, Lochner and Gupta1998; Sampson, Reference Sampson2012). There is also evidence in the network science literature that demonstrates the positive effect of enhancing the community structure of social networks on their collective prosocial behavior. The strength of the community structure in network science is often measured by network modularity, which measures the ratio of intensity of ties within and across a set of nodes that are identified as a community. Emergence of prosocial norms can then be studied by allowing nodes on a network to play some strategic games with their network neighbors and update their behaviors by occasionally mimicking their successful neighbors. The final status of the collective behavior is then related to the structural features of the network, such as modularity, degree distribution, and other standard network measures. The games are chosen in such a way to model various social dilemmas (for example, prisoner’s dilemma or ultimatum game), in which players can either act selfishly for short-term gains, or take prosocial actions that have long-term benefits for them and the network as a whole. Several studies using this framework have demonstrated that how players resolve such dilemmas depends on the structure of the social network and have shown a strong impact of network modularity – that measures the intensity of community structure based on ratio of link density within and across communities – on population-level attributes such as cooperation, fairness, and stability (Gianetto & Heydari, Reference Gianetto and Heydari2015, Reference Gianetto and Heydari2016; Heydari, Heydari, & Mosleh, Reference Heydari, Heydari and Mosleh2019; Mosleh & Heydari, Reference Mosleh and Heydari2017).
A corollary question is how the presence of Airbnb and tourists might impact the behaviors of local property owners. As listings increase in a neighborhood, they act as a tangible representation of the attractiveness and marketability of housing there. This might then inspire property owners to invest in their buildings, potentially accelerating increases in property values, rental prices, and more generalized gentrification.
Here we leverage our three-component model of sharing economy and neighborhoods to examine outcomes in Boston, MA, which has been the site for early work on how Airbnb impacts property value. It has also been one of the cities that has led the way in developing policy interventions that seek to limit the negative impacts of Airbnb on neighborhoods. Specifically, we analyze how the longitudinal growth of Airbnb across the neighborhoods of Boston, MA is associated with: (1) the increase in food establishments; (2) levels of crime and disorder; and (3) the tendency of property owners to invest in parcels across the city.
10.4 Airbnb’s Presence in Boston
To examine the impact of Airbnb on Boston neighborhoods, we downloaded listings and reviews from InsideAirbnb.com, an independent, noncommercial website that scrapes and publishes data sets of Airbnb listings for cities across the world. InsideAribnb.com has published these data annually since 2015, but Airbnb entered Boston in 2009. In order to overcome this limitation, we leveraged the “host since” field, which indicates the date a property became an Airbnb listing, to estimate which Airbnb listings were present in each year 2010–2014. Koster et al. (Reference Koster, van Ommeren and Volkhausen2021) took a similar approach using the date of a listing’s first review, but we found that the “host since” variable more consistently had a value and would be more precise in any case.
As shown in Figure 10.2, Airbnb had limited presence in Boston in the early years, with a negligible number of listings and reviews. There was rapid growth, however, between 2014 and 2018, over which time the number of listings more than doubled from 2,558 to 6,014. There were also nearly 80,000 total reviews by 2018. Our focus here, though, is not the city as whole, but how the increased prevalence of Airbnb was distributed across neighborhoods. We examine this by joining each listing to the containing census tract, which we use to approximate neighborhood (avg. population = 4,000; 168 with meaningful population in Boston). A major challenge, though, is determining how best to measure Airbnb’s presence in a neighborhood, particularly in terms of how we would expect that presence to have impact on local behavioral and social dynamics.

Figure 10.2 Airbnb’s expansion in Boston: 2009–2018.
Airbnb listings are a “naturally occurring” data set, meaning they were not originally constructed for research purposes. The upshot is that it is incumbent upon researchers to determine how to operationalize the measures of interest (O’Brien, Reference O’Brien2018). As such, previous studies have proposed several ways of measuring Airbnb’s presence in a community. Some have focused on the number of listings, either as the percentage of total housing units in a census tract (Wegmann & Jiao, Reference Wegmann and Jiao2017) or relative to the number of buildings, being that many buildings contain multiple apartments of condos (Koster et al., Reference Koster, van Ommeren and Volkhausen2021). Others have focused on the number of reviews, either as a pure count (Schild, Reference Schild2019) or relative to the number of households in the neighborhood (Alyakoob & Rahman, Reference Alyakoob and Rahman2019), arguing that reviews are a better reflection of the number of tourists brought to the neighborhood by the platform. There is no consensus as to whether one of these is superior to others, however, for which reason we use three measures of Airbnb presence here. First, we measured the density of Airbnb as the number of Airbnb listings in a neighborhood divided by the number of housing units (as accessed from American Community Survey 2011–2017 estimates). Second, we measured the penetration of Airbnb as the number of unique addresses with listings divided by the number of parcels (lots that contain one or more units, per the City of Boston’s Assessing Department) in the census tract, thereby approximating the share of buildings with at least one Airbnb listing. Third, we measured usage of Airbnb as the number of reviews divided by housing units in a census tract. For the sake of brevity, we use these three terms – density, penetration, and usage – throughout.
The reason for adopting three measures of Airbnb’s presence is because none of them captures the whole picture of Airbnb’s impacts on neighborhood on its own. For example, if most listings in a neighborhood are concentrated in a few condo buildings, the potential positive or negative effects generated by Airbnb-related activities might be limited to the immediately surrounding areas, leaving the rest of the community unaffected. On the other hand, if the census tract is a sprawled suburban neighborhood filled with single family houses, the same number of Airbnb listings would be spread more evenly, having a wider impact across the neighborhood. In addition, per the advice of Schild (Reference Schild2019), Airbnb reviews more directly reflect the volume of usage by tourists as a higher density or penetration of Airbnb listings is not always accompanied by more visitors. There is of course, though, the potential for substantial measurement error in this last measure as leaving reviews for hosts is not a mandatory policy of Airbnb, hence many visitors choose not to do so. Also, a party with multiple visitors can only leave one review for a listing, inevitably fewer than the people who were present. As a consequence, this measure underestimates the total volume of tourists produced by Airbnb, and analyses using it must assume that these undercounts are consistent across neighborhoods; that is, the tendency to undercount is not exaggerated in some neighborhoods more than others. Another benefit of using these three different measures is the ability to potentially differentiate between those impacts caused by the sheer number of tourists (quantified with usage), versus those created by listings (quantified with penetration and density). As we noted earlier, this is specifically relevant to our discussion of Airbnb might lead to elevated crime in a neighborhood: Tourists could attract or perpetrate crime, or the conversion of units to short-term rentals could lead to weaker ties and relationships within the community.
Our first task is to determine whether we are justified in treating each of these three measures as a separate indication of the presence of Airbnb in a neighborhood. While they are semantically and computationally distinct, it is completely possible that they are too strongly correlated to be analyzed independently. Figure 10.3 presents the correlations among the three measurements for census tracts, showing that they are substantially correlated (r = .47 – .76), but not so much to suggest that they cannot be analyzed separately. The strongest correlation is between density and usage, which is unsurprising being that they are calculated using the same denominator. Meanwhile, the weakest correlation is between penetration and usage. As one can see in the scatter plot at the bottom left corner of Figure 10.3, there are numerous neighborhoods with a high level of Airbnb usage (that is, many reviews per housing unit) but a low level of Airbnb penetration (that is, number of parcels with at least one listing); meanwhile there are others with low Airbnb usage but high penetration. Given this, we move forward analyzing all three measures.

Figure 10.3 Correlations between three measures of Airbnb’s presence in Boston.
In Figure 10.4 we can see that Airbnb density, penetration, and usage all increased over time and across census tracts in Boston. That is not to say that this growth was uniform. Certain census tracts were the first to have a measurable presence of Airbnb and then proceeded to have high levels of Airbnb by all three measures. The highest were tracts with as many as 8 % of units and 40 % of buildings featuring at least one listing. Even more striking, our measure of Airbnb usage is as high as 1.5 reviews per housing unit in the tract. In contrast, in many other tracts the presence of Airbnb was limited and even absent throughout the study period. Meanwhile a handful of tracts started with very low Airbnb presence and then witnessed rapid growth of Airbnb-related activities.

Figure 10.4 Airbnb’s presence in Boston.
Note: Each row represents a census tract from 2010 to 2018. The darker the color, the higher the Airbnb presence. Tracts are in the same position in each panel, meaning we can compare panels to confirm that most tracts with high level of presence on one measure scored similarly on the other measures.
Before proceeding, it is worth noting which neighborhoods have high and low presence of Airbnb. Figures 10.5–10.7 map the spatial distributions of the three measures over time, demonstrating that the measures indeed tell different stories about Airbnb’s expansion in Boston. In Figure 10.5, we notice that as the number of listings increases, Airbnb penetrations were most significant in census tracts that are located in the downtown urban center (in the northeast of the city). However, in Figure 10.6, although census tracts in urban centers still show relatively high Airbnb presence measured by Airbnb density, the tracts with highest level of Airbnb density are scattered surrounding the downtown areas. This divergence can be explained by population density in different urban neighborhoods. Urban centers usually have more people and less land while surrounding neighborhoods are somewhat less dense. Hence, Airbnb penetration might be high in an urban center, but its density is dwarfed by the immense number of housing units there. Owing to their strong correlation, Airbnb usage displayed a similar pattern to density (see Figure 10.7). Whereas the downtown and the first ring of neighborhoods around it share the distinction of highest presence of Airbnb depending on the measure used, neighborhoods located further out are consistently low in all three measurements. In the next section, we estimate Airbnb’s impacts on neighborhood’s investment and quality of life using the three measurements.

Figure 10.5 Airbnb penetration.

Figure 10.6 Airbnb density.

Figure 10.7 Airbnb usage.
10.5 Evaluating Airbnb’s Impacts on Boston Neighborhood
10.5.1 Methods
To estimate Airbnb’s impacts on Boston neighborhoods, we return to the three hypotheses from above: (1) Airbnb might encourage property owners to invest in their buildings; (2) the presence of tourists will support expansion of the local restaurant industry; and (3) the increased prevalence of tourists will lead to elevated disorder and crime. In order to test each of these hypotheses, we draw from indicators collected or developed by the Boston Area Research Initiative (BARI). First, BARI releases measures of investment and growth annually based on building permits approved by the City of Boston (O’Brien & Montgomery, Reference O’Brien and Montgomery2015; O’Brien et al., Reference O’Brien, Montgomery, de Benedictis-Kessner and Sheini2019). The most relevant such indicator is alteration to existing buildings, calculated as the percentage of parcels in a census tract undergoing an addition or renovation in a year (excluding newly constructed buildings).Footnote 1 Second, we calculated the number of new food establishments from the records of new food establishment licenses approved by the Health Division of the Department of Inspectional Services (ISD).Footnote 2 Third, we obtained three indicators of social disorder and crime based on 911 dispatches (Ciomek & O’Brien, Reference Ciomek and O’Brien2019): Public social disorder, such as panhandlers, drunks, and loud disturbances; private conflict arising from personal relationships (for example, domestic violence); and public violence that did not involve a gun (for example, fight). Each of these measures was based on a combination of case types in the 911 system, divided by the population of the census tract (to form a rate). We also access demographic measures from the American Community Survey as control variables, particularly measures of socioeconomic status (for example, income, poverty rate), as they are closely related to many of the variables here. Table 10.1 provides a summary of the variables.
Table 10.1 Description of variables
mean | sd | min | max | Observations | |
|---|---|---|---|---|---|
Permits for Property Alteration (%) | 0.19 | 0.09 | 0.04 | 0.61 | 1,176 |
Number of Licenses for Food Establishment | 1.03 | 2.32 | 0.00 | 24.00 | 1,344 |
Airbnb Density (%) | 0.01 | 0.01 | 0.00 | 0.08 | 1,344 |
Airbnb Penetration (%) | 0.04 | 0.06 | 0.00 | 0.41 | 1,344 |
Airbnb Usage (%) | 0.12 | 0.20 | 0.00 | 1.44 | 1,344 |
Events of Private Conflict (per 1,000) | 11.13 | 6.18 | 0.00 | 32.97 | 1,344 |
Events of Guns (per 1,000) | 4.21 | 4.52 | 0.00 | 25.79 | 1,344 |
Events of Violence (per 1,000) | 28.10 | 21.84 | 1.33 | 172.54 | 1,344 |
Events of Social Disorder (per 1,000) | 7.51 | 8.67 | 0.00 | 75.82 | 1,344 |
Each of the variables was measured annually throughout the study period, making for a panel design. Thus, we analyze the impacts of Airbnb on a neighborhood using a set of generalized difference-in-difference (DID) fixed-effects models with multiple periods and continuous treatments (Lechner, Reference Lechner2011):

where i represents the census tract, t represents the year. Yi,t are the dependent variables: alteration to existing structures, growth in food establishment licenses, and indicators of social disorder and crime. g is the estimated causal effect of Airbnb presence.Footnote 3 The key independent variables are lagged for one year to avoid reverse causal effects. h and b are the tract and year fixed effects, respectively, capturing both time-invariant characteristics of tracts and spatially invariant characteristics of years (for example, a city-wide increase in Airbnb prevalence or property investment). Ci,t is the vector of control variables including log of median home values, median household income, and population density, among others.Footnote 4 Note that we run the models three times for each outcome variable, independently testing the impact of each aspect of Airbnb prevalence.
10.5.2 Results
The results from the DID models supported one of our three hypotheses of how Airbnb can impact neighborhoods. As shown in Table 10.2, increases in the prevalence of Airbnb predicted increased property investment in the following year. This was true whether we measured Airbnb in terms of density (b = 0.004, p < 0.01), penetration (b = 0.001, p < 0.001), or usage (b = 0.000, p < 0.01). The coefficients indicate that a one percentage-point increase in Airbnb density was associated with a 0.4 percent increase in property alteration and that a 10 percentage-point increase in Airbnb penetration was associated with 1 percent increase in building permits qualified as housing investments. This effect seems practically small but presents a reasonable ratio of 10:1 between properties listing on Airbnb and properties pulling building permits for improvements. It is worth noting that these are not necessarily the same properties, but it would seem reasonable to assume there is at least some overlap. Further, a 1 percent increase in property alteration is nontrivial, considering that the average census tract has just below 10 percent of properties apply for permits in a given year. In summary, Table 10.2 provides evidence that the prevalence of an Airbnb market in a neighborhood contributes to a greater percent of property investment. This joins existing evidence that Airbnb presence leads to higher housing property value, but we found no evidence to suggest that residential property investment is the intermediate factor through which Airbnb density affects housing values.
Table 10.2 Fixed-effects models on property alterations
(1) | (2) | (3) | |
|---|---|---|---|
Airbnb Density (%) | 0.386∗∗ | ||
Airbnb Penetration (%) | (0.162) | 0.108∗∗∗ | |
Airbnb Usage (%) | (0.039) | 0.017∗∗ | |
(0.008) | |||
Tract FE | Yes | Yes | Yes |
Year FE | Yes | Yes | Yes |
Controls | Yes | Yes | Yes |
Observations | 1,126 | 1,126 | 1,126 |
F | 6.742 | 6.417 | 6.841 |
R2 | 0.940 | 0.941 | 0.940 |
Note: clustered standard errors are displayed in parenthesis. All independent variables are lagged for one year. Control variables include median home value (log) and events of violence, social disorder, guns, and private conflicts
Significance levels: * p<0.00; ** p<0.01; *** p<0.001.
Table 10.3 shows no clear relationship between Airbnb prevalence in Boston neighborhoods and the expansion of food establishment licenses, regardless of which measure of Airbnb prevalence we used. Table 10.4, however, shows that neighborhoods with a higher level of Airbnb penetration saw rises in violent crime in the following year (b = 0.546, p < 0.001), and notably to a greater extent than the concurrent measure of penetration. There was still no corresponding effect on public social disorder or private conflict, however. Airbnb density in the previous year was also associated with higher levels of violent crime, albeit at a lower significance, and thus magnitude, relative to penetration (b = 1.407, p < 0.05). Airbnb usage had no effect on any of the three measures in the following year. We also performed a two-year lagged analysis, and the results are in general agreement with those with one-year lag in terms of the impact of Airbnb penetration on events of violence. There, Airbnb penetration not only predicted increased violence at this time scale, but also showed a moderate impact on events of private conflict, an effect that was not present in the one-year lagged analysis. The effects of Airbnb usage and density also concurred with the one-year lagged analysis (Ke et al., Reference Ke, O’Brien and Heydari2021).
Table 10.3 Fixed-effects Poisson regressions on new food establishment licenses
(1) | (2) | (3) | |
|---|---|---|---|
Airbnb Density (%) | –0.040 | ||
(0.047) | |||
Airbnb Penetration (%) | –0.012 | ||
(0.008) | |||
Airbnb Usage (%) | –0.003 | ||
(0.003) | |||
Tract FE | Yes | Yes | Yes |
Year FE | Yes | Yes | Yes |
Controls | Yes | Yes | Yes |
Observations | 1,196 | 1,196 | 1,196 |
Chi2 | 63.089 | 64.386 | 63.863 |
Note: clustered standard errors are displayed in parenthesis. All independent variables are lagged for one year. Control variables include median home value (log) and events of violence, social disorder, guns, and private conflicts.
Significance levels: * p<0.00; ** p<0.01; *** p<0.001.
Table 10.4 One-year lagged independent variables
Events of Private Conflict | Events of Social Disorder | Events of Violence | |||||||
|---|---|---|---|---|---|---|---|---|---|
(1) | (2) | (3) | (4) | (5) | (6) | (7) | (8) | (9) | |
Airbnb Penetration (lag 1) | 0.041 | –0.115 | 0.546*** | ||||||
(0.039) | (0.118) | (0.133) | |||||||
Airbnb Density (lag 1) | –0.112 | –0.426 | 1.407* | ||||||
(0.227) | (0.293) | (0.614) | |||||||
Airbnb Usage (lag 1) | 0.001 | –0.011 | 0.037 | ||||||
(0.009) | (0.016) | (0.021) | |||||||
Tract FE | Yes | Yes | Yes | Yes | Yes | Yes | Yes | Yes | Yes |
Year FE | Yes | Yes | Yes | Yes | Yes | Yes | Yes | Yes | Yes |
Controls | Yes | Yes | Yes | Yes | Yes | Yes | Yes | Yes | Yes |
Observations | 1,004 | 1,004 | 1,004 | 1,004 | 1,004 | 1,004 | 1,004 | 1,004 | 1,004 |
F | 0.62 | 0.16 | 0.04 | 0.8 | 1.32 | 0.79 | 8.7 | 2.69 | 1.56 |
Note: clustered standard errors are displayed in parenthesis. Control variable is median household income. Significance levels: * p<0.05; ** p<0.01; *** p<0.001.
10.6 Discussion
We have used the expansion of Airbnb across the neighborhoods of Boston, MA to illustrate an overarching framework for considering how sharing economy platforms can impact neighborhoods. Airbnb has epitomized the way that such platforms have changed the geographic locus of certain commercial transactions, often by expanding them from business districts into more residential communities. In turn, cities like Boston have seen Airbnb listings direct more and more tourists to residential areas. Many have expressed concerns at the externalities that this unexpected influx of visitors might create. Here we articulated and tested three specific hypotheses for what these might be: (1) encouraging greater investment in property; (2) expanding the local hospitality industry; and (3) increasing crime and social disorder.
The empirical test provided support for our first hypothesis as well as some suggestive evidence for our third. Neighborhoods with increasing prevalence of Airbnb listings saw more investment in property, as measured through building permit applications approved by the City of Boston. Meanwhile, we saw mixed evidence for the other two hypotheses. Part of this might be limitations from the outcome measures we used. In particular, counting new restaurants is a constrained approach that requires that the hospitality industry expanded sufficiently to support entire new businesses. Researchers using the more nuanced measure of restaurant employment in New York City did find that Airbnb led to localized growth in the industry (Alyakoob & Rahman, Reference Alyakoob and Rahman2019). Meanwhile, we see some initial evidence that Airbnb listings in a neighborhood are associated with increases in public violence in a neighborhood.
The suggestion that Airbnb might be associated with increases in public violence is intriguing, if preliminary. Admittedly, we sought here to illustrate a generalized framework for pursuing hypotheses on the externalities of sharing economy platforms. As such, this analysis and finding does not fully engage the more nuanced set of relationships between Airbnb and crime that we proposed earlier. To reiterate, Airbnb might impact crime through either of two pathways. First, tourists could directly raise crime, either by perpetrating crimes or acting as attractive targets for criminals. Alternatively, a density of Airbnb listings may undermine local social dynamics that mitigate and prevent crime. A seminal concept in criminology known as social disorganization theory posits that communities with high residential turnover will have difficulty creating and sustaining the relationships and norms necessary for limiting crime (Sampson, Reference Sampson2012). Consistent with this model, Airbnb is the most transient type of household possible, literally “turning over” every few days. To this end, the listings may leave gaps in the social fabric off the neighborhood that could permit crime to increase. Adjudicating between these two hypotheses requires a targeted conceptual approach and methods that attend to the nuanced differences between them. We conduct such a test in a recently published study in a separate venue (Ke et al., Reference Ke, O’Brien and Heydari2021). We do indeed find evidence that Airbnb listings lead to increased crime in neighborhoods by undermining the local social organization – not because they attract tourists, as one might assume. By undermining a neighborhood’s social organization, higher Airbnb penetration diminishes the natural ability of a neighborhood to counteract and discourage crime, specifically violent crime.
Our goal in presenting this study is to highlight three important considerations, one conceptual, one methodological, and one practical. Taking the conceptual first, the framework here provides a guide for examining how other sharing economy platforms might be impacting neighborhoods. The study of each will first need to determine if and how the platform in question is in fact shifting the geographic distribution of commerce. It then will need to proceed to reasoning how those transactions might be altering existing behavioral or economic dynamics. In the current case, we reasoned that Airbnb highlights the value of local housing stock, thereby stimulating investment by property owners. We also discussed how the introduction of tourists might lead to more patrons at local restaurants, but also more disorder and crime. Similar logics would need to be developed for each sharing economy platform and might reveal that certain platforms would be more likely than others to have tangible impacts on communities.
Working through the first two steps of our conceptual process raises a crucial methodological consideration. How does one quantify the presence of a sharing economy platform in a neighborhood? In order to maintain brevity and avoid ambiguity, most scientific studies present and justify a single measure for a quantity of interest. This is a truism for science in general, and has become pronounced in recent years with the use of naturally occurring data sets, including but not limited to the data generated by sharing economy platforms (O’Brien, Sampson, & Winship, Reference O’Brien, Sampson and Winship2015). In contrast, we have taken the opportunity here to detail our own struggle to identify a single measure for the presence of Airbnb in a neighborhood, revealing that multiple measures are possible and that they are neither statistically nor conceptually equivalent. This highlights the challenge faced by researchers in this space and makes clear that the measures themselves need to be developed with care. Further, researchers need to be clear on the interpretation of the measure or measures they select. To illustrate this latter point, there are clear differences between the meaning of our three measures. Whereas high density could be created by a few large buildings with many units listed, penetration reflects a more general distribution of listings throughout a neighborhood. The latter might better reflect the exposure of many parts of a neighborhood and their residents to Airbnb. Meanwhile, the usage measure, which estimates the total number of visitors to the neighborhood, might be most relevant for hypotheses regarding the volume of impact of individual tourists.
Last, it is important to consider how this framework might be a useful tool as local governments look to manage and regulate the sharing economy. Presumably, the goal of such regulations is to maximize the benefits generated by the sharing economy and minimize the negative impacts. Research of the sort presented here will inform policymakers to the specific positive and negative externalities that should be taken into account when designing such regulations. Here we see that Airbnb is leading to more investment in neighborhood properties, which might be argued as a positive outcome. It joins, however, a wealth of evidence that the expansion of Airbnb listings can lead to increases in housing and rental costs and gentrification more generally. Municipal leaders need to weigh these costs and benefits alongside each other when determining how a regulation will impact neighborhoods.
Meanwhile, combining the results here with our further analysis elsewhere (Ke et al., Reference Ke, O’Brien and Heydari2021), we see that Airbnb can also lead to elevated levels crime and disorder in a neighborhood. But the crucial question of measurement returns, this time highlighting how intervention requires not only an understanding of the externalities of the sharing economy, but also of the mechanisms by which these externalities occur. Comparing different ways of measuring the presence of Airbnb in a neighborhood, the increase in crime appears to have been instigated not by the arrival of tourists, as many have assumed. Instead, the listings themselves create a transience that can undermine local social networks and the community’s ability to prevent crime. There have been arguments that these sorts of effects are nonlinear and are only visible as they reach certain thresholds (Clear et al., Reference Clear, Rose, Waring and Scully2003). Fittingly, the same has been demonstrated for gentrification (Hwang & Sampson, Reference Hwang and Sampson2014), which is the potential concern arising from increases in building permits.
With information like that provided by our analysis, cities might be able to develop more informed regulations. Complete bans of Airbnb listings are a blunt tool that foregoes any of the possible benefits they might offer, like stimulating local businesses. Cities like Boston, MA, should be applauded for pursuing a middle ground, but the question is whether they were designed to best support communities. Boston, similar to other locales, has placed the focus on limiting property owners to renting out only one unit in an owner-occupied building at a time. This does limit the overall number of listings, but it has its weaknesses. At the extreme, it could lower density of short-term rentals in the neighborhood while permitting maximal penetration across its parcels. The results in studies based on the suggested framework here (Ke et al., Reference Ke, O’Brien and Heydari2021), would suggest that the negative externalities of the listings could still take hold in such a situation. Policymakers might instead consider quotas of parcels within a neighborhood that can have one or more short-term rentals. In conclusion, this framework can support well-crafted empirical research that then can be translated into well-designed policies. This is critical as it becomes increasingly clear that sharing economy platforms will be a major component of the commercial landscape for the foreseeable future.


 Open access