
While climate change is a vitally important environmental change confronting humanity, the planet is changing in other unprecedented ways. Many of these changes – pollution, biodiversity loss, land use changes, and others – correspond to the planetary boundaries introduced in Chapter 1. Like climate change, these planetary changes also have implications for human health and well-being – the subject of this chapter. We turn first to pollution, a broad category that includes air and water pollution by substances including metals, pesticides, plastics, and pharmaceuticals. Next we consider land use and biodiversity loss – two closely intertwined processes. After land we turn to freshwater – exploring the many ways in which humans have altered the planet’s hydrology. Finally, we explore how these many changes interact with each other in complex ways.
Pollution: A Multidimensional Challenge
Pollution has often been seen as primarily a local issue, with individuals or communities exposed to a nearby source – workers exposed to endocrine disruptors on the job, a neighbourhood near a contaminated former industrial site, a city choking on air pollution. Increasingly, however, pollution is recognized as a threat to health on a planetary scale.
Pollution interacts with many of the planetary boundaries (Reference Steffen, Richardson and Rockstrom1) that frame Planetary Health. One is climate change; a major proportion of fine particulate and ozone air pollution originates from sources that also emit carbon dioxide, the major greenhouse gas, and short-lived climate pollutants, including methane and black carbon. Carbon dioxide also leads to ocean acidification, another of the planetary boundaries. The boundary related to biogeochemical flows is defined largely by nitrogen and phosphorus flows, most of which are related to fertilizer use. As pollutants, these cause eutrophication of aquatic systems. Through such mechanisms pollution also contributes to biodiversity loss, yet another planetary boundary. Stratospheric ozone depletion is slowly reversing following the phaseout of ozone-depleting substances – CFCs – under the Montreal Protocol, a rare relative success story (although even this is being partly undermined by leakage of CFCs from sources such as refrigerators, air conditioners, and insulation foam blowing (Reference Lickley, Solomon and Fletcher2), and possibly from illicit production in China (Reference Rigby, Park and Saito3)) (see Chapter 1). For atmospheric aerosol loading, the boundary was initially set based on the impact on the Indian monsoons, but this is also a Planetary Health issue, as aerosols are a component of health-damaging air pollution.
Another reason to consider pollution as more than a local threat is that it spreads. Consider air pollution, which, while generally dominated by local sources, can reflect more distant sources as well. For example, on days when there are strong westerly winds, 12–24% of sulfates, 4–6% of carbon monoxide, and up to 11% of black carbon pollution detected in the air of the western USA is of Chinese origin (Reference Lin, Pan and Davis4). Another class of pollutants, the persistent organic pollutants or POPs, circulate on a global scale, and are routinely found in biota, including human tissues, thousands of kilometres from where they were made and used (Reference Ashraf5, Reference Scheringer6). Still another class of pollutants, the plastics, discarded in waterways, flow to oceans and accumulate in massive ocean gyres, cluttering the beaches of remote islands (Reference Almroth and Eggert7, Reference Villarrubia-Gómez, Cornell and Fabres8). So the interconnections of planetary processes, and the fact that pollutants know no boundaries, mark pollution as a Planetary Health problem – and one that, as discussed below, requires global cooperation to address. There is a proposed planetary boundary related to the introduction of novel entities, defined as ‘new substances, new forms of existing substances and modified life-forms that have the potential for unwanted geophysical and/or biological effects’ (Reference Steffen, Richardson and Rockstrom1), particularly when they are persistent, widely distributed, and potentially harmful to planetary processes or systems. Specifying a single boundary for a complex mixture of novel entities is, however, a challenge and is currently beyond the capabilities of the science community.
The Global Burden of Pollution
The Lancet Commission on Pollution and Health showed compellingly that pollution is a neglected cause of a large burden of ill-health (Reference Landrigan, Fuller and Acosta9). In 2018, the Commission estimated that 9 million deaths were attributed to pollution, amounting to 16% of premature deaths worldwide, three times as many as malaria, tuberculosis, and AIDS combined. Ninety two per cent of pollution-related deaths occur in low- and middle-income countries (LMICs) with the highest burden in rapidly industrializing countries.
Estimates of the disease burden from pollution, such as those of the Lancet Commission, are likely to understate the true burden, as depicted in Figure 3.1 (Reference Landrigan, Fuller and Acosta9). Pollutants in Zone 2 of the figure have adverse effects that are not fully characterized, precluding reliable estimates of disease burden; examples include soil pollution by heavy metals and toxic chemicals at contaminated industrial and mining sites. Zone 3 encompasses emerging chemical threats whose effects are only now coming into focus. These include developmental neurotoxicants; endocrine disruptors; new classes of pesticides such as the neonicotinoids; chemical herbicides such as glyphosate; and pharmaceutical wastes. As more is known about the effects of individual chemicals some will move from Zone 3 to Zones 2 and 1.

Figure 3.1. The ‘pollutome’, the totality of all forms of pollution with the potential to harm human health. GBD refers to Global Burden of Disease; for explanation see source.
Air Pollution
One of the sentinel events that raised public and professional awareness of the health effects of air pollution was the London smog of 1952. Between the 5th and 9th of December 1952, London was shrouded in a dense fog of air pollution from the burning of coal, and from December 1952 through March 1953, there were over 13,500 more deaths than normal. The relative importance of air pollution and influenza, which affected London immediately afterwards, has been a matter of debate, with subsequent estimates suggesting that about 12,000 deaths could have been due to air pollution (Reference Bell, Davis and Fletcher10). The serious public health consequences of air pollution led to the Clean Air Acts of 1956 and 1968, which introduced measures to dramatically reduce industrial and domestic fossil fuel emissions with great effect. Nevertheless, it is striking that over 65 years later many parts of the world are still struggling to effectively control air pollution. Even in London, despite considerable improvements in air quality and the banning of domestic coal burning, air pollution continues to claim up to 9400 premature deaths per year, reducing average life expectancy by about a year (11).
What Is Air Pollution?
Air pollution is a complex mixture of components, from a variety of sources. As such it varies from place to place. The principal components of air pollution are solid particles, suspended liquids, and gases. The particles (‘particulate matter’, or PM) are often considered by reference to their size (‘mean aerodynamic diameter’) in microns (μm), or millionths of a metre, because size has a bearing on health impact. The PM may be coarse or fine; the fraction smaller than 10 μm in diameter is referred to as PM10, and the even finer particles, smaller than 2.5 μm, as PM2.5. Finer particles penetrate more deeply into the lungs and are more closely associated with some adverse health outcomes. Ultrafine particles (PM0.1) pass through the alveolar-capillary membrane and are carried around the body via the bloodstream to virtually all tissues (Reference Schraufnagel, Balmes and Cowl12). The gases in air pollution include oxides of nitrogen (NOx) and oxides of sulfur (combustion by-products), hydrocarbons, carbon monoxide, and ozone. Ozone is known as a secondary pollutant; rather than being emitted from smokestacks and tailpipes, it forms in the air through complex atmospheric chemical reactions from precursors including volatile organic compounds, methane, and oxides of nitrogen.
Many other terms are used in reference to air pollution, including aerosols (suspended particles and/or liquids), smoke (a visible suspension of particles and gases formed by burning), haze (a visible suspension of water vapour and particles), and smog (a portmanteau of smoke and fog, a suspension of particles, oxides of nitrogen and sulfur, and ozone that is typically formed from combustion emissions and the photochemical reactions that result). While the most troublesome air pollution generally results from combustion, some occurs naturally; sources include vegetation (which releases hydrocarbons such as terpenes), lightning (which can generate oxides of nitrogen), and wind-blown dust (called ‘aeolian dust’ after Aeolus, the Greek God of wind). It is also increasingly recognized that agricultural ammonia emissions strongly contribute to fine particulate air pollution (PM2.5).
How Are People Exposed to Air Pollution?
Typically, air pollution is divided into two principal categories: household air pollution and outdoor, or ambient, air pollution. Household air pollution is most severe in places where people use solid fuels, such as wood, charcoal, coal, and dung, for cooking and heating. Ambient air pollution comes from power generation, agriculture, household sources, industry, and vehicles, and is generally most severe in cities in LMICs. Smoking tobacco also entrains a high concentration of particles and gases directly into the airways, and second-hand exposure to environmental tobacco smoke is a well-recognized cause of ill-health, although usually considered separately from ambient and household air pollution.
The pollution from power generation, industry, and transportation generally comes from fossil fuel combustion. Coal – used in power generation and industry – is the most polluting fossil fuel, and coal combustion is an important cause of both pollution and climate change. Each stage in the extraction, transport, processing, and combustion of coal generates a waste stream, and thus the full life cycle of coal results in multiple hazards for health and the environment. These costs are not borne by the coal industry and are thus often considered ‘externalities’, many of which are cumulative. One study focusing on Appalachia estimated that the life cycle costs of coal to the US public amounted to between a third and half a trillion dollars annually (Reference Epstein, Buonocore and Eckerle13). If these costs were fully taken into account in pricing, even using conservative assessments, the cost of coal would double or triple, making it economically non-viable against low-carbon alternatives and energy conservation. It will be necessary to leave at least a third of global oil reserves, half of gas reserves, and over 80% of current coal reserves unused from 2010 to 2050 in order to meet the Paris climate target of 2 ℃ warming above pre-industrial temperatures (Reference McGlade and Ekins14).
The relative contribution of different air pollution sources varies across different countries. Figure 3.2 compares the USA and India, using mortality rather than emissions as an indicator. India shows a much larger relative contribution from household sources and lower contribution from transport and other sectors compared with the USA (Reference Lelieveld, Haines and Pozzer15). The distribution of sources is likely to change as India moves to less-polluting household fuels such as LPG and private vehicle use increases.

Figure 3.2. Sources of mortality from air pollution in the USA and India. Percentages are the proportions of the deaths attributable to ambient air pollution. Excess deaths attributable to air pollution in 2015 were estimated at 120,000 (95% CI: 81,000–156,000) in the USA and 967,000 (753,000–1,150,000) in India. Natural refers to natural sources of air pollution, predominantly aeolian dust.
How Does Air Pollution Affect Health?
While air pollution is often treated as a single phenomenon, each pollutant has its own epidemiological features. One of the challenges faced by air pollution researchers is to disentangle the effects of different pollutants, particularly where these are often found together and concentrations are therefore strongly correlated. This is why multi-pollutant models are used to separate the effects of different pollutants on health. The strongest evidence linking air pollution and ill-health is for fine particulates and ozone (in the troposphere or lower atmosphere, rather than stratospheric ozone which shields the Earth’s surface against harmful UV rays), but NOx is also recognized as toxic.
Particulate matter is perhaps best recognized as a risk factor for cardiopulmonary mortality, following both short-term and long-term exposure (Reference Requia, Adams and Arain16–Reference Jaganathan, Jaacks and Magsumbol19). Recent research has helped establish a mechanistic basis for this association, demonstrating links between PM exposure and cardiometabolic risk factors including systemic inflammation (Reference Liu, Gu and Deng20), arrhythmias (Reference Yang, Liu and Qu21), high blood pressure (Reference Yang, Qian and Howard22), obesity (Reference An, Ji, Yan and Guan23), and diabetes (Reference Ma, Zhang, Sun, Xu and Li24, Reference Yang, Fan and Thiering25). Exposure to PM is also associated with a remarkably broad set of other risks, ranging from adverse birth outcomes (Reference Yuan, Zhang, Gao and Tian26, Reference Li, Huang and Jiao27) to neuropsychiatric disorders (Reference Tsai, Lin and Hwang28–Reference Donzelli, Llopis-Gonzalez and Llopis-Morales30), and it increases the risk of respiratory infections including tuberculosis (Reference Popovic, Soares Magalhaes and Ge31) and pneumonia (Reference Nhung, Amini and Schindler32). Whilst evidence is still emerging, and there are no widely accepted disease burden estimates for some of these outcomes (see also (Reference Landrigan, Fuller and Acosta9)), there are plausible pathways for many of them and the weight of evidence is growing over time.
Particulate matter is chemically different from place to place and source to source, and little is known about how different chemical forms of PM affect health risk. It is generally assumed that fine particles have similar effects irrespective of their source but this may be an oversimplification given their chemical diversity. An exception is black carbon (BC), a component of fine particulate matter emitted by combustion engines (notably diesel), residential burning of wood and coal, power stations using heavy oil or coal, open burning of agricultural wastes, and forest and vegetation fires. Black carbon seems to be more harmful at a given level of concentration than fine particles in general, perhaps because toxins are adsorbed onto the surface of BC particles. However, when expressed across the interquartile range the effects are similar to PM in general (Reference Janssen, Hoek and Simic-Lawson33). Black carbon is also a powerful short-lived climate pollutant, and when deposited onto snow and ice it accelerates melting and may also affect rainfall patterns.
Ozone was long recognized as a trigger of respiratory symptoms, especially in people with asthma and chronic obstructive lung disease, but recent research has confirmed that it also causes premature deaths: an estimated 1.04–1.23 million respiratory deaths annually in adults according to one study that used updated relative risk estimate and exposure parameters (Reference Malley, Henze and Kuylenstierna34). Increases in estimated attributable mortality were larger in northern India, southeast China, and Pakistan than in other locations. Like BC, ozone has environmental impacts in addition to its human impacts. In the stratosphere it protects the Earth against ultraviolet (UV) radiation. In the lower atmosphere (the troposphere), it functions as a GHG, and its toxicity extends to plants, so higher levels of ozone reduce agricultural output (Reference Mills, Sharps and Simpson35).
The effects of NOx have been more difficult to disentangle from the effects of PM and ozone. The Committee on the Medical Effects of Air Pollution in the UK undertook an assessment of the independent contribution of NO2 to premature deaths from air pollution (36). They were unable to achieve complete consensus but a majority of the Committee, having considered the evidence from meta-analyses of seven available cohort studies including measurements of two (six studies) and three (one study) pollutants concluded that NO2 probably has an independent effect on mortality in addition to that of PM. Studies of the toxicology of NO2 and chamber studies, in which volunteers are exposed to different concentrations of NO2, also provide evidence of adverse effects on the respiratory tract. Overall the uncertainties do not allow robust global estimates of the independent effects of NO2 on premature deaths, but it is clear that NO2 is hazardous to human health. There is increasing concern that NO2 contributes to the burden of asthma in children. A study of the NO2-attributable burden of asthma incidence in children aged 1–18 years in 194 countries and 125 major cities estimated that 4.0 million (95% uncertainty interval [UI] 1.8–5.2) of new paediatric asthma cases could be attributable to NO2 pollution annually, accounting for 13% (Reference Scheringer6–Reference Requia, Adams and Arain16) of global incidence (Reference Achakulwisut, Brauer, Hystad and Anenberg37). This NO2 exposure is largely a result of traffic-related air pollution (TRAP) and about two-thirds of these cases occur in cities.
What Is the Health Burden of Air Pollution?
There are varying estimates of deaths from ambient air pollution depending on how exposures are estimated and the assumed relationship between exposure and health outcome. The WHO estimated that 4.2 million premature deaths worldwide in 2016 could be attributed to ambient air pollution from PM2.5 (38). More recent research, based on a novel Global Exposure Mortality Model and using data from dozens of cohort studies, suggests that ambient air pollution accounts for nearly 9 million premature deaths globally each year, substantially higher than previous estimates (Reference Burnett, Chen and Szyszkowicz39, Reference Lelieveld, Pozzer and Pöschl40). This is mainly from exposure to PM2.5 although exposure to tropospheric ozone is also included in this estimate. Furthermore, this recent research shows that even levels of air pollution below the WHO guideline levels could have adverse effects on health. Since 91% of the world’s population is exposed to pollution levels above the guideline level of 10 μg/m3 annual mean, this implies that virtually all of us are breathing polluted air at levels sufficient to harm our health. This rivals the burden of disease from cigarette smoking, and averaged across the global population it translates into 2.9 years of life lost per person, with the impact greatest in China, India, and parts of Africa.
Some of the reduced life expectancy is due to the effects of pollution on children (Reference Lelieveld, Haines and Pozzer15). A study combining data from nearly 1 million births in Sub-Saharan Africa with satellite-based measurements of exposure to PM2.5 suggested that PM2.5 concentrations above minimum exposure levels were responsible for 22% (95% CI: 9–35) of infant deaths in the 30 study countries, resulting in a total of 449,000 (95% CI: 194,000–709,000) additional deaths of infants in 2015. This figure is about three times higher than previous estimates (Reference Heft-Neal, Burney, Bendavid and Burke41). Such research is difficult in low-income countries where exposures are often high, as air pollution measurements are often lacking.
Table 3.1 shows the impact of air pollution, expressed in disability-adjusted life years (DALYs), on key health outcomes in countries at different income levels. Overall, air pollution accounts for large proportions of respiratory and cardiovascular disease and lung cancer.
Table 3.1. Percentage of disability-adjusted life-years (DALYs) attributable to air pollution (household plus ambient) by disease and country income group
Not all air pollution is caused by human activities; anthropogenic (i.e. human-related) air pollution is thought to cause the premature deaths of about 5.5 million people every year (see Figure 8.5) (Reference Lelieveld, Klingmüller and Pozzer42). This suggests the potential for large public health gains by addressing the preventable causes of air pollution, for example by phasing out the use of fossil fuels and other sources of pollution from human activities. Many of these policies can also reduce GHG emissions and therefore benefit the climate as well as health (see Chapters 8 and 12).
Air Pollution Trends
Overall, trends in ambient air pollution present a mixed picture. Global deaths just from fine PM are estimated to have increased by about 20% between 1990 and 2015 as a result of population growth, ageing populations, and increasing levels of air pollution in LMICs (Reference Landrigan, Fuller and Acosta9). More recently there have been perceptible improvements in China. During the 2020 COVID-19 pandemic, economic activity and therefore air pollution fell dramatically in locations such as Italy, China, and India (Reference Liu, Wang and Zheng43, Reference Dutheil, Baker and Navel44) – a fortuitous development, as air pollution emerged as a possible risk factor for COVID-19 mortality (Reference Wu, Nethery, Sabath, Braun and Dominici45). People with conditions to which air pollution contributes, such as heart disease, stroke, chronic obstructive pulmonary disease, and diabetes are also at an increased risk of death from COVID-19. However, we should not interpret these short-term falls in air pollution as an unalloyed positive development because the economic contraction was catastrophic for people’s livelihoods and health. Increased poverty related to the COVID-19 economic depression will probably force more people to burn cheap but polluting solid fuels in the home. Economic recovery will be accompanied by large increases in air pollution and GHG emissions in the absence of active policies to prevent that happening (see Chapter 12).
In all countries, the poor and marginalized tend to be exposed to higher levels of air pollution than wealthier groups. Under a business as usual scenario in which no new pollution controls are implemented, ambient air pollution-related deaths are projected to increase by about 50% worldwide by 2050, with the ageing population (older adults being more susceptible to the effects of air pollution than younger adults) being a major factor. The growing cities of South and Southeast Asia are particularly likely to experience large increases in air pollution-related deaths. In high-income countries air pollution levels have declined but populations are still exposed to unacceptably high levels responsible for large numbers of deaths and a high disease burden. Household air pollution, which also contributes substantially to ambient air pollution particularly in some LMICs, is declining in many parts of the world as a result of reductions in poverty and access to cleaner fuels.
Microbial Contamination of Water
Water pollution is also a major killer although key sources differ in their estimates of the total disease burden. This likely reflects, in part, different definitions of ‘safe water’; the WHO considers only access to an improved water source whereas the Global Burden of Disease Study (GBD) requires safe water at both point of access and point of use (Reference Landrigan, Fuller and Acosta9). Under the Millennium Development Goals, which shaped the global development agenda from 2000 to 2015, considerable progress was made in water and sanitation, particularly in urban settings. From a baseline of 1990, 2.6 billion people achieved access to improved drinking water sources and 2.1 billion people gained access to improved sanitation by 2015. As a result of these and other improvements, for example in effective hand hygiene and treatment with oral rehydration, worldwide child deaths from diarrhoeal disease fell by about 60%. Nevertheless, over 2 billion people still have unimproved sanitation, with nearly a billion practising open defecation (Reference Landrigan, Fuller and Acosta9). These populations represent large numbers of people who have not benefitted substantially so far from the advances of humanity in the Anthropocene and are at increased vulnerability to the consequent dramatic changes in the global environment to which they have contributed little. The numbers quoted above do not include those affected by chemical contamination of water supplies for which no comprehensive assessments have been published on a global scale.
Planetary trends may contribute to microbial contamination of water at the local level. For example, water-borne diseases such as those caused by E. coli, salmonella, shigella, and campylobacter are more common during warm weather (Reference Ghazani, FitzGerald, Hu, Toloo and Xu46–Reference Levy, Woster, Goldstein and Carlton48) – a risk that is likely to rise with continued heating (Reference Alexander, Carzolio, Goodin and Vance49). Severe rainfall events are also associated with increases in diarrhoea (Reference Curriero, Patz, Rose and Lele50). As meat consumption rises globally, and with it industrial livestock production, increased microbial contamination of surface and groundwater from animal feed operations may occur (Reference Lewis, Atwill and Lennox51, Reference Anderson and Sobsey52). Planetary trends, from temperature to rainfall to food system dynamics, are reflected in water quality in many places.
Chemical Pollution
Humans have used chemicals for thousands of years: combining alkali and limestone to make glass, sulfur and saltpetre to make explosives, and sulfur and bitumen to make poison gas; smelting copper, tin, and arsenic to make bronze; using asphalt as building mortar and ship caulking and lead to make pipes. But the Anthropocene has featured a massive scale-up of chemical manufacturing and use. Naturally occurring chemicals have continued to be used, but an entire industry has grown up around synthetic chemicals as well (Figure 3.3). Only a minority of these have been adequately tested for toxicity to humans. The volumes of synthetic chemicals produced are impressive; the most recent values, for example, are 6 × 10⁶ tonnes of pesticides globally, and 0.23 × 10⁶ tonnes of US pesticides (Reference Bernhardt, Rosi and Gessner53).

Figure 3.3. Upscaling of the chemical industry over the past half century. Trends in the global trade value of synthetic chemicals (in both developed and emerging economies), and for the pesticide and pharmaceutical chemical sectors individually. Note: All trends are shown relative to 1970 values, except pharmaceutical consumption, where the earliest data reported are from 1975. Silent Spring refers to the book by Rachel Carson, published in 1962 by Houghton Mifflin, which raised public awareness of the pervasive environmental effects of the indiscriminate use of pesticides (see p. 92).
Persistent Organic Pollutants and Endocrine Disruption
Emblematic of the challenges of modern chemical exposure are persistent organic pollutants (POPs). As the name implies, these are synthetic organic chemicals that are toxic to humans and wildlife and remain for many years in the environment. They are widely distributed, including in areas far from their original use. They also bioaccumulate, particularly in fatty tissue where they can be 70,000 times more concentrated than the background levels, and concentrations increase at higher levels in the food web.
One of the most important health impacts of POPs is interference with hormone action (Reference Trasande, Zoeller and Hass54, Reference Schug, Johnson and Birnbaum55). A wide range of products, including some that are not POPs, are implicated as endocrine-disrupting chemicals (EDCs); these include pharmaceuticals, personal care products, and commercial chemicals. The EDCs are suspected of causing wide-ranging adverse health effects in humans and animals (Reference Matthiessen, Wheeler and Weltje56). Reasons for concern include the increasing prevalence of endocrine disorders in humans, together with endocrine-related effects in wildlife and evidence from laboratory experiments that exposure to such chemicals increases the risk of endocrine abnormalities. Amongst the observations causing concern are:
Up to 40% of young men in some countries have poor quality semen with low sperm counts which may impair fertility (Reference Levine, Jorgensen and Martino-Andrade57, Reference Virtanen, Jørgensen and Toppari58).
Rates of genital malformations including undescended testicles and penile malformations (hypospadias) in baby boys are rising, and in some cases have plateaued at high levels (Reference García, Ventura and Requena59, Reference Skakkebaek, Rajpert-De Meyts and Buck Louis60).
Endocrine-related cancers (including breast, endometrial, prostate, ovarian, testicular) are rising globally, increases that are not fully explained by more complete detection and diagnosis (Reference Soto and Sonnenschein61).
There are global increases of neuro-behavioural disorders, in some cases linked with thyroid abnormalities, with evidence that EDCs contribute (Reference Jurewicz, Polanska and Hanke62–Reference Demeneix64).
Metabolic disorders related to endocrine disruption have been found among amphibians, which may help explain declines in amphibian and other wildlife populations (Reference Matthiessen, Wheeler and Weltje56, Reference Regnault, Usal and Veyrenc65).
About 800 chemicals are known or thought to disrupt endocrine function by interfering with hormone receptors, hormone synthesis or conversion. However, only a small proportion has been rigorously tested in intact organisms and in some cases no internationally recognized and validated tests exist. Children may have higher exposures than adults because of their hand-to-mouth behaviours and high metabolic rates, and are especially susceptible because of their developmental stage (Reference Landrigan and Etzel66). Both humans and animals are exposed to multiple EDCs simultaneously; this further complicates assessment of causal relationships and raises additional concerns about the potential for additive or synergistic effects. The EDCs can also interfere with fat storage and metabolism, bone development, and the immune system, suggesting the potential for even more pervasive effects than the above examples.
Using rigorous approaches based on those developed by the IPCC and WHO criteria for assessing the strength of evidence, an international panel of scientists achieved consensus at least for probable (>20%) causation by EDCs for a range of health outcomes (Reference Trasande, Zoeller and Hass54): IQ loss and intellectual disability, autism, attention-deficit hyperactivity disorder, childhood and adult obesity, adult (type 2) diabetes, undescended testes, male infertility, and mortality associated with reduced testosterone. Accounting for probability of causation, for which they used the midpoint of the range for each outcome, they estimated a median cost of €157 billion in Europe, corresponding to 1.23% of EU GDP. The EU has better regulation than many other regions of the world so it is likely that the burden is now or will become even higher in other regions, if such chemicals are allowed to be widely used and disseminated.
Plastics
Plastics are malleable materials made from synthetic organic compounds, typically polymers, that can be formed into a wide range of objects, from packaging to consumer goods to building components. The monomers used to form plastics include ethylene, propylene, styrene, urethane – all familiar terms when preceded by ‘poly’. In addition to the polymer itself, plastic products typically contain chemical additives such as plasticizers (to achieve desired texture), flame retardants, stabilizers, and colourants (Reference Hahladakis, Velis, Weber, Iacovidou and Purnell67). While some plastic products are relatively durable, others are intended to be used just once and disposed of.
Plastics present both opportunities and challenges for health. Benefits include protection of foods from bacteriological contamination, water storage, and reduced transport emissions due to the light weight of components and containers. The challenges are increasingly apparent; they arise from the relative indestructability of plastic molecules and fragments, the potential for wide dispersion in terrestrial and marine environments, the potential to contaminate soil, water, and air, the migration of additives and other compounds from plastics into the food chain, and the toxicity of some of these compounds. While some monomers are relatively innocuous, others are more worrisome. For example, bisphenol A (BPA), the building block of polycarbonates, acts as an oestrogen disruptor (Reference Abraham and Chakraborty68, Reference Ma, Liu and Wu69), and vinyl chloride, used to make PVC for everything from plumbing pipes to electrical cables, from beverage bottles to credit cards, causes both hepatocellular carcinoma and angiosarcoma of the liver at high exposures (70). Similarly, some plastic additives are toxic. For example, the plasticizers known as phthalates act as endocrine disruptors, and have been associated with impaired neurodevelopment in children and ailments as diverse as reduced sperm counts, diabetes, and obesity across the lifespan (Reference Radke, Braun, Meeker and Cooper71–Reference Zhang, Chen, Huang, Wang and Wu73). The burden of disease from such pollution is currently unknown but there are legitimate grounds for concern.
Migration of additives leading to human exposure can occur during the three life-cycle phases of plastics – production, use, and end of life (Figure 3.4). For example, uncontrolled burning of plastics can release metals such as antimony and bromine (Reference Zhan, Zhao, Ahmad and Xu74) as well as POPs including dioxin, and disposal in landfill is inefficient whilst potentially leading to local contamination of soil and water. Unregulated recycling can result in potentially hazardous levels of contaminants in children’s toys and food packaging. The effects of some emerging practices, such as the incorporation of plastic waste into bitumen road surfaces, which may only last 4–6 years, are unknown because the risks have not been adequately assessed.

Figure 3.4. The life cycle of plastic products (excluding energy input and emissions) created in STAN (subSTance flow ANalysis) software.
A large quantity of plastic ends up in waterways, and then flows into oceans. Estimates of the total volume of plastics entering the oceans range from 4.8 to 12.7 million tonnes (Mt) per year (Reference Jambeck, Geyer and Wilcox75). Marine plastic pollution is a growing problem with immediate impacts on a range of marine ecosystems and potential implications for human health, considering that the seas provide food for billions of people. Plastics can cause direct damage to a range of species by entanglement, smothering, and ingestion and may allow invasive species to spread to new locations by providing a resilient platform capable of travelling great distances (Reference Gregory76). Plastic and other debris are increasingly found in fish and shellfish for human consumption. In Indonesian markets, for example, 28% of individual fish and 55% of all species contained plastic debris, and in US markets, anthropogenic debris was found in 25% of individual fish and in 67% of all species but was primarily synthetic fibres (Reference Rochman, Tahir and Williams77).
In December 2017 China, which had been at the centre of the global recycling trade in plastic waste, having imported a cumulative total of 45% of plastic waste since 1992 (Reference Brooks, Wang and Jambeck78), dramatically curtailed non-industrial plastic waste imports with little notice, having recognized the costs in terms of ill-health and environmental damage of often poor-quality waste. The ban affected eight types of plastic waste in the commercial recycling stream, including polyethylene (PE), polystyrene (PS), polyvinyl chloride (PVC), polyethylene terephthalate (PET), and polypropylene (PP), as well as bales of PET plastic bottles, aluminium plastic film, and compact/digital video disks. Whilst this led to increases in imports to other Asian countries such as Vietnam and Thailand, they will not be able to make up for the loss of Chinese imports and are likely to increasingly regulate their own imports. Most of the exports are from high-income countries, with the EU being collectively the largest exporter. In the medium to long run this restriction on imported waste is likely to increase pressures for the development of a circular economy (see Chapter 12), although it will also increasingly pose threats to health in many countries with inadequate regulation.
Pharmaceutical Pollution
Worldwide about 600 pharmaceutical compounds have been detected in the environment – particularly in aquatic systems, notably surface waters (Reference aus der Beek, Weber and Bergmann79, Reference Küster and Adler80). There is growing pollution of rivers by pharmaceutical agents, which in some studies dissipate very slowly after discharge from sources such as wastewater treatment plants. A study that measured the concentrations of five commonly used pharmaceutical agents in UK rivers showed negligible degradation of these agents 5 km downstream from the source, suggesting that freshwater ecosystems are widely exposed to substantial concentrations (Reference Kay, Hughes, Ault, Ashcroft and Brown81). Pharmaceuticals used in humans and animals may affect ecosystems even at low exposure levels; for example, antidepressants affect the growth and feeding behaviour of fish (Reference Martin, Saaristo and Bertram82–Reference Ford and Fong84) and diclofenac (a non-steroidal anti-inflammatory drug) has caused kidney failure in vultures that ate the carcasses of domestic animals given the drug, resulting in population declines of this important scavenger (Reference Green, Newton and Shultz85). Hormonal medications may affect the endocrine systems of fish, molluscs, invertebrates, and birds, and antiparasitic agents may affect worms, aquatic invertebrates, and insects. Environmental risk assessments in Europe show that about 10% of pharmaceutical agents pose risks (Reference Küster and Adler80). But many compounds have not yet been adequately assessed.
A key priority is to address the spread of antimicrobial resistance (AMR), which threatens the progress made since the middle of the last century in reducing the deaths and illness from many infectious diseases. Figure 3.5 summarizes the drivers of antibiotic resistance and environmental hotspots from which spread is likely. The contamination of freshwater sources with antimicrobial agents from unregulated pharmaceutical company effluent in India has been well documented and is associated with the selection and dissemination of antibiotic-resistant organisms such as carbapenemase-producing pathogens (Reference Lübbert, Baars and Dayakar86). A large majority (86%) of bacterial strains sampled from a wastewater treatment plant serving bulk production pharmaceutical companies in India were resistant to 20 or more antibiotics and showed a high prevalence of integrons that permit the exchange of genetic material with other organisms and could therefore facilitate the transmission of antibiotic resistance to pathogenic bacteria (Reference Marathe, Regina and Walujkar87). Other sources of antibiotic pollution in the environment include from use in animals, aquaculture, agricultural run-off (from the spreading of manure and sewage sludge) and from municipal and industrial wastewater. Importantly, other compounds such as heavy metals, biocides (i.e. disinfectants and surfactants), natural substances (e.g. plant-derived) and xenobiotics (e.g. solvents such as octanol, hexane, and toluene) can also select for resistance genes (Reference Singer, Shaw, Rhodes and Hart88). A complex combination of factors determines the prevalence of resistance genes in the environment that reflect a dynamic balance between fitness costs and benefits. Evidence suggests that antimicrobial resistance in common pathogens increases with local temperature and population density (Reference MacFadden, McGough, Fisman, Santillana and Brownstein89). It is therefore plausible to suggest modest increases in the threat of antimicrobial resistance as a result of climate change.

Figure 3.5. Schematic of the environmental hotspots and drivers of antimicrobial resistance (AMR).
There is an extraordinary range of antibiotic use in animals among European countries, from a low level of 3.1 mg/PCU (population correction unit) in Norway to a high of 423.1 mg/PCU in Cyprus (90), with levels declining in many countries since 2010. This suggests that profligate antibiotic use may not be necessary to achieve highly productive agricultural systems and that current patterns of use in some countries may reflect differences in regulatory mechanisms and their enforcement rather than an objective and comprehensive assessment of their benefits and risks. A policy imperative is to reduce the veterinary use of antimicrobial agents that are needed to treat infections in humans. However, the drivers of antimicrobial pollution share many of the characteristics of other pollution sources, such as vested economic interests, and merely focusing on promoting more appropriate veterinary and medical prescribing will not suffice to resolve the pressing challenges to public health and to ecosystems. In addition to reducing antibiotic misuse in human and veterinary use, biocide use in personal care and household products will need to decline; and capture, re-use and recycling of metals within the waste stream will need to be promoted.
Pesticides
Pesticides – including insecticides, fungicides, and herbicides – are used worldwide to protect crops against insects, fungi, and weeds, and are also used by public health authorities in vector control programmes to reduce populations of insect vectors of disease. The range of chemicals used as pesticides is broad and a full exposition is beyond the scope of this chapter, but is available elsewhere (Reference Pohanish91).
While pesticides have played an important role in public health, both in protecting crops from pests and therefore in raising agricultural output, and in controlling vectors of infectious diseases, pesticides have also had unintended harmful consequences for both humans and the planet. It was DDT, an organochlorine pesticide that found wide use following World War II, that inspired Rachel Carson’s 1962 classic book, Silent Spring, which helped launch the modern environmental movement.
Pesticides are toxic: this is intrinsic to their control of unwanted pest species. But in practice, the toxic effects of pesticides often manifest beyond the target species, and beyond the desired time and place of action. Many classes of pesticides are toxic to humans. The acute toxicity has long been recognized; in fact, organophosphates have been used not only as insecticides but also as chemical warfare agents, precisely because of their human toxicity. The research community was slower to recognize chronic effects of pesticides, but these are now well established, and range from cancer to neurotoxicity (Reference Alavanja, Hoppin and Kamel92). Recent years have seen a growing awareness of toxic effects following very low dose exposures, including endocrine disruption (Reference Combarnous93).
People are exposed to pesticides through various routes, including occupational exposures, ingestion of pesticides in food, and intentional ingestion. Ingestion of foods contaminated with pesticides affects the largest number of people. The risk of such exposures is assessed and managed in standard ways by the World Health Organization and many national governments. It begins with hazard identification, which classifies substances according to their adverse effects on health (94). A well-known example is the International Agency for Research on Cancer classification of substances with respect to carcinogenicity. Next, the level of risk is assessed, and an Acceptable Daily Intake (ADI) is established accordingly. For pesticide residues in food, this is carried out jointly by two UN bodies: the Food and Agriculture Organization and the World Health Organization (95). The ADIs, in turn, support the setting of maximum residue limits (MRLs) in food – the levels of pesticides, or their residues, that if consumed over a lifetime are expected not to have adverse effects, and that are therefore permitted in foods. National authorities are expected to enforce adherence to MRLs. In the UK, for example, the Expert Committee on Pesticide Residues in Food monitors such residues. In 2018, it oversaw the analysis of 3385 samples of 40 different types of food, of which 45% contained a residue (96). However, only five samples were referred to the Food Standards Agency because of concerns about threats to human health and 21 were referred to the Health and Safety Executive because they contained pesticides either prohibited for use in the UK or for the crop in question. The concern must, therefore, particularly be for countries where no such mechanisms are in place or where they do not function effectively. In these circumstances, older pesticides that persist in the environment for many years may continue to be used and newer pesticides may be used at levels that exceed the threshold for unacceptable risks to human health.
Suicide by pesticide is a particular tragedy. Pesticides are often the most readily available means of suicide, especially in rural areas. A systematic review of the evidence conservatively estimated that there are 258,234 (plausible range 233,997 to 325,907) deaths from pesticide self-poisoning worldwide each year, responsible for 30% (range 27% to 37%) of suicides globally (Reference Gunnell, Eddleston, Phillips and Konradsen97). Furthermore, the authors documented wide geographical differences in the relative contribution from 4% in the European region to 50% in the western Pacific region. These differences were related not to total volume of pesticides sold but to differences in the toxicity and patterns of use. Global trends signal the need for ongoing concern. Rural communities in India and elsewhere confront increasing stress as a result of climate change and other environmental stressors, increasing suicide risks for farmers (Reference Merriott98, Reference Carleton99). At the same time, pesticide use will likely increase as a result of increases in pests from climate change (Reference Delcour, Spanoghe and Uyttendaele100). Solutions must include reducing the toxicity of pesticides, developing climate-resilient agricultural practices, and robust social and mental health safety nets for rural communities.
Pesticides also have environmental impacts beyond those intended. They can contaminate surface and groundwater, soil, and biota. While some pesticides are degraded relatively rapidly, others can persist in these environmental media for prolonged periods, bioaccumulating and bioconcentrating. Other species than the targeted pests may be poisoned, ranging from insects (including some that are beneficial) to a variety of plants, birds, and mammals. These can lead to feedback loops and second-order effects. For example, the neonicotinoid class of pesticides is implicated in reducing pollinator populations, which can in turn reduce the productivity of crops and other plants (Reference Sanchez-Bayo, Goulson and Pennacchio101). Soil fertility can be compromised as the result of disruptions of microbial communities (Reference Prashar, Shah and Lichtfouse102). Importantly, pesticide resistance develops among many target species, an entirely unsurprising manifestation of evolutionary principles, emphasizing the need for reducing reliance on pesticides in favour of multifaceted approaches to agricultural productivity (Reference Gould, Brown and Kuzma103) (see Chapter 10).
Exposure to Lead and Other Metals
The effects of lead exposure have probably been more widely studied than those of all toxic pollutants. People began to mobilize lead from natural geological reservoirs during the Bronze Age (as early as 5000 years ago), leaving enough stratigraphic evidence that some have suggested this legacy as a marker for the early Anthropocene (Reference Wagreich and Draganits104, Reference Hong, Candelone, Patterson and Boutron105). Lead was widely used in pipes and food and water vessels in Roman times (Reference Delile, Blichert-Toft, Goiran, Keay and Albarède106), and Pliny accurately described the signs and symptoms of lead poisoning (Reference Waldron107). In modern times, lead was best recognized as an occupational hazard. But in the last two centuries, as lead was used for water piping, incorporated into products such as paint, and added to petrol (gasoline) to improve engine performance, general population exposure became widespread. For example in the USA, where lead was widely used in petrol until the 1980s, childhood exposure is estimated to have reduced population intelligence significantly, such that the number of people with superior intelligence (an IQ over 130) fell by half and the number with an IQ below 70 doubled (Reference Colborn, Dumanoski and Myers108). Figure 3.6 illustrates how a 5-point reduction of IQ from population exposure to a pollutant can greatly affect the proportion of people with very low and high IQs. Lead affects lifetime prospects; with a negative impact on IQ, an increased risk of attention-deficit hyperactivity disorder (Reference Donzelli, Carducci and Llopis-Gonzalez109), and an association with antisocial and criminal behaviours (Reference Needleman, Riess, Tobin, Biesecker and Greenhouse110, Reference Nevin111), it is little wonder that childhood lead exposure is associated with reduced socioeconomic circumstances later in life (Reference Reuben, Caspi and Belsky112). According to one analysis, reducing blood lead levels to less than 1 μg/dL among all US children between birth and age 6 years would increase timely secondary school graduation rates and reduce crime, yielding net societal benefits of US$50,000 (SD, US$14,000) per child annually at a discount rate of 3% and overall estimated savings of about US$1.2 trillion (SD, US$341 billion) (Reference Muennig113). The socioeconomic impacts are also large in LMICs; foregone earnings are lower in less affluent economies, but the impact at the individual level potentially larger because of more severe exposures (Reference Attina and Trasande114).

Figure 3.6. Model of intelligence losses associated with a mean 5-point drop in IQ of a population of 100 million.
Long-term exposure to lead also increases the risks of cardiovascular diseases, including hypertension, ischaemic heart disease, stroke, cardiac arrhythmias, and peripheral arterial disease, which account for the majority of deaths attributable to lead in adults (see (Reference Landrigan, Fuller and Acosta9) for overview). Further, this relationship holds at comparatively low levels of lead in the blood. Although lead-free petrol is now used in 175 countries, widespread contamination has left a long-term legacy that is still being felt. Global estimates of deaths and disability due to lead, which amount to 0.5 million premature deaths and 9.3 million life-years lost (DALYs) in 2015 according to the GBD study, do not take into account exposure at lead battery recycling sites (see p. 96) (9). The WHO estimates somewhat higher impacts on DALYs and that 0.6 million children suffer from mild to moderate mental retardation as a consequence of lead poisoning (see (9) for more detail).
Lead is only one of a group of metals of hydrogeological origin that human activity has helped disseminate, threatening human health. Others include arsenic, cadmium, mercury, and copper. Arsenic and cadmium are classified by the International Agency for Research on Cancer as group 1 carcinogens. A systematic review of 37 studies including nearly 350,000 participants looked for evidence that these metals affect the risk of cardiovascular disease, an important contributor to the global burden of disease. Arsenic, lead, cadmium, and copper were all independently associated with substantial and highly significant increases in cardiovascular disease risk, after adjustment for confounders such as smoking. The only exception was mercury (largely from fish consumption) for which there was no increase in risk (Reference Chowdhury, Ramond and O’Keeffe115). Falling levels of environmental metals in the USA as a result of reductions in smoking and air pollution and tighter regulations may have contributed to declines in cardiovascular disease over recent decades, but in other parts of the world exposures to a range of pollutants may be increasing, for example due to increased trade in electronic waste.
Mercury exemplifies the human disruption of natural systems, with resulting health consequences, in several ways. First, humans have come to dominate the cycling of this metal. Anthropogenic emissions of mercury have been higher than natural emissions for about 200 years, and currently account for about 90% of the flux of mercury – about one-third of this from current anthropogenic emissions and about two-thirds from ‘re-emissions’ of previously released mercury (116). Second, mercury emissions are large and consequential. Global mercury emissions total about 2000 tonnes per annum. Without improved controls, emissions of mercury are projected to rise. The main sources are coal burning and artisanal mining followed by the production of ferrous and non-ferrous metals and of cement. Third, emissions are not uniformly distributed. Almost half the mercury emissions arise from Asia as a result of growing industrialization, and considerable emissions occur in deprived areas of Africa, Latin America, and Asia, where artisanal gold mining accounts for about 20% of the global gold supply (Reference Steckling, Tobollik and Plass117). The Lancet Commission on Pollution and Health estimated that between 14 and 19 million artisanal and small-scale miners were exposed to hazardous levels of mercury. Mercury is mixed with gold-containing materials and then heated, vaporizing the mercury to yield gold. Fourth, this human activity alters ecosystems. Anthropogenic emissions have doubled mercury levels in the top 100 metres of the ocean over the past 100 years, with slower increase in the deep layers of the ocean. However, in parts of the Atlantic levels are decreasing, showing that reduced emissions from North America and Europe are starting to have an effect and reinforcing the need for better regulatory policies elsewhere. Fifth, global-scale processes such as organification and bioconcentration affect the fate and transport of emitted mercury. Micro-organisms in soil and water convert inorganic mercury to a highly toxic organic form, methylmercury, which is recycled in the biosphere for decades or centuries. Concentrations of methylmercury in plankton are as high as 10,000 times the concentration in seawater, and rise as methylmercury is biomagnified up the food web. In some species of Arctic marine animals, average mercury content has increased by 12 times since the pre-industrial period. Finally, mercury is toxic to humans, principally through effects on the nervous system in adults and impaired neurological development in children, but with widespread effects on other organs as well (Reference Rice, Walker, Wu, Gillette and Blough118). Some indigenous populations consume large amounts of top marine predators – fish, whales, and seals – and are, therefore, exposed to high levels of mercury. Among populations that consume seafood regularly, pregnant women and young children are particularly at risk because exposure in utero is associated with developmental neurotoxicity (e.g. deficits in fine motor skills, language, and memory). As in the case of lead, this could have serious implications for future educational and economic prospects and employment (Reference Sheehan, Burke and Navas-Acien119).
Waste Dumping
A particularly disturbing aspect of global chemical contamination is the transfer of waste from producer countries to receiving countries, known as dumping. Many low-income countries lack the governance and regulatory systems needed to detect, interdict, and prevent potentially hazardous imports. The Basel Convention on the Control of Transboundary Movements of Hazardous Wastes and Their Disposal, which entered into force in 1992, was intended to control such dumping, but it has had only limited success. The Lancet Pollution Commission reported that 61 million people in the 49 countries surveyed to date are exposed to heavy metals and toxic chemicals at contaminated sites. Although clearly an underestimate because there may be hundreds of thousands of sites globally, this illustrates the scale of the potential threat to health (Reference Landrigan, Fuller and Acosta9). The Commission estimated that between 6 million and 16 million people were exposed to hazardous levels of lead at sites where lead batteries were recycled. These activities take place in a range of low-income settings around the world – particularly in Sub-Saharan Africa – and illustrate the dangers of exposure to toxic hazards in countries that lack the capability and/or political will for adequate regulation.
Electronic waste, or e-waste, has emerged as a major form of international waste transfer. The global quantity of e-waste generated from end-of-life electronic equipment in 2016 was estimated to be about 44.7 Mt, or 6.1 kg per capita (Reference Baldé, Forti, Gray, Kuehr and Stegmann120). The problem is increasing; the global value of trade in e-waste is estimated to have risen from US$9.8 billion in 2012 to US$41.4 billion in 2019. Only about 20% of e-waste generated is documented for collection and recycling and the fate of the majority of e-waste is unrecorded. Europe generates the second highest per capita levels of e-waste (16.6 kg/person), after Oceania which contributes little in absolute terms, but also has relatively high recycling rates (35%). The Americas generate 11.6 kg/person but with lower recycling rates (17%). Asia generates only 4.2 kg/person but because of its vast population and low recycling rates is responsible for about 40% of the total global e-waste. Of the waste exported much ends up in countries that are ill-equipped to recycle the waste safely. Studies by the Basel Action Network, placing GPS trackers in exported e-waste, have shown that 87% of e-waste exported from the USA ended up in Asia, the majority in Hong Kong (Reference Hopson and Puckett121), while most exported e-waste from Europe went to Nigeria, Ghana, and Tanzania (Reference Puckett, Brandt and Palmer122).
Reclamation of valuable elements such as gold and copper from e-waste has become an income-generating activity in some poor communities but exposes people, including children, to a range of toxic pollutants including lead, cadmium, chromium, brominated flame retardants, and polychlorinated biphenyls (PCBs) through direct contact, inhalation of toxic fumes, or contamination of soil and water. A 2013 systematic review of studies of the health effects of e-waste exposure found 23 epidemiological studies meeting quality criteria, all in southeast China (Reference Grant, Goldizen and Sly123); the literature has continued to expand substantially with later reviews (Reference Okeme and Arrandale124, Reference Vaccari, Vinti and Cesaro125) and published accounts focusing on India (Reference Mishra126, Reference Awasthi, Wang, Wang, Awasthi and Li127), Pakistan (Reference Waheed, Khan and Sweetman128), Indonesia (Reference Soetrisno and Delgado-Saborit129), and Africa (Reference Orisakwe, Frazzoli, Ilo and Oritsemuelebi130). In general, these studies have found adverse health effects both in exposed workers and in nearby communities, including adverse birth outcomes, reduced thyroid function, behavioural changes, decreased lung function, and evidence of genetic damage.
Land Use Change, Biodiversity Loss, and Disease Risk
Land Use
The land use changes described in Chapter 1 threaten human health in direct and indirect ways. Some key examples include water-borne diseases, vector-borne diseases, and zoonotic diseases.
Forest alterations can have a major impact on stream and river flow and on water quality. One study examined watershed quality in relation to diarrhoeal disease risk in children. Among nearly 300,000 children under 5 years of age in 35 countries, after controlling for socioeconomic factors, the presence of improved water and sanitation, and other potential confounders, more intact tree cover in the upper watershed reduced the probability of diarrhoea in children in downstream communities. Thirty per cent more tree cover offered roughly the same protection as improved sanitation infrastructure (but not as much as wealth, education, or an improved water supply) (Reference Herrera, Ellis and Fisher131). Similar results emerged from studies in Fiji, which showed that forest clearing and road construction through forested areas were associated with increased risk of typhoid fever in nearby communities. A key factor seemed to be the risk of soil erosion on altered land surfaces; erosion and associated run-off delivered contaminated water to streams and rivers, and undermined latrines and septic systems (Reference Jenkins, Jupiter and Mueller132).
Land use change in forested regions is associated not only with water-borne disease, but also with vector-borne disease. This relationship has been extensively studied in the Amazon, where road-building and deforestation are associated with increased risk of malaria. Probable mechanisms include some combination of altered microclimates, increases in mosquito breeding sites, selective favouring of competent mosquito species, and increased human exposure through in-migration and poor housing (Reference MacDonald and Mordecai133–Reference Vittor, Pan and Gilman136).
Similar findings have emerged from the other side of the world. In Malaysian Borneo, clearing of forests for palm oil plantations leads to forest fragmentation, concentration of surviving macaque monkeys in the remaining habitat, and probably increased transmission of zoonotic malaria, Plasmodium knowlesi, within the monkey populations (Reference Fornace, Abidin and Alexander137). With plantations abutting the remaining forests, mosquitoes are able to transmit the malaria from the macaques to plantation workers.
The relationship between deforestation and malaria risk is complex, featuring feedback loops and second-order effects (Reference Tucker Lima, Vittor, Rifai and Valle138). For example, increased malaria in a particular location may be associated with decreased subsequent deforestation (Reference MacDonald and Mordecai133), while secondary forest growth may be associated with increased malaria transmission (Reference Stefani, Dusfour and Corrêa135). There are also regional differences; for example, in India, transmission decreases with deforestation (see (Reference Whitmee, Haines and Beyrer139) for discussion). This complexity emphasizes the need to consider unintended adverse health consequences of strategies to reverse land degradation.
Nor is the link between land use change and vector-borne disease confined to the tropics. Lyme disease has expanded its range considerably in North America and Europe in recent years. One contributor is climate change, which has expanded the range of the tick vector, Ixodes species (Reference Ostfeld and Brunner140). Also important, however, is forest fragmentation, as occurs when cities sprawl into rural areas. This creates more edge habitats favoured by deer that carry the ticks, and more contact between people and ticks, increasing the risk of disease (Reference MacDonald, Larsen and Plantinga141). Of note, this association has not been demonstrated in all locations tested, and may depend on local circumstances (Reference Simon, Marrotte and Desrosiers142).
The problem of zoonotic disease spillover to humans, and the contributions of ecosystem disruption, were brought into sharp relief over recent decades by emerging viral diseases, including HIV, Ebola, SARS, MERS, and COVID-19. While the circumstances of each of these diseases vary, contributing factors include habitat destruction, human incursion into wildlife habitat, the trade in bushmeat including in wet markets, and globalization including mass air travel which facilitates rapid disease spread. Some features of habitat destruction and biodiversity loss are especially conducive to zoonotic disease emergence (Reference White and Razgour143). One recent study showed that the abundance of zoonotic viruses in wild mammalian species is associated with the global abundance of the species (Reference Johnson, Hitchens and Pandit144). With changes in land use, some species are ‘losers’ – specialists with highly specific requirements – while others, the more adaptable generalists, are ‘winners’. These winners are often smaller animals with fast, short lives, and they are more likely to harbour pathogens than are the losers (Reference Gibb, Redding and Chin145, Reference Ostfeld and Keesing146). Continued land use changes, biodiversity loss, and increased human–animal contact – what has been termed ‘human–animal promiscuity’ – are likely to pose continuing risk of zoonotic diseases.
Another pathway from land use change to disease runs not through infection, but through air quality. It stems from the growing demand for biofuels in Europe, and food, cooking oil, and wood in India, Indonesia, and China. In parts of South Asia, notably Indonesia, native tropical forests are being replaced by palm oil and timber production. To clear the native forests and peatlands, fire is commonly used; the resulting smoke blows in defined ways, affecting populations in Indonesia and the Malay peninsula (Reference Spracklen, Reddington and Gaveau147). This smoke, containing fine particulate matter, is an established risk factor for cardiovascular mortality (Reference Marlier, DeFries and Kim148). Studies combining data on land types, land use, fire occurrence, wind patterns, smoke composition, and health outcomes across the region reveal that Indonesian fires cause an average of approximately 11,000 excess regional deaths in an average year, but in a pattern that varies considerably with such factors as El Niño (Reference Marlier, DeFries and Voulgarakis149). In an especially bad year, 2015, the toll was a full order of magnitude higher, estimated at just over 100,000 excess deaths (Reference Koplitz, Mickley and Marlier150). In this case, the forest alterations not only affect local ecosystems and communities, but the use of fire to clear forests threatens regional cardiovascular health.
Still another example of the impact of land use on health pertains to nutrition. In a study of children in Malawi, children living in communities with higher percentages of forest cover were more likely to consume vitamin A-rich foods and less likely to experience diarrhoea (Reference Johnson, Jacob and Brown151) compared to those living near less forest cover. Using data from the 2010 Demographic and Health Survey (DHS) linked to satellite remote sensing data on forest cover, researchers showed that a net gain in forest cover over the ten-year period prior to the survey was associated with a statistically significant 34% decrease in the odds of children experiencing diarrhoea, and an increase in consumption of vitamin A-rich foods compared to children living in areas with less forest cover. Whilst this study design could not fully account for a range of potential explanatory factors, it supports the view that intact forests benefit health in nearby communities.
A final example of land use changes affecting health pertains not to forests, but to arid drylands, at the border of Kazakhstan and Uzbekistan. Following World War II, the Soviet government sought to convert this region to agriculture. The massive irrigation schemes required diverting the rivers that fed the Aral Sea. Within decades, the surface area of one of the world’s largest inland lakes had dropped by more than 90% (Reference Micklin, Aladin and Plotnikov152). The former seabed surface, dry and impregnated with salt, contributed to regional dust storms, a phenomenon that is likely worsening with climate change. Moreover, depleted farmland in the region – permeated with fertilizers and pesticides that had been used in an ultimately unsuccessful attempt to prop up production – also gave rise to dust as it dried out. This dust creates respiratory health risks across large downwind areas (Reference Gupta and Gupta153–Reference Sternberg and Edwards156). In this case, the conversion of dryland to agriculture, with a complex of first- and second-order effects, threatens health on a large scale.
Biodiversity and Ecosystem Services
Biodiversity encompasses not only diversity between and within species and ecosystems but also the complex inter-relationships and biological structures that sustain ecosystems. More biodiverse ecosystems are more productive, stable and resilient to environmental threats. For this reason, it is prudent to assume that maximizing species, functional and phylogenetic diversity is likely to enhance an ecosystem’s value over the long term (Reference Seddon, Macias-Fauria, Long, Benz and Willis157, Reference Seddon, Mace and Naeem158). The complex linkages between biodiversity and human health have been extensively described by Eric Chivian and Aaron Bernstein in their encyclopaedic volume Sustaining Life (Reference Chivian and Bernstein159). The profound loss of biodiversity afflicting the planet could negatively affect human health through several direct and indirect pathways, operating at interacting local, regional, and global scales (160, Reference Romanelli, Cooper and Campbell-Lendrum161). An important framework for understanding the benefits of biodiversity is the concept of ecosystem services (Box 3.1).
Ecosystem services are the benefits provided by ecosystems, including provisioning, regulating, cultural, and supporting services (Figure 3.7). These benefits flow from biodiversity, from air, water, from soil – indeed, from almost every domain of the natural world.

Figure 3.7. Summary of the links between ecosystem services, drivers of change, and human well-being.
The contribution of ecosystem services to human well-being and health is non-linear such that when a service is scarce a small decline can have disproportionately large effects. The Millennium Ecosystem Assessment (162) concluded that 15 of 24 ecosystem services assessed were in decline, the majority of which were regulating and supporting services. Examples of declining ecosystem services include pollination, the capacity of the atmosphere to remove pollutants, the control of agricultural pests, supplies of natural medicines, and freshwater and marine fisheries, all of which benefit health directly or indirectly.
Mangrove forests exemplify habitats that provide a variety of ecosystem services, from storm protection (a ‘regulating’ function) to nutrition (a ‘provisioning’ function). A study of several hundred villages in Orissa, India, impacted by a super cyclone in 1999, found that villages with wider expanses of mangroves separating them from the coast experienced significantly fewer deaths than ones with narrower or no mangroves (Reference Das and Vincent163). Riverine mangrove forests are especially important for supporting plant and animal productivity, and basin mangroves – the interior stretches that lie behind tidal and riverine systems – enhance nutrient concentrations, providing sources of essential products such as wood (Reference Ewel, Twilley and Ong164). These ecosystem services depend on the maintenance of biodiversity in the mangrove forests.
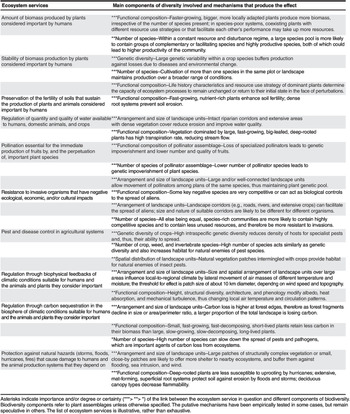
Biodiversity is key to the delivery of a wide range of ecosystem services (Table 3.2). Two of the most important pathways are provisioning services – food and pharmaceuticals – and a third is a regulating function – protection from infectious diseases.
Table 3.2. Biodiversity components affect ecosystem services in multiple and complex ways. The level of certainty, and the importance of the effect, vary across the components listed.
| Ecosystem services | Main components of diversity involved and mechanisms that produce the effect |
|---|---|
| Amount of biomass produced by plants considered important by humans | *** Functional composition–Faster-growing, bigger, more locally adapted plants produce more biomass, irrespective of the number of species present; in species-poor systems, coexisting plants with different resources use strategies or that facilitate each other’s performance may take up more resources. |
| ** Number of species–Within a constant resources and disturbance regime, a large species pool is more likely to contain groups of complementary or facilitating species and highly productive species, both of which could lead to higher productivity of the community. | |
| Stability of biomass production by plants considered important by humans | *** Genetic diversity–Large genetic variability within a crop species buffers production against losses due to diseases and environmental change. |
| *** Number of species–Cultivation of more than one species in the same plot or landscape maintains production over a broader range of conditions. | |
| *** Functional composition–Life history characteristics and resource use strategy of dominant plants determine the capacity of ecosystem processes to remain unchanged or return to their initial state in the face of perturbations. | |
| Preservation of the fertility of soils that sustain the production of plants and animals considered important by humans | *** Functional composition–Fast-growing, nutrient-rich plants enhance soil fertility; dense root systems prevent soil erosion. |
| Regulation of quantity and quality of water available to humans, domestic animals, and crops | *** Arrangement and size of landscape units–Intact riparian corridors and extensive areas with dense vegetation cover reduce erosion and improve water quality. |
| *** Functional composition–Vegetation dominated by large, fast-growing, big-leafed, deep-rooted plants has high transpiration rate, reducing stream flow. | |
| Pollination essential for the immediate production of fruits by, and the perpetuation of, important plant species | *** Functional composition of pollinator assemblage–Loss of specialized pollinators leads to genetic impoverishment and lower number and quality of fruits. |
| ** Number of species of pollinator assemblage–Lower number of pollinator species leads to genetic impoverishment of plant species. | |
| ** Arrangement and size of landscape units–Large and/or well-connected landscape units allow movement of pollinators among plants of the same species, thus maintaining plant genetic pool. | |
| Resistance to invasive organisms that have negative ecological, economic, and/or cultural impacts | *** Functional composition–Some key native species are very competitive or can act as biological controls to the spread of aliens. |
| *** Arrangement of landscape units–Landscape corridors (e.g., roads, rivers, and extensive crops) can facilitate the spread of aliens; size and nature of suitable corridors are likely to be different for different organisms. | |
| ** Number of species–All else being equal, species-rich communities are more likely to contain highly competitive species and to contain less unused resources, and therefore be more resistant to invasions. | |
| Pest and disease control in agricultural systems | *** Genetic diversity of crops–High intraspecific genetic diversity reduces density of hosts for specialist pests and, thus, their ability to spread. |
| ** Number of crop, weed, and invertebrate species–High number of species acts similarly as genetic diversity and also increases habitat for natural enemies of pest species. | |
| ** Spatial distribution of landscape units–Natural vegetation patches intermingled with crops provide habitat for natural enemies of insect pests. | |
| Regulation through biophysical feedbacks of climatic conditions suitable for humans and the animals and plants they consider important | *** Arrangement and size of landscape units–Size and spatial arrangement of landscape units over large areas influence local-to-regional climate by lateral movement of air masses of different temperature and moisture; the threshold for effect is patch size of about 10 km diameter, depending on wind speed and topography. |
| ** Functional composition–Height, structural diversity, architecture, and phenology modify albedo, heat absorption, and mechanical turbulence, thus changing local air temperature and circulation patterns. | |
| Regulation through carbon sequestration in the biosphere of climatic conditions suitable for humans and the animals and plants they consider important | *** Arrangement and size of landscape units–Carbon loss is higher at forest edges, therefore as forest fragments decline in size or area/perimeter ratio a larger proportion of the total landscape is losing carbon. |
| ** Functional composition–Small, fast-growing, fast-decomposing, short-lived plants retain less carbon in their biomass than large, slow-growing, slow-decomposing, long-lived plants. | |
| * Number of species–High number of species can slow down the spread of pests and pathogens, which are important agents of carbon loss from ecosystems. | |
| Protection against natural hazards (storms, floods, hurricanes. fires) that cause damage to humans and the animal production systems that they depend on | *** Arrangement and size of landscape units–Large patches of structurally complex vegetation or small, close-by patches are likely to offer more shelter to nearby ecosystems, and buffer them against flooding, sea intrusion, and wind. |
| *** Functional composition–Deep-rooted plants are less susceptible to uprooting by hurricanes; extensive, mat-forming, superficial root systems protect soil against erosion by floods and storms; deciduous canopy types decrease flammability. |
Asterisks indicate importance and/or degree or certainty (*** > ** > *) of the link between the ecosystem service in question and different components of biodiversity. Biodiversity components refer to plant assemblages unless otherwise specified. The putative mechanisms have been empirically tested in some cases, but remain speculative in others. The list of ecosystem services is illustrative, rather than exhaustive.
Biodiversity and food: Pollinators represent an especially important form of biodiversity, supporting one-third of the global food supply. Key pollinators include certain species of bees and wasps, butterflies and moths, and flies, beetles, and mosquitoes. The numbers and diversity of many of these species have been declining in recent years, the result of land use change, pesticide use, climate change, and other factors, and part of a larger pattern of loss of ‘entomofauna’ (Reference Sánchez-Bayo and Wyckhuys165). This presents threats to food security (Reference Smith, Singh, Mozaffarian and Myers166). Using a database of supplies of 224 types of food in 156 countries, researchers estimated that loss of all pollinator services could reduce global supplies of fruit by about 23%, vegetables by about 16%, and nuts and seeds by 22%, with significant differences between countries. This could aggravate vitamin A deficiency in the 2.2 billion people whose intake is currently below required levels, as well as consign an additional 71 million people to vitamin A deficiency. There would also be major declines in the availability of folic acid (a nutritionally important B vitamin). Whilst such extreme scenarios are implausible, and in some settings wild pollinators could be replaced by commercially available pollinators, this and other studies illustrate the potential links between pollinators and human health (Reference Potts, Imperatriz-Fonseca and Ngo167).
Biodiversity supports dietary diversity, and food security, in many LMICs, where bushmeat and foraging are important components of the food system (Reference Friant, Ayambem and Alobi168). Downsides include the threat to hunted species (Reference Ripple, Abernethy and Betts169) and the risk of zoonotic disease transmission to those who hunt, handle, and consume bushmeat (Reference Wolfe, Daszak, Kilpatrick and Burke170). Indigenous communities often make extensive use of wild foods; in both industrialized and developing countries, they use an average of 120 wild species per community (Reference Bharucha and Pretty171). In many cases, wild species are actively managed, suggesting that the distinction between hunter-gatherer and agriculturalist may be an oversimplification because many communities show features of both (see also Chapter 10). The FAO estimates that about 1 billion people use wild foods in their diet and 300 million use non-timber forest products (Reference Burlingame172). In these circumstances, decreases in biodiversity and degradation of local ecosystems can directly threaten nutrition and well-being. For example, a study in northeastern Madagascar, a biodiversity hotspot, showed that children who consumed more local wildlife had significantly higher haemoglobin concentrations, and that loss of access to wild foods could increase the prevalence of anaemia by 29% overall and as much as three-fold in the poorest households (Reference Golden, Fernald, Brashares, Rasolofoniaina and Kremen173). Either unsustainable exploitation of wildlife or overzealous application of conservation measures could have deleterious consequences for health.
Wild foods have played a traditionally important role in many Arctic and sub-Arctic communities. This dietary pattern is changing in complex ways. Climate change threatens the availability of some mammalian and fish species. Moreover, many of the fish and marine mammals consumed by these communities concentrate POPs and other toxins through biomagnification (Reference Kelly, Ikonomou, Blair, Morin and Gobas174) – a process that climate change may be accelerating (Reference Wang, Sun and Yao175). When store-bought processed foods replace wild foods, this brings with it risks of obesity and diabetes due the excessive consumption of refined carbohydrates, fat, and energy (Reference Rosol, Powell-Hellyer and Chan176).
Biodiversity pressures interact across different ecosystems, with implications for human health and well-being. For example, depletion of wild-catch fisheries can increase the demand for land-based wild foods (Reference Brashares, Arcese and Sam177). A study using three decades of data from Ghana documented how bushmeat demand in villages rose during years of poor fish supply (Reference Brashares, Arcese and Sam177), resulting in declines in 41 species of wild carnivores, primates, and herbivores in six of the nation’s nature reserves. Fish declines were driven by a number of factors including the increasing presence of EU fishing boats off the coast of West Africa, with EU fish harvests there increasing by a factor of 20 from 1950 to 2001 (Reference Kaczynski and Fluharty178).
The global food system relies largely on a tiny number of key species with rice, maize, and wheat providing 60% of the human diet (Reference Collins, Hawtin, Collins and Qualset179). Twelve crops together with five animal species provide about 75% of the energy intake (180). This contrasts with the 30,000 edible plants of which about 7000 have been cultivated or collected for food throughout history (Reference Garn and Leonard181, 182). This increasing homogenization has allowed the provision of energy-dense foods to an increasing population but also brings risks as it renders food supplies more vulnerable to pests and diseases affecting a single species (see Chapter 10). Lack of dietary diversity has adverse effects on nutrition; there is wide acceptance that increasing dietary diversity improves micronutrient intake (Reference Steyn, Nel, Nantel, Kennedy and Labadarios183–Reference Ndung’u and Nyanchoka185). An additional concern is the unplanned spread of novel genes from genetically modified organisms into wild crops or traditional varieties, which could have unanticipated effects on their resilience and thus long-term survival.
Biodiversity and medications: By destroying biodiversity at an unprecedented rate we are also losing the potential of plant-derived pharmaceutical agents. These formed the mainstay of medical treatment for much of recorded history. The first written records come from Mesopotamia in 2600 BC. Early remedies included liquorice (Glycyrrhiza glabra) and the opium poppy (Papaver somniferum). The first written record of Egyptian medicines describes 700 drugs, many derived from plants. Documentation of Indian Ayurvedic plant-based medicines dates from about 1000 BC and Chinese medicines comprised 850 different prescriptions by AD 659. The ancient Greek and Roman texts were preserved and built on by physicians such as Avicenna and subsequently Ibn al-Baytar from Andalusia, who in the thirteenth century described the medicinal uses of 1400 plants in widely influential books. In 1597, John Gerrard, the curator of the Physic Garden of the Royal College of Physicians of London, published a book that included 2200 woodcut images of medicinal plants; it was a standard reference for at least two centuries (Reference Chivian and Bernstein159).
Many examples of plant-based medicines are relevant to contemporary medicine. Artemisinin, a potent antimalarial, was isolated by Chinese scientists from the sweet wormwood plant (Artemisia annua), which had been used for over 2000 years to treat fevers. Vinca alkaloids extracted from the Madagascan periwinkle (Catharanthus roseus) have been used to treat childhood leukaemia (vincristine) and Hodgkins disease (vinblastine) with many related compounds of potential value having been synthesized. Aspirin (acetylsalicylic acid), widely used for pain relief, as an anti-inflammatory agent, and for its ability to reduce platelet stickiness and thus reduce risk of heart attacks and strokes, originally came in the form of salicylic acid from the white willow (Salix alba vulgaris). An acetyl group was added by chemists to make it less irritating to the stomach. Sweet clover (Melilotus species) produces a powerful anticoagulant, dicoumarol, when the coumarin in the clover is metabolized by various moulds. It was originally discovered when a farmer, whose cattle had died of unstoppable haemorrhages after consuming spoiled sweet clover, drove through a snowstorm with a dead heifer, a milk can filled with unclotted blood, and a large sample of spoiled sweet clover to an agricultural research laboratory. By chance the agricultural experimental station he was aiming for was closed and he ended up at the laboratory of Karl Paul Link at the University of Wisconsin, who had been researching ‘sweet clover disease’. Six years later one of Link’s colleagues synthesized the active compound, dicoumarol. The resulting anticoagulant was called warfarin after the Wisconsin Alumni Research Foundation, which funded Link’s research (Reference Duxbury and Poller186). Such discoveries continue (Reference Newman and Cragg187), now reinforced by genomic technologies (Reference Harvey, Edrada-Ebel and Quinn188).
Herbal remedies are widely used in high- and low-income countries, with nearly 5000 medicinal plant species thought to be in use in China, 3000 in India, and thousands more in other countries, totalling over 50,000. Some of these are cultivated and many are wild. Demand is increasing because of the prohibitive cost of conventional pharmaceuticals to many low-income populations. However, an estimated 15,000 medicinal plant species worldwide are endangered because of overharvesting, land use changes, and other factors (Reference Schippmann, Leaman, Cunningham, Bogers, Craker and Lange189).
Animals are the source of many other medically important compounds such as anticoagulants or antihypertensives. Chivian and Bernstein identify several groups of animals that are valuable to human medicine and that are threatened: amphibians, bears, non-human primates, cone snails, sharks, and horseshoe crabs. They document compellingly how invasive species, pollution, hunting, harvesting, habitat loss, climate change, and emerging disease threaten these organisms in different ways with potentially irreversible consequences. Amphibians are probably the most threatened group, in part due to climate change, which may alter the timing of migration and reproduction and thus disrupt their relationship with other species on which they depend for food, or disadvantage them in comparison to predators or competitors. Amphibians produce an array of chemicals isolated from more than 500 species and including alkaloid toxins, antimicrobial peptides (potentially significant in view of growing antimicrobial resistance), bradykinins and other bioactive peptides, and novel compounds or mixtures such as biological glue that can bind animal tissue. By destroying this biological treasury we lose the potential to study and make use of a range of active substances produced by living organisms.
Biodiversity and infectious disease risk: Biodiversity loss is associated with increased likelihood of disease transmission. For example, the transmission of West Nile virus by mosquitoes is influenced by the diversity of passerine birds which act as hosts (Reference Keesing, Belden and Daszak190). Thus, in the USA, the incidence of West Nile encephalitis is higher where the number of bird species is lower because these areas tend to be dominated by species that amplify the virus, whereas in more diverse locations there are more species that are less competent hosts.
Links between biodiversity loss and disease risk may be direct or indirect (Reference Pongsiri, Roman and Ezenwa191). One example is schistosomiasis, which affects about 200 million people worldwide, causing serious effects on liver and urinary tract depending on the causative species. This disease is caused by five main species of blood fluke, a parasite whose host is freshwater snails. In Lake Malawi, for example, overfishing and the use of fine mesh seine nets appears to have caused a decline in a fish called the snailcrusher hap (Trematocranus placodon), the snails’ natural predator, with a consequent increase in schistosomiasis (Reference Pongsiri, Roman and Ezenwa191, Reference Evers, Madsen, McKaye and Stauffer192).
In the case of Lyme disease, transmitted by infected ticks, the level of host diversity strongly influences the risks to humans (Reference Pongsiri, Roman and Ezenwa191). In areas with low biodiversity, where there are large numbers of white-footed mice that can host infected ticks, transmission to humans is likely, but in areas where other hosts less likely to support transmission predominate, the risks are lower (Reference Ostfeld and LoGiudice193). Virginia opossums (Didelphis virginiana) are poor hosts for the pathogen and tend to kill the ticks that feed on them so they act as a host with a strong buffering effect. The opossum tends to disappear from forest fragments where biodiversity is lost and the white-footed mouse, which amplifies transmission, tends to remain (Reference Keesing, Belden and Daszak190). A similar protective effect of biodiversity appears to operate for hantavirus pulmonary syndrome, a condition with a high mortality rate transmitted by aerosolized urine or faeces of infected rodents. In Panama, for example, where the rice rat is a host, more diverse rodent populations reduce the risk of transmission to humans (Reference Ruedas, Salazar-Bravo and Tinnin194). Resilience of a specific species to environmental change may be linked to its competence as a host for infections, possibly reflecting species differences in immune function. For example, plants that are classified as ‘weeds’ can grow rapidly as species diversity declines but may also be more susceptible to pathogens and pests; a similar pattern may also occur in vertebrates (Reference Keesing, Belden and Daszak190).
Thus, for pathogens whose transmission is already established, biodiversity loss is often associated with increased transmission. A different situation may occur in the case of emerging diseases caused by new pathogens, which may jump from wildlife to humans as a result of humans venturing into close proximity with biodiverse environments (Reference Bird and Mazet195, Reference Yamada, Kahn and Kaplan196). The transmission of zoonotic diseases is influenced by a range of environmental changes. Zoonotic diseases may also pass from domestic animals to humans. For example, in Malaysia, Nipah virus, which causes a severe febrile encephalitis in humans with case fatality rates of 40–75%, was transmitted from wild fruit bats to domestic pigs and then to humans (Reference Epstein, Field, Luby, Pulliam and Daszak197). The transmission of zoonotic infections from animals to humans probably accelerated as humans transitioned from hunter-gatherers to agrarian communities when changing patterns of land use and domestication of animals brought humans and animals into closer proximity. Many emerging disease risks are related to land use change or agricultural industry change such as intensive production of livestock, and exacerbated by international air travel which facilitates rapid spread of diseases (Reference Steckling, Tobollik and Plass117). Land use change is a major driver of biodiversity loss.
The relationships between disease transmission and biodiversity are likely mechanism- and context-dependent. A global assessment that accounted for increased reporting in more densely populated locations showed that zoonotic emerging infectious disease risk is elevated in forested tropical regions experiencing land use changes and where there is high wildlife biodiversity (as indicated by mammal species richness). Although the overall trend is for heightened risk of disease emergence with higher mammalian richness, this neither excludes nor confirms the possibility of a dilution effect for specific diseases and is consistent with the conclusion that the relationship between biodiversity and disease risk is complex and context-specific (Reference Allen, Murray and Zambrana-Torrelio198).
An example is the Sin Nombre hantavirus, which is fatal to about 35% of infected humans. The reservoir host is the North American deermouse (Peromyscus maniculatus). A high diversity of small mammals lowers the prevalence of the virus in deermouse populations, because the lower density of the host results in less spread among host individuals (dilution effect). However, at any given level of deermouse density, more diversity is associated with greater transmission (amplification effect). Thus, both effects operate, with dilution generally predominating (Reference Luis, Kuenzi and Mills199). A meta-analysis of the relevant literature also suggests that disease risk is probably a local phenomenon depending on the specific reservoir of hosts and vectors, and their ecological characteristics, rather than solely related to patterns of species biodiversity (Reference Salkeld, Padgett and Jones200).
Future research will need to focus on understanding how biodiversity affects individual mechanisms separately, and their net effects when considered in aggregate, in order to make generalizable predictions.
Freshwater Resources
Human-induced changes in water resources affect health in various ways. As noted in Chapter 1, these changes include less rainfall in areas that are already dry (a result of climate change), depletion of groundwater, and/or damming of rivers.
Water scarcity may be episodic – known as drought – or long-standing, as in arid parts of the world. The most water-stressed parts of the world are the Middle East and North Africa, although droughts have become more severe in places from Australia to North America in recent decades (see Figure 1.3). Freshwater scarcity is predicted to increase in coming decades due to climate change (Reference Hao, Singh and Xia201–Reference Liu, Sun and Lim204), saline contamination of coastal groundwater (Reference Werner, Bakker and Post205), and depletion of groundwater aquifers (Reference Konikow and Kendy206, Reference Famiglietti207) (supply shortfalls) and growing populations (demand increases). Water scarcity has a range of health effects (Reference Stanke, Kerac, Prudhomme, Medlock and Murray208, Reference Hunter, MacDonald and Carter209).
Water scarcity threatens food production, and thus nutrition and health. In rural areas during periods of drought, as food production drops off, undernutrition and child stunting increase, with lifelong implications for affected children (Reference Cooper, Brown and Hochrainer-Stigler210, Reference Bahru, Bosch, Birner and Zeller211). The nutritional impacts of water scarcity play out on a global scale, as a substantial proportion of the global trade in staple crops involves exports from countries that deplete groundwater to produce these crops. This unsustainable situation highlights the risk of coming food shortfalls in importing countries (Reference Dalin, Wada, Kastner and Puma212). Other pathways from water scarcity to health include impacts on mental health, including an increased risk of suicide in agricultural communities (Reference Vins, Bell, Saha and Hess213), increased risk of some vector-borne diseases as people store water in containers that serve as mosquito breeding sites (Reference Pontes, Freeman, Oliveira-Lima, Hodgson and Spielman214), violent conflict, particularly among agriculturally dependent groups and politically excluded groups in very poor countries (Reference von Uexkull, Croicu, Fjelde and Buhaug215), and impacts that follow dislocation and migration.
On the other hand, health benefits could flow from efforts to address water scarcity. One modelling study showed that, in India, shifting diets to meet local constraints on water availability, including a reduction of wheat, dairy, and poultry, and an increase in legumes, could reduce the risk of non-communicable diseases (Reference Milner, Joy and Green216).
Rivers change when they are dammed. Impacts may include changes in water flow, temperature, and sedimentation, with resulting habitat changes, reduced water quality, loss of wetlands, disruption of fish migration, and even species extinction (Reference Schmutz, Moog, Schmutz and Sendzimir217). While damming offers the health benefits that derive from clean electricity, irrigation, and flood control, it may threaten health in at least three ways. First, dam construction may displace people living in riverside towns and villages that are flooded (Reference McDonald-Wilmsen and Webber218). Construction of China’s Three Gorges Dam, for example, completely or partially flooded 13 cities and towns, 365 townships, and 1711 villages, inundated about 26,000 hectares of farmland, and displaced at least 1.3 million residents (Reference Hwang, Cao and Xi219). Impoverishment, shattered social support networks, homelessness, and unemployment, and consequent health impacts including depression and poor self-rated health, followed (Reference Xi and Hwang220). Second, dams can alter river ecology in ways that increase the risk of infectious disease in nearby populations; this has been best documented for schistosomiasis (Reference Steinmann, Keiser, Bos, Tanner and Utzinger221) and malaria (Reference Kibret, Lautze, McCartney, Nhamo and Yan222). Third, dam collapses can lead to catastrophic damage to people and property downstream. Like any ecosystem alteration intended to yield particular benefits, careful adaptive management is needed to identify trade-offs and manage unwanted consequences (223).
Multiple Drivers of Disease Risk
Much research focuses on a single environmental factor acting alone, but increasingly we need to assess the effect of multiple environmental and social factors acting in concert as we live in a dynamic world where changes may be additive or synergistic. A study of infectious disease threat events (IDTEs) in Europe, where disease surveillance systems are more robust than in many regions, showed that of 116 IDTEs detected between 2008 and 2013 by the European Centre for Disease Prevention and Control, most resulted from a combination of two or more drivers, with 25% resulting from three or more drivers (Reference Semenza, Lindgren and Balkanyi224). The top five individual drivers of IDTEs were travel and tourism, food and water quality, natural environment, global trade, and climate. The natural environment drivers included changes in land use and land cover, waterways, oceans, coastlines, water resources, habitats, and biodiversity. Climate and the natural environment were particularly important drivers of vector-borne infections. For example, a large outbreak of over 2000 cases of dengue in Madeira was driven by climate changes, changes in the natural environment, and travel and tourism (Reference Lourenço and Recker225). A large outbreak of hantavirus infection in Germany in 2010 was attributed to increases in bank vole (Clethrionomys glareolus) populations, due to high levels of seed production the previous year (Reference Reil, Rosenfeld and Imholt226). Increased outdoor activities in the warm and dry summer months of 2010 resulted in exposure to dust contaminated by rodent excreta. Better diagnosis and reporting may also have contributed to the large numbers of notified cases.
While the history of COVID-19 has not yet been written, it seems very likely, given the similarity of SARS-CoV-2 to bat SARS-CoV-like coronaviruses, that bats were reservoir hosts for the virus. Malayan pangolins (Manis javanica) are hosts to coronaviruses similar to SARS-CoV-2 and were illegally imported into Guangdong province as a luxury food or for use in traditional Chinese medicine. Many early cases of COVID-19 were linked to the Huanan market in Wuhan where live animals were traded. Although neither bats nor pangolins had, as of early 2021, yielded the direct progenitor of SARS-CoV-2, it is highly plausible that it originated in one or both of them. After making the jump into humans SARS-CoV-2 could have acquired the genomic features required for human transmission through adaptation during initially undetected human-to-human transmission (Reference Andersen, Rambaut, Lipkin, Holmes and Garry227). Rapid spread was facilitated by mass air travel and delayed, and in some cases, inconsistent public health responses, particularly in Europe and North America.
In aquatic systems, degraded water quality from increased nutrient flows – nitrogen and phosphorus – can cause eutrophication that allows algal blooms to develop and persist (Reference Heisler, Glibert and Burkholder228). The high biomass of algal blooms can cause deoxygenation of water, killing large numbers of fish and reducing biodiversity. Climatic factors may also influence the distribution of algae (see also Chapter 2). Suitable habitat for many algae species may extend further northward with climate change to the central and northern regions of the North Sea, the North Pacific Ocean, and lakes in northern locations (Reference Wells, Karlson and Wulff229, Reference Trainer, Moore and Hallegraeff230). An additional factor is ocean acidification, which has been shown to increase the abundance of the toxic microalga Vicitus globosus by stimulating growth and decreasing the loss due to grazing because of its increased toxicity (Reference Riebesell, Aberle-Malzahn and Achterberg231).
The operation of these complex, interacting drivers, and the resulting algal blooms, can threaten human health. A principal pathway is the formation of phycotoxins by certain species of algae. Bivalves (molluscs such as clams, oysters, mussels, and scallops) filter and accumulate the phycotoxins formed by these blooms, and consumption of affected bivalves can trigger such conditions as paralytic, diarrhetic, and amnesic shellfish poisoning. Other pathways operate as well: the loss of income from tourism and fishing, and the loss of recreational opportunities.
The combination of climate change, nutrient loading, and ocean acidification is likely to increase the probability of harmful blooms. The magnitude of this threat, the species specificity, the vulnerable times and locations, and the optimal adaptive responses are not fully understood at this point. But the concern must be that such interactions threaten the ocean food web, increasing mortality of farmed and wild fish with implications for the economic welfare of coastal communities, and the nutrition of those populations depending substantially on fish consumption.
Multiple environmental stressors can also affect land-based food systems but are rarely taken into account in future projections. Climate change, salination, and tropospheric ozone concentrations all reduce vegetable and legume yield, an impact that is unlikely to be offset by the increased growth resulting from carbon dioxide fertilization (Reference Scheelbeek, Bird and Tuomisto232). Decreased labour productivity will also reduce work output of subsistence farmers who are unlikely to access mechanization at a time when their crops and livestock are also increasingly affected by climate change. Food trade depends on exports from a small number of countries to a larger number of import-dependent countries. During periods of environmental shocks such as intense heat or droughts affecting critical regions, some exporting countries suspend exports to protect their own populations (Reference Suweis, Carr, Maritan, Rinaldo and D’Odorico233), at times abruptly, which can trigger rapid increases in food prices and political disturbance. The number of unstable countries unable to feed themselves without recourse to global trade has increased in recent decades. For the most vulnerable countries even a small perturbation may create major instability. New bioenergy policies and increased demand for animal products intensify the risks and overexploitation of finite supplies of freshwater, including in food exporting nations, which further exacerbates the threat level (Reference Suweis, Rinaldo, Maritan and D’Odorico234).
Conclusions
Environmental change in the Anthropocene Epoch threatens to undermine the dramatic progress in health achieved in recent history. Climate change poses many such threats, as described in Chapter 2; so do pollution, land use change, and biodiversity loss as described in this chapter. Moreover, these pathways can interact in unpredictable ways with impacts on a range of health outcomes, both mental and physical. Vulnerability to these adverse effects depends not just on exposure to a given environmental hazard but also on the susceptibility of individuals and communities to a given exposure. Humans have been adapting to changes in their environments throughout history with varying degrees of success. In Chapter 4 we examine what is known about how humans can adapt to emerging challenges and create more resilient societies able to withstand shocks and recreate themselves to reach a new equilibrium with their environment. At the same time there are limits to adaptation, as shown by historical case studies of collapse of whole societies faced by overwhelming rapid changes or slow to react to gradually emerging challenges. Exploring the potential for adaptation and its limits will help to inform us about additional policies needed to reduce the risks to humanity in the Anthropocene Epoch.