

Facts do not cease to exist because they are ignored.
It is time to move on to the central issue of this book: how our experience affects our wellbeing. The starting point is the huge inequality that exists in wellbeing – both within countries and between them. This is the most fundamental inequality there is – the inequality in the overall quality of life as people experience it. So we begin with the key facts about the level and distribution of wellbeing in the world.
The Level and Inequality of Wellbeing in the World
The best evidence we have on the worldwide distribution of wellbeing comes from the Gallup World Poll. This remarkable survey happens every year and covers nearly every country in the world. Around a thousand adults are surveyed in each country each year. They are selected to be as representative as possible of the population in each country, and, when necessary, the results are re-weighted to be as representative as possible. The interviews are conducted face to face in the poorer countries (at least before COVID-19) and by telephone in the richer ones.
The main wellbeing question is what is known as the ‘Cantril ladder’ that we described in Chapter 1.Footnote 1 In the years when Gallup also asked about life satisfaction, the answers to both questions were very closely correlated.Footnote 2 So we can think of the Cantril ladder as a standard evaluative question about wellbeing.
In Chapter 1, we already showed the averages for the different countries. But more important than differences between countries are differences between people. So Figure 6.1 shows the worldwide distribution of individual adult wellbeing before COVID-19, each individual being given equal weight. The spread is very wide – over a sixth of the world’s population answer 3 or below, while over a sixth answer 8 or above. This must be one of the most basic facts about the human condition on earth today.
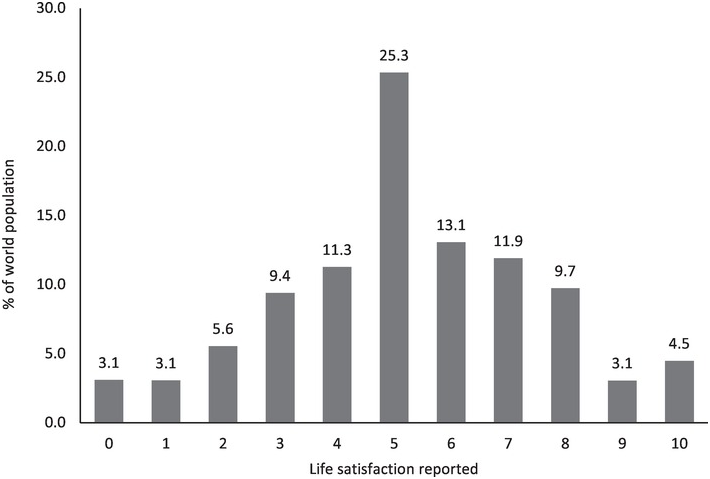
Figure 6.1 Percentage of people in the world at each level of life satisfaction
There is also another way of showing this huge spread of wellbeing – the same facts laid out differently. In Figure 6.2, we break the population down into ten groups of equal size, starting with those who are the least happy on the left of the graph and ending on the right with those who are happiest. As the graph shows, the least happy have an average wellbeing of 1.1 points and the happiest have a wellbeing of 9.2 points. It is a world with many lives that are limited and a few that are truly flourishing. The average wellbeing in the world before COVID-19 was 5.3 points (out of 10) but the spread, as measured by the standard deviation, was 2.3 points.Footnote 3
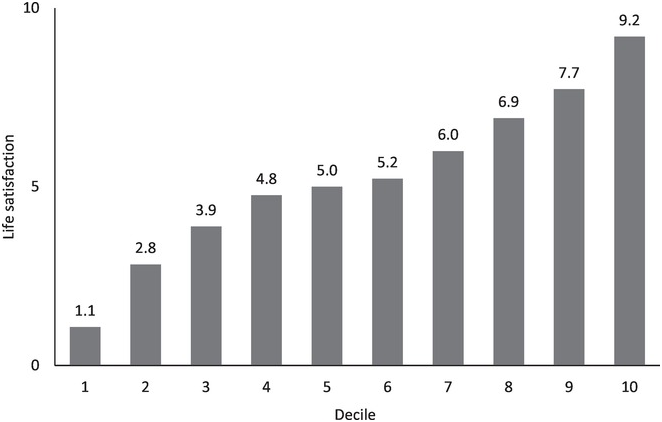
Figure 6.2 Life satisfaction (0–10) of people at each decile of life satisfaction
But how much of this huge spread of wellbeing in the world is due to the spread between countries, and how much of it occurs within countries? The neatest way to answer this question is by taking the square of the standard deviation, known as the variance. We can then partition the variance of individual wellbeing worldwide into two elements:
differences within countries and
differences between countries.
It turns out that the difference between countries contributes only 22% of the overall variance and the main variation (78%) is within countries.Footnote 4 Thus the standard deviation of average wellbeing across countries is about 1.1, while the average of the standard deviation inside a country is about 2.3.
Changes Over Time
It is easy to think that we live in a peculiarly dreadful time. But this is not so, judged by the criterion of wellbeing. There are indeed some countries in which wellbeing declined between 2005–2008 and 2016–2018.Footnote 5 These include the United States, India, Egypt, Brazil, Mexico, Venezuela, South Africa and those affected by civil war. But there are as many countries where wellbeing has risen since 2005–2008 as where it has fallen. Countries where wellbeing rose include both China and most of the countries that were once Communist. Earlier on, between 1980 and 2007, wellbeing rose in more countries than not.Footnote 6 On balance, therefore, the world as a whole is probably as happy as it has ever been.Footnote 7
But progress in wellbeing is by no means automatic, and it is noteworthy that in some important countries, wellbeing is now no higher than it was when records began. In the United States, that means in the 1950s; in West Germany, it means in the 1970s; and in China, it means 1990. We shall discuss this issue more fully in Chapter 13.
By contrast, if we look at short-term changes in wellbeing over the business cycle, wellbeing generally fluctuates up and down around its trend – higher in the boom and lower in the slump. We shall also discuss this issue at length in Chapter 13.
Meanwhile, how has the inequality of wellbeing been changing over time? In most countries, it rose between 2006 and 2018 with especially sharp rises in North America and Sub-Saharan Africa, which now have the highest levels of regional inequality (see Figure 6.3). However, wellbeing inequality fell in Europe, which now has the lowest levels of wellbeing inequality in the world.

Figure 6.3 Trends in the inequality of life satisfaction (0–10) (Standard deviations)
Hedonic Measures of Wellbeing
The analysis so far is based on the Cantril ladder. The Gallup World Poll also asks questions about people’s emotions – the hedonic measures of wellbeing that we discussed in Chapter 1. These questions give useful information about changes over time. At the world level, one can construct an index of positive and negative emotion, based on the question ‘Did you experience X during a lot of the day yesterday?’ For positive emotions, X includes separate questions about happiness, enjoyment, and smiling or laughing. These can be combined into a single index by taking the average proportion of people who said Yes to each question. Similarly for negative emotions – where the questions relate to worry, sadness and anger. Figure 6.4 shows trends at the world level for both positive emotion and negative emotion. As the figure shows, positive affect and the Cantril ladder have been trending down slightly. But negative affect has increased greatly – especially worry. This is confirmed by an additional question on stress where we reproduce the answers for the United States, Western Europe and the world as a whole in Figure 6.5. These findings are deeply troubling. But for the rest of this chapter, we shall revert to measures based on the Cantril ladder.
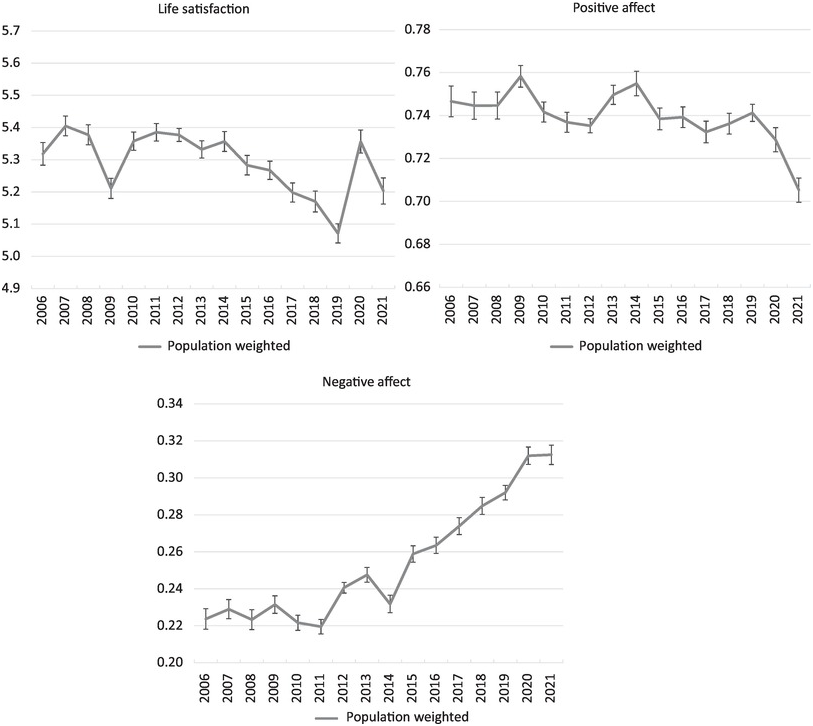
Figure 6.4 Trends in average wellbeing in the world
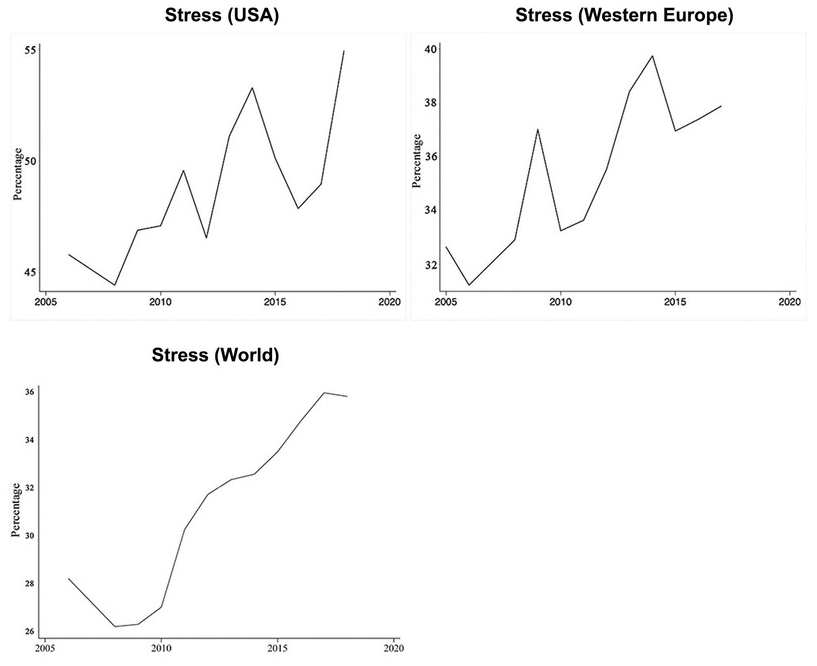
Figure 6.5 Trends in stress (Percentage saying ‘I experienced a lot of stress yesterday’)
Differences Between Groups
So how does average wellbeing differ between groups?
Men and women
Remarkably, the distribution of wellbeing in the world is almost identical for men and women. Women are on average slightly happier than men but the difference is only 0.09 points (out of 10) – one fiftieth of the difference between the happiest and least happy country. Moreover, in almost every country the average wellbeing of men and women is nearly the same, even though wellbeing differs so hugely between countries (see Figure 6.6).Footnote 8
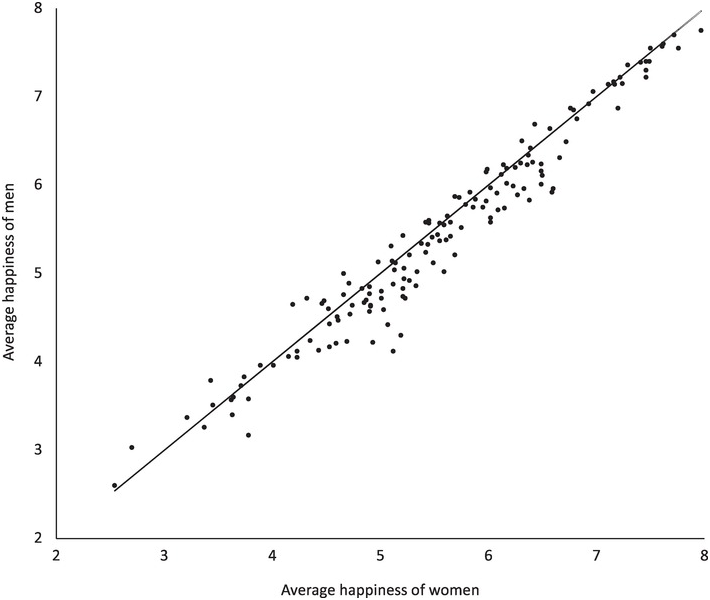
Figure 6.6 Average wellbeing of men and women: By country (the line represents equality)
But what about trends in the relative happiness of men and women? Over the last 50 years, women’s rights in the workplace have been transformed in many countries by legislation requiring equal pay and equal job opportunities. At the same time, women have made huge educational advances relative to men, and through the contraceptive pill have achieved unprecedented control over their fertility. So one might expect that women’s wellbeing would have risen relative to men’s. But has it?Footnote 9
In the United States since the 1970s, both men and women have become less happy, and this has been especially true of white women. In Europe, the situation has been different. Both women and men have become on average more satisfied with their lives, but European women’s happiness has fallen relative to men’s – and this has happened in all 12 countries for which the time series go back as far as the 1970s.
Why is this?Footnote 10 Empirical work has so far failed to produce an explanation. The most likely one (so basic to humans) is social comparisons. As more and more women work, they may increasingly compare themselves with their male colleagues (rather than with other women). And at work women are still frequently at a disadvantage. Another possibility is that women now experience a greater conflict of roles (as compared with men). The US evidence suggests that (up to 2005 at least) there was no change in women’s total work relative to men’s (total time spent in paid work, housework and childcare).Footnote 11 But that is not the same as the sense of responsibility. Women still do more work at home than men, and to that has been added much greater responsibilities at work. Another possibility is family conflict. In the United States, both men and women have become less satisfied with their marriages – and to an equal extent. But satisfaction with marriage affects women’s happiness more than men’s, and increased dissatisfaction with marriage therefore helps to explain the increased gender gap in US happiness.Footnote 12 Finally, there is the enduring fact of male chauvinism. Though this may have diminished over time, the experience of it may have become more intolerable – as the #MeToo movement testifies.
Age
The next issue is Do we become happier as we get older? The effects of aging involve many factors but social factors are among them. As we move into adult life, we take on more responsibility, both in family life and at work. But after some time, we become more established, and any children we had leave home. We relax more. But eventually our health declines. So what is the overall effect of our journey through life?Footnote 13
In most countries, people on average become progressively less happy from their late teens up to their 40s. But then in some countries (including the United States and the UK), they become happier again up to their 70s (before a final decline). Figure 6.7 shows how wellbeing changes over life in each of the world’s regions. Everywhere happiness declines up to around age 40. It then recovers in North America and to a lesser extent in East Asia; in Western Europe, it remains stable; but elsewhere, there are some further declines. (In the former Soviet Union and Warsaw Pact countries the old are markedly less happy, but this is the legacy of the transition and may not continue in future decades).

Figure 6.7 Average life satisfaction: by age, gender and region
Note: NA & ANZ = North America, Australia and New Zealand. CEE & CIS = Central and Eastern Europe and former Soviet Union. LAC = Latin America and Caribbean. MENA = Middle East and North Africa. SSA = Sub-Saharan Africa
So what explains these patterns of wellbeing over the life-course? If age affects wellbeing, it must be through some mediating variables.Footnote 14 But what are they? The first step is to look at the standard variables explaining wellbeing, which we shall consider in Chapter 8. From 20 to 40 years old, most of these variables are moving in the direction that would produce higher wellbeing. So they provide little insight into variation across the life-course.Footnote 15
More light can be found by looking at the Gallup World Poll’s evidence on affect. As we have mentioned, this provides data on negative and positive affect. Beginning with negative emotions (Figure 6.8), stress rises sharply up to middle age and then declines. So does anger, though less markedly. These declines after middle age are especially marked in North America and Western Europe. By contrast, worry, sadness, depression and pain rise steadily through life, but as time passes they become balanced by declining stress and anger. Turning to positive emotions (Figure 6.9), happiness, enjoyment, smiling and interest fall steadily throughout life. In addition, as people age, they are less likely to report that they have someone they can rely on in times of need. People do however feel more rested.

Figure 6.8 Negative Experiences: By age and gender (World)

Figure 6.9 Positive Experiences: By age and gender (World)
Ethnic differences
What about the differences between ethnic groups? In every society, most minority ethnic groups have lower average wellbeing than the majority group. But these differences can be reduced or even eliminated by policy action, such as
reducing gaps in education and income,
banning discrimination in employment and housing,
punishing severely both racially motivated crime and incitement to racial hatred and
improving the respect shown to all (by citizens, by the police, and by the law).
With such action, things can change. For example, the United States has seen substantial improvement in the wellbeing of ethnic minorities, while at the same time the average wellbeing of whites has declined.Footnote 16 This is shown in Figure 6.10, which is based on the General Social Survey. (The happiness scores used are very happy – 3; pretty happy – 2; not too happy – 1.) As Figure 6.10 shows, the gap in happiness between white and black citizens has fallen sharply.Footnote 17

Figure 6.10 Average wellbeing (1–3) of different racial groups in the United States
However, America still has serious ethnic problems, as the Black Lives Matter movement testifies. And so have most other countries, though the groups involved differ widely. In some countries, ethnic tensions lead to civil war.
The Wellbeing of Children
So much for adults; but what about children? In both 2015 and 2018, the OECD surveyed the wellbeing of 15-year-olds in their regular Programme for International Student Assessment (PISA). The question asked was on life satisfaction (0–10) and the survey covered most OECD countries and a number of others. The results by country are in Table 6.1.
Table 6.1 Average life satisfaction of 15-year-olds (0–10)
| OECD Countries | Other countries | |||
|---|---|---|---|---|
| Mexico | 8.11 | Kazakhstan | 8.76 | |
| Colombia | 7.62 | Albania | 8.61 | |
| Finland | 7.61 | Kosovo | 8.30 | |
| Lithuania | 7.61 | North Macedonia | 8.16 | |
| Netherlands | 7.50 | Belarus | 8.10 | |
| Switzerland | 7.38 | Dominican Republic | 8.09 | |
| Spain | 7.35 | Ukraine | 8.03 | |
| Iceland | 7.34 | Costa Rica | 7.96 | |
| Slovak Republic | 7.22 | Saudi Arabia | 7.95 | |
| Estonia | 7.19 | Panama | 7.92 | |
| France | 7.19 | Romania | 7.87 | |
| Latvia | 7.16 | Bosnia and Herzegovina | 7.84 | |
| Austria | 7.14 | Croatia | 7.69 | |
| Portugal | 7.13 | Montenegro | 7.69 | |
| Hungary | 7.12 | Moldova | 7.68 | |
| Luxembourg | 7.04 | Thailand | 7.64 | |
| Chile | 7.03 | Serbia | 7.61 | |
| Germany | 7.02 | Georgia | 7.60 | |
| Sweden | 7.01 | Uruguay | 7.54 | |
| Greece | 6.99 | Indonesia | 7.47 | |
| Czech Republic | 6.91 | Vietnam | 7.47 | |
| Italy | 6.91 | Russia | 7.32 | |
| Slovenia | 6.86 | Peru | 7.31 | |
| United States | 6.75 | Argentina | 7.26 | |
| Ireland | 6.74 | Baku (Azerbaijan) | 7.24 | |
| Poland | 6.74 | Philippines | 7.21 | |
| Korea | 6.52 | Bulgaria | 7.15 | |
| Japan | 6.18 | Brazil | 7.05 | |
| United Kingdom | 6.16 | Malaysia | 7.04 | |
| Turkey | 5.62 | Morocco | 6.95 | |
| Jordan | 6.88 | |||
| United Arab Emirates | 6.88 | |||
| Qatar | 6.84 | |||
| Lebanon | 6.67 | |||
| China | 6.64 | |||
| Malta | 6.56 | |||
| Chinese Taipei | 6.52 | |||
| Hong Kong (China) | 6.27 | |||
| Macao (China) | 6.07 | |||
| Brunei Darussalam | 5.80 |
As can be seen, among the OECD countries the lowest levels of satisfaction were in Turkey, the UK and Japan. The United States was also near the bottom of the list. As so often found, Finland was near the top. Among non-OECD countries, satisfaction was noticeably high in Latin America and post-Communist countries. In most countries, 15-year-old boys were on average happier than 15-year-old girls, with 72% reporting scores of 7 or above compared with only 61% for girls. In most countries, satisfaction was higher among young people from advantaged backgrounds and slightly higher for people from non-immigrant households.
Over time, between 2015 and 2018, young people became less satisfied in every country surveyed (except South Korea). This is a remarkable fact. The average fell by 0.3 points (from 7.3 to 7.0). But the fall was particularly striking in the UK (0.8 points) and in the United States, Japan and Ireland (0.6 points).
Life Expectancy and WELLBYs
Finally, we need to bring into play a completely different dimension – the length of life. As we argued in Chapter 2, the ultimate test of a society’s success is not only the wellbeing that people experience but also the number of years for which they experience it. In other words, what we care about is the number of Wellbeing-Years (or WELLBYs) per person born.Footnote 18
There is, of course, no direct and meaningful way of measuring, at a point in time, the length of people’s lives. But statisticians measure life-expectancy at a point of time as the years a person born now would live if age-specific mortality rates remained as they are now. So a natural measure of the current success of a society is given by

This is not, of course, an appropriate maximand for policy, which should also involve the future wellbeing of those alive and those not yet born. But it is an interesting measure of where we are now.
Table 6.2 provides this assessment for each region of the world for 2017/19 (before COVID-19) and also for 2006/8 (the first available date). As the table shows, average current wellbeing fell slightly between the two periods, especially in South Asia, the Middle East/North Africa and North America. But life-expectancy rose everywhere, above all in Sub-Saharan Africa where it rose by an astonishing seven years. Thus the average WELLBYs per citizen born in the world rose from 369 (5.4 × 68.7) to 373 (5.2 × 72.4). The increase was especially large in the post-Communist regions. But in South Asia, the Middle East/North Africa and in North America there was a fall in current social welfare.
Table 6.2 Trends in wellbeing, life expectancy and social welfare
| Average wellbeing per year | Life expectancy (in years) | Social welfare (WELLBYs per person) | |||||
|---|---|---|---|---|---|---|---|
| 2006/8 | 2017/19 | 2006/8 | 2017/19 | 2006/8 | 2017/19 | Change | |
| World | 5.4 | 5.2 | 68.7 | 72.4 | 369 | 373 | 4 |
| N America | 7.3 | 7.0 | 78.6 | 79.5 | 576 | 556 | −21 |
| S America | 6.2 | 6.1 | 73.4 | 75.3 | 455 | 463 | 8 |
| W Europe | 6.9 | 6.8 | 80.3 | 82.2 | 550 | 561 | 11 |
| C+E Europe | 5.4 | 6.1 | 74.6 | 77.4 | 402 | 488 | 66 |
| Former Soviet Union | 5.2 | 5.4 | 67.5 | 72.2 | 352 | 393 | 41 |
| S E Asia | 5.1 | 5.4 | 69.4 | 72.5 | 354 | 391 | 37 |
| E Asia | 4.9 | 5.2 | 74.8 | 77.8 | 369 | 408 | 39 |
| S Asia | 5.1 | 4.0 | 65.7 | 69.5 | 334 | 278 | −56 |
| M E + N Africa | 5.3 | 4.9 | 71.9 | 74.6 | 380 | 364 | −16 |
| Sub-Saharan Africa | 4.5 | 4.5 | 53.6 | 60.7 | 240 | 271 | 31 |
Conclusions
(1) Wellbeing varies hugely in the human population. Over a sixth of the world’s population has wellbeing of 3 or below (out of 10) – a condition of serious misery. And another sixth has wellbeing of 8 or above.
(2) About 80% of this variance of wellbeing worldwide is within countries and about 20% is between countries.
(3) Between 1980 and 2007, average wellbeing rose in more countries than where it fell. But since 2008, wellbeing has fallen in roughly the same number of countries as where it has risen. Notable falls in wellbeing have been in India, the United States and the Middle East/North Africa. In the US average wellbeing is no higher than it was in the 1950s and the inequality of wellbeing is one of the highest in the OECD.
(4) In most countries, the inequality of wellbeing has increased since 2008, except in Europe, which now has lower inequality than any other region.
(5) Since 2006/8 there has been a large increase in negative affect and in stress.
(6) Average wellbeing is very similar for men and women in almost every country. It declines with age in most parts of the world but in North America and Europe it improves after mid-life. Average wellbeing is below average for most ethnic minorities in most countries.
(7) Children’s wellbeing fell substantially between 2015 and 2018 especially in the UK, the United States and Japan, countries where the wellbeing of 15-year-olds is lower than in most other OECD countries.
(8) Meanwhile, adult life-expectancy has risen in all regions of the world, especially in Sub-Saharan Africa. So the Wellbeing-Years (WELLBYs) that a person now born can expect have increased since 2006–2008 in all regions of the world except South Asia, the Middle East/North Africa and North America.
The rest of Part III of this book attempts to explain some of these facts – both the level of wellbeing and its inequality in the human population. But first we have to sort out the tools we need for this purpose.
Questions for discussion
(1) Do you believe the patterns of wellbeing portrayed in this chapter?
(2) You may want to develop hypotheses about what causes these facts.


 Open access