


Introduction
The assemblage of arthropods present within galls is frequently described as static communities whose composition is essentially invariable at the level of the specific gall system (Askew Reference Askew1980; Stone et al. Reference Stone, Schönrogge, Atkinson, Bellido and Pujade-Villar2002; Shorthouse Reference Shorthouse and Shorthouse2010). Recent work has improved our understanding of the complexities and variable patterns that emerge in these communities at local scales (Joseph et al. Reference Joseph, Gentles and Pearse2011; Bannerman et al. Reference Bannerman, Shorthouse, Pither and Lalonde2012; MacEwen et al. Reference MacEwen, Earley and Lalonde2020). For example, molecular approaches have demonstrated the presence of morphologically cryptic taxa co-existing within the guilds of gall-inducers, parasitoids, and inquilines present in gall component communities (Zhang et al. Reference Zhang, Gates and Shorthouse2014; Start Reference Start2019; MacEwen et al. Reference MacEwen, Earley and Lalonde2020; Ward et al. Reference Ward, Sheikh and Forbes2020). Morphologically cryptic species are a likely source of undiscovered biodiversity present within a system (Jörger and Schrödl Reference Jörger and Schrödl2013; Struck et al. Reference Struck, Feder, Bendiksby, Birkeland, Cerca and Gusarov2018). Gaps in the understanding of community composition can lead to inappropriate assumptions about a system’s diversity and overly broad generalisations about community dynamics (Schlick-Steiner et al. Reference Schlick-Steiner, Steiner, Moder, Seifert, Sanetra and Dyreson2006; Bickford et al. Reference Bickford, Lohman, Sodhi, Ng, Meier and Winker2007).
The presence of cryptic species is often assumed to be the result of recent speciation due to niche shifts, but cryptic species can also occur through other mechanisms (Struck et al. Reference Struck, Feder, Bendiksby, Birkeland, Cerca and Gusarov2018). Zhang et al. (Reference Zhang, Gates and Shorthouse2014) present molecular evidence for two species of rose gall parasitoids in the genus Eurytoma Illiger (Hymenoptera: Eurytomidae) that are not sister taxa but are morphologically cryptic and were previously thought to be the same species. The use of molecular methods to detect cryptic species (e.g., Zhang et al. Reference Zhang, Gates and Shorthouse2014), together with morphology-based taxonomy for identifying novel morphological features to separate and identify cryptic species (e.g., Zhang et al. Reference Zhang, Gates and Shorthouse2017), is essential for characterising the diversity present within a system (Schlick-Steiner et al. Reference Schlick-Steiner, Steiner, Moder, Seifert, Sanetra and Dyreson2006). The bacterial endosymbiont Wolbachia can be an isolating mechanism that facilitates speciation in a number of insect species, including parasitic Hymenoptera (Stouthamer et al. Reference Stouthamer, Breeuwert, Luck and Werren1993; Stouthamer and Kazmer Reference Stouthamer and Kazmer1994; Plantard et al. Reference Plantard, Rasplus, Mondor, Clainche and Solignac1999). The existence of morphologically cryptic species (Lotfalizadeh et al. Reference Lotfalizadeh, Delvare and Rasplus2007; Nicholls et al. Reference Nicholls, Fuentes-Utrilla, Hayward, Melika, Csóka and Nieves-Aldrey2010a; Zhang et al. Reference Zhang, Gates and Shorthouse2014, Reference Zhang, Gates and Shorthouse2017) and the frequent involvement of thelytoky-inducing endosymbiont Wolbachia (Stouthamer et al. Reference Stouthamer, Breeuwert, Luck and Werren1993; Stouthamer and Kazmer Reference Stouthamer and Kazmer1994; Plantard et al. Reference Plantard, Rasplus, Mondor, Clainche and Solignac1999) within relatively closed gall systems make cynipid (Hymenoptera: Cynipidae) component communities a rich subject for molecular ecology studies.
Rosa woodsii Lindley (Rosaceae) is a typical component of the flora native to the grassland valley bottom in the Okanagan Valley, southern British Columbia, Canada, where it serves as host to multiple rose gall wasps in the genus Diplolepis (Hymenoptera: Cynipidae) (Douglas et al. Reference Douglas, Meidinger and Pojar1999; Shorthouse Reference Shorthouse and Shorthouse2010). Diplolepis variabilis Bassett is a common Okanagan galler that induces corky growths on the leaves of R. woodsii (Shorthouse Reference Shorthouse and Shorthouse2010). Bannerman et al. (Reference Bannerman, Shorthouse, Pither and Lalonde2012) reared out the inhabitants in galls induced by D. variabilis and found that the species in the rosae group of the genus Eurytoma were the most common parasitoids that emerged, accounting for approximately 21% of the component community. Additionally, wasps in the genus Eurytoma reared from Okanagan D. variabilis specimens showed a highly female-biased sex ratio (78.04% female), and male emergence was skewed towards the earliest portion of the emergence period (Bannerman et al., unpublished data; see below). We predict that the early skew in male emergence observed by Bannerman et al. (Reference Bannerman, Shorthouse, Pither and Lalonde2012) and the strong female bias in the Okanagan Eurytoma population are driven by a Wolbachia infection in an all-female Eurytoma species that makes its appearance during the latter half of the emergence period.
The taxonomy of Eurytomidae is as yet unresolved. Although Eurytomidae itself appears to be monophyletic (Lotfalizadeh et al. Reference Lotfalizadeh, Delvare and Rasplus2007; Heraty et al. Reference Heraty, Burks, Cruaud, Gibson, Liljeblad and Munro2013), the subfamily Eurytominae, which includes the genus Eurytoma, shows high levels of homoplasy, which makes morphological classification challenging (Lotfalizadeh et al. Reference Lotfalizadeh, Delvare and Rasplus2007). This is particularly true of the Eurytoma species in the rosae group associated with the component communities in Diplolepis galls (Hebert et al. Reference Hebert, Cywinska, Ball and deWaard2003; Zhang et al. Reference Zhang, Gates and Shorthouse2014, Reference Zhang, Gates and Shorthouse2017). Molecular characters such as the widely used barcoding gene cytochrome c oxidase subunit 1 (CO1) have helped to illuminate the complex relationships present within gall component communities (Zhang et al. Reference Zhang, Gates and Shorthouse2014, Reference Zhang, László, Looney, Dénes, Hanner and Shorthouse2019; Forbes et al. Reference Forbes, Hall, Lund, Hood, Izen, Egan and Ott2016).
The objectives of this study were to extend the work of Bannerman et al. (Reference Bannerman, Shorthouse, Pither and Lalonde2012) and Zhang et al. (Reference Zhang, Gates and Shorthouse2014) to investigate Eurytoma diversity in the Okanagan D. variabilis system and to identify spatiotemporal patterns in the sex ratio of the Eurytoma population. To that end, we used CO1 barcodes for Eurytoma species in the rosae group that attack Canadian Diplolepis species (Zhang et al. Reference Zhang, Gates and Shorthouse2014) to investigate the diversity of the Eurytoma associated with D. variabilis. We tested for spatial trends in species composition along a north–south gradient and assayed for the presence of Wolbachia infection among Okanagan Eurytoma species to investigate the potential for thelytoky among species of Eurytoma parasitising D. variabilis galls.
Methods
Study system
This study was conducted in the Okanagan Valley, British Columbia, Canada, which is bounded by the Okanagan Highlands to the east and by the Thompson Plateau to the west. Gall collection sites were located in the valley bottom and ranged from Oyama to the Canada–United States of America border near Osoyoos. The Canadian range of D. variabilis is exclusive to southern British Columbia, and its galls are found only on R. woodsii (Shorthouse Reference Shorthouse and Shorthouse2010).
Specimen collection
We collected specimens in spring 2007 and 2018, using similar sampling techniques. In 2007, we collected D. variabilis galls during the first week of May at 44 sites, ranging from Oyama (latitude 50.106° N) to Vaseux Lake, British Columbia (latitude 49.298° N). Southern sampling in 2007 was limited because D. variabilis populations were less dense and infested R. woodsii sites occurred less commonly along roadsides compared to northern populations. In 2018, we collected D. variabilis galls between 14 January and 21 March at 31 sites from Oyama (latitude 50.106° N) to Osoyoos, British Columbia (latitude 49.007° N). In both years, we sampled galls from heavily infested patches and removed up to 50% of the galls present at each patch (∼150 galls maximum) to avoid local extirpation due to oversampling (see Lalonde and Shorthouse Reference Lalonde and Shorthouse2000). We air-dried galls for 24 hours, placed them into separate, labelled glass jars, kept them at room temperature (20–24 °C), and examined them every 1–4 days for adult-inhabitant emergents until one week after the last inhabitant emerged from all collections. We collected all emergent insects and stored them in labelled 1.5-mL Eppendorf tubes with 90% ethanol in 2007 and nondenatured 95% ethanol in 2018.
DNA extraction, electrophoresis gels, and Sanger sequencing of 2018 specimens
We point-mounted 60 specimens from the 2018 collections, photographed each to record morphological characteristics, and removed their abdomens for DNA extraction. These specimens represent a small subset of the 2018 emergents across the spatiotemporal range. We extracted DNA from each 2018 specimen using a DNeasy® Blood and Tissue kit (Qiagen, Inc., Valencia, California, United States of America). We used polymerase chain reaction to amplify two mitochondrial regions – the cytochrome oxidase c subunit 1 (CO1, the barcoding region) region and the cytochrome b (CytB) region – using the primers listed in Table 1. We also assayed for the presence of the endosymbiont bacteria Wolbachia using the wsp primer set (Table 1). We confirmed successful amplification by running electrophoresis gels and sent the samples to the University of British Columbia’s Fragment Analysis and DNA Sequence Service lab (FADSS – Kelowna, British Columbia) and Sequencing and Bioinformatics Consortium lab (Vancouver, British Columbia) for Sanger sequencing. Wasps from the 2007 collections were not identified past the genus level and were not included in our molecular analyses.
Table 1. Primers used for polymerase chain reaction and sequencing in 2018 samples.

Species diversity and distribution of 2018 specimens
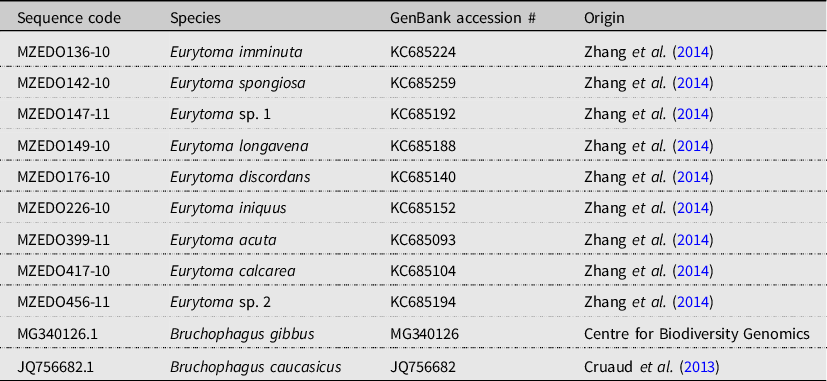
We imported forward and reverse CO1 and CytB nucleotide sequences from our specimens into Geneious Prime (2023.0.1; Dotmatics; https://www.geneious.com/prime/) and removed low-quality sequences (HQ% < 15%). Sequences with qualities above 15% were kept in case they had sections of high confidence where their complement sequences did not. For each locus, we assembled the remaining forward and reverse sequence pairs using Geneious’s De Novo Assemble function, with the sensitivity level set to high and the trim ends turned on, and saved the results as contigs. We manually cleaned the contigs and then generated consensus sequences for the cleaned and assembled sequences, removing aligned sequences that had quality values below 50%. We aligned the remaining consensus sequences using Geneious’s MUSCLE alignment tool with the maximum number of iterations set to “eight.” We removed unpaired sequences with quality values below 50% and manually trimmed the ends of the sequences before alignment using the MUSCLE alignment tool. All specimens with sequences that did not meet the above baseline criteria were excluded from further molecular consideration. We aligned the processed complement sequences to the corresponding single nucleotide alignments using Geneious’s Consensus Alignment tool with the cost matrix set to 65% similarity. We aligned our CO1 consensus sequences with published Eurytoma CO1 sequences, authoritatively identified by Y.M. Zhang (Zhang et al. Reference Zhang, Gates and Shorthouse2014), and with a Bruchophagus gibbus Boheman (Hymenoptera: Eurytomidae) outgroup sequence from the Barcode of Life’s open-source database (BOLD; Ratnasingham and Hebert Reference Ratnasingham and Hebert2007). Due to the lack of availability of open-source CytB sequences from Eurytoma species, we were unable to align the CytB sequences with previously published and identified Eurytoma sequences. We downloaded a CytB sequence of Bruchophagus caucasicus Zerova (Hymenoptera: Eurytomidae) from GenBank’s open-source databank (GenBank accession: JQ756682.1; Cruaud et al. Reference Cruaud, Underhill, Huguin, Genson, Jabbour-Zahab and Tolley2013) to use as an outgroup, imported this sequence into Geneious Prime, and aligned it with our Eurytoma CytB sequences. Reference sequences and their origins are listed in Table 2.
Table 2. Reference samples used in maximum likelihood tree in 2018 samples.
Using the modelTest function from the phangorn package (Schliep Reference Schliep2011) in R, version 4.0.3 (R Core Team 2020), we determined that the optimal phylogeny maximum likelihood model for the CO1 alignment was a GTR+I+G model. We constructed the CO1 and CytB phylogeny maximum likelihood trees with a GTR+I+G model with 1000 bootstrap alignments in the IQ-TREE web server (Trifinopoulos et al. Reference Trifinopoulos, Nguyen, von Haeseler and Minh2016).
We built the CO1 and CytB trees using ggtree (Yu et al. Reference Yu, Smith, Zhu, Guan and Lam2017) and created a tanglegram highlighting common taxonomic clades with the same colours with lines between the trees relating individuals with usable CO1 and CytB sequences. We identified clades with high branch support in our CO1 tree, based on the identified reference sequences downloaded from BOLD. We identified specimens with high-quality CytB sequences but no CO1 sequences by associating individuals with both high-quality CO1 and CytB sequences with clades with high branch support in the CytB region. We did not use species-delimitation tools because our data do not meet the assumptions (equal sample sizes among suspected species) of such tests.
To investigate the influence of latitude on species presence/absence at each 2018 site, we fit generalised linear models with binomial distributions and a logit link functions. We analysed only the impact of latitude on E. imminuta Bugbee and the aggregation of all non-E. imminuta specimens due to small sample sizes of the non-E. imminuta species.
Wolbachia infections of 2018 specimens
We diluted wsp samples submitted to be sequenced to a slightly lower concentration than is typically suggested due to low DNA volume (as a result of an error in the initial run of sequencing). We confirmed that high-quality wsp sequences were Wolbachia and determined which strains of the endosymbiont were present in our samples using the National Centre for Biotechnology Information’s Basic Local Alignment Search Tool (Altschul et al. Reference Altschul, Gish, Miller, Myers and Lipman1990). We fit a linear model with a binomial distribution and a logit link function to investigate the effect of Eurytoma species and latitude on Wolbachia presence and performed a type II analysis of variance using the “Anova” function in the car package (Fox and Weisberg Reference Fox and Weisberg2019). Samples that yielded Wolbachia bands but no wsp sequence were conservatively considered “wsp absent” because a band with no sequence offers less certainty to endosymbiont presence than does a wsp sequence itself.
Eurytoma patterns of emergence
We regressed the logit-transformed proportion of female emergents from our 2007 samples to assess the effect of latitude on sex ratio. We divided the 2007 emergence period in half into early (12 May–22 June) and late (23 June–28 July) categories and regressed the logit-transformed proportion of late emergents on latitude. To correct for the wide range of collection dates in 2018, we standardised the emergence period by calculating the date difference value between collection date and emergence date and could not reject the assumption of equal variance. We conducted Levene’s test for homogeneity of variance and a one-way analysis of variance to investigate whether the emergence period differed significantly among species in our 2018 samples. Additionally, we conducted Tukey’s post hoc multiple comparisons of mean test to determine which species showed significant differences in emergence period to one another.
Results
Species diversity and distribution of 2018 specimens
The CO1 phylogenetic tree relating to our 2018 specimens showed six distinct clades with our high-quality CO1 sequences (N = 23), five of which corresponded to the reference sequences of species published by Zhang et al. (Reference Zhang, Gates and Shorthouse2014), whereas the corresponding CytB tree showed five distinct, identifiable clades (N = 45; Fig. 1). The assignment of each specimen to a species-level clade was strongly supported by branch support values generated in the phylogeny maximum likelihood model. We were able to assign most of our CytB sequences to known species because specimens in five CytB clades also yielded at least one high-quality CO1 sequence. Two CytB specimens (210 and 313), however, did not cluster with any of the species identified from our CO1 tree and thus could not be identified (apart from not belonging to any of the five clades described above): they are excluded from further discussion. Because we obtained more high-quality CytB sequences than high-quality CO1 sequences, we were able to substantially increase our sample size of molecularly identified specimens for our statistical analyses from 23 specimens (using only CO1 sequences) to 46 specimens (using both CO1 and CytB sequences). Interestingly, five specimens appear to belong to a previously unidentified species of Eurytoma, hereafter called “Unknown Eurytoma.”

Fig. 1. Tanglegram for the mitochondrial cytochrome c oxidase subunit 1 gene (CO1, left) and the mitochondrial cytochrome B gene (CytB, right) of Eurytoma specimens from the 2018 collection with Bruchophagus gibbus (GenBank accession: MG340126.1) and Bruchophagus caucasicus (GenBank accession: JQ756682.1), respectively, as outgroups. Coloured boxes show known and unknown species and species complexes. Lines between the two trees connect specimens that produced both CO1 and CytB sequences and facilitated the identification of CytB clades.
Northern sites in our 2018 data displayed a high diversity of Eurytoma species (Fig. 2C). We recorded multiple species at 73% of our 2018 sites, where more than one individual was successfully sequenced and assigned to species (Fig. 2C). Non-imminuta Okanagan Eurytoma are more common at 2018 collection sites with increasing latitude (LR ${\chi ^2}$
= 15.2, df = 1, P < 0.0001), whereas E. imminuta are marginally more common at sites with decreasing latitude (LR
${\chi ^2}$
= 15.2, df = 1, P < 0.0001), whereas E. imminuta are marginally more common at sites with decreasing latitude (LR ${\chi ^2}$
= 3.54, df = 1, P = 0.0598). Eurytoma imminuta was the only species present in our 2018 samples at collection sites south of West Kelowna. The distributions of Eurytoma species identified in our samples are shown in Figure 2C.
${\chi ^2}$
= 3.54, df = 1, P = 0.0598). Eurytoma imminuta was the only species present in our 2018 samples at collection sites south of West Kelowna. The distributions of Eurytoma species identified in our samples are shown in Figure 2C.

Fig. 2.
A, Topological emergence map showing the proportion of female (red) and male (blue) Eurytoma that emerged from each site in 2007 collections. B, Histogram demonstrating the pooled weekly emergence of female (red) and male (blue) Eurytoma from all sites in the 2007 collections, with bars to the left and right of the dashed line representing wasps that emerged during the early half and late half of the emergence period, respectively. C, Topological map of the Okanagan Valley, British Columbia, Canada, showing distribution of sampled sites in the 2018 collection that produced at least one identifiable CO1 or CytB sequence; marker colour represents Eurytoma species recorded at each site; marker area represents number of usable sequences generated from each site. D, Histogram demonstrating the emergence of female (red) and male (blue) identified Eurytoma from the 2018 collections, grouped in 13-day periods to reflect the weekly grouped emergence of the 2007 samples. E, Dot plot showing emergence patterns for identified female (red) and male (blue) specimens of each species from the 2018 collections; the underlying boxplots represent the quartiles of each species’ emergence distribution; group means sharing the same letter do not significantly differ according to the Tukey’s post-hoc test ( $\alpha $
= 0.05). Topological maps made in ggmap v.3.0.0 (Kahle and Wickham Reference Kahle and Wickham2013), with map tiles by Stamen Design, under CC BY 3.0.
$\alpha $
= 0.05). Topological maps made in ggmap v.3.0.0 (Kahle and Wickham Reference Kahle and Wickham2013), with map tiles by Stamen Design, under CC BY 3.0.
Wolbachia infection of 2018 specimens
Eurytoma species is a significant predictor of Wolbachia infection (F 5,32 = 3.78, P < 0.0001), but latitude is not (F 1,32 = 0.133, P = 0.244). Eurytoma imminuta has significantly higher incidence of Wolbachia infection than both the E. discordans Bugbee complex (P = 0.0001, 95% confidence interval = [–0.986, –0.668]) and E. longavena Bugbee (P = 0.0032, 95% confidence interval = [–1.011, –0.615]). We found two dominant strains of Wolbachia in our samples (Table 3). The most common strain, wPun1, was present in 89% of our samples where our wsp sequences returned high-quality matches with Wolbachia sequences using the National Center of Biotechnology Information Basic Local Alignment Search Tool (GenBank accession: GU166597.1). The strain present in the other 11% of our samples matched most closely to a strain of Wolbachia known to be associated with a species of Physothorax Mayr (Hymenoptera: Torymidae) that is a parasitoid of the fig galling wasps in the genus Aepocerus Mayr (Hymenoptera: Agaonidae) (GenBank accession: AF521157.1; Shoemaker et al. Reference Shoemaker, Machado, Molbo, Werren, Windsor and Herre2002).
Table 3. Presence of wsp genetic material and corresponding Wolbachia strain in females of each species in 2018 samples.

Eurytoma patterns of emergence
The emergence of Eurytoma from the 2007 samples showed a remarkably extended pattern, by which adults could eclose and emerge from galls at any time from early May until early August (Fig. 2A, B). The logit-transformed proportion of 2007 emergents that were female varied significantly by latitude, with southernmost sites yielding few to no males and northernmost sites producing roughly equal proportions of males and females (P < 0.0001, ${R^2}$
= 0.59; Fig. 3A). A significant positive relationship between increasing latitude and proportion of early emergents in our 2007 samples occurred (P < 0.01,
${R^2}$
= 0.59; Fig. 3A). A significant positive relationship between increasing latitude and proportion of early emergents in our 2007 samples occurred (P < 0.01, ${R^2}$
= 0.33; Fig. 3B). Most Eurytoma emergents at the lowest sampled latitudes emerged during the latter half of the emergence period, whereas most Eurytoma emergents at the highest sampled latitudes emerged in the earlier half of the emergence period.
${R^2}$
= 0.33; Fig. 3B). Most Eurytoma emergents at the lowest sampled latitudes emerged during the latter half of the emergence period, whereas most Eurytoma emergents at the highest sampled latitudes emerged in the earlier half of the emergence period.

Fig. 3. Relationship between latitude and the proportion of 2007 emergents per site that are: A, female and B, late emergents (wasps that emerged during the latter half of the emergence period). Dependent variables were logit-transformed before plotting and statistical analysis. Collections from localities that yielded fewer than 25 Eurytoma adults in total are excluded.
In the 2018 samples, all male Eurytoma had emerged by 51 days after collection (Fig. 2D, E), showing a temporal skew of male emergence similar to that observed in the 2007 samples (Fig. 2A, B). The individual that spent the longest in its gall after collection was a female E. imminuta that emerged 169 days after its gall was collected. We detected no males for three of the Eurytoma species identified in our samples (E. imminuta, Eurytoma sp. 1, and Eurytoma sp. 2). Males for the other species were recorded as emerging only during the first 51 days of the 169-day emergence period.
The mean emergence periods differed significantly by species in the 2018 samples (LR ${\chi ^2}$
= 53.799; df = 5; P < 0.0001) but not by sex (LR
${\chi ^2}$
= 53.799; df = 5; P < 0.0001) but not by sex (LR ${\chi ^2}$
= 1.07; df = 1; P = 0.302) or by presence of Wolbachia (LR
${\chi ^2}$
= 1.07; df = 1; P = 0.302) or by presence of Wolbachia (LR ${\chi ^2}$
= 0.023; df = 1; P = 0.878). Eurytoma imminuta individuals emerged from the 2018 samples significantly later than all other species did, and their emergence began after all other species had completed their emergence, with the exception of one E. imminuta emerging earlier than an individual from the E. discordans complex.
${\chi ^2}$
= 0.023; df = 1; P = 0.878). Eurytoma imminuta individuals emerged from the 2018 samples significantly later than all other species did, and their emergence began after all other species had completed their emergence, with the exception of one E. imminuta emerging earlier than an individual from the E. discordans complex.
Discussion
Species diversity and distribution of 2018 specimens
Our data suggest a pattern of variability in the number of species present within one D. variabilis component community, wherein southern sites typically yield only one species and northern sites yield multiple species. Zhang et al. (Reference Zhang, Gates and Shorthouse2014) found the same phenomenon at their single British Columbia site, where five Eurytoma species were found associated with the same population of D. variabilis. The presence of multiple Eurytoma species within the individual D. variabilis component communities shown here and in Zhang et al. (Reference Zhang, Gates and Shorthouse2014) suggests that these multispecies component communities likely are present within other Diplolepis communities. Gall community studies historically compare species composition across a range of host inducer species and therefore use relatively few or even single site samples to characterise species composition for specific host species’ component communities (e.g., Nicholls et al. Reference Nicholls, Preuss, Hayward, Melika, Csóka and Nieves-Aldrey2010b; Shorthouse Reference Shorthouse and Shorthouse2010; Zhang et al. Reference Zhang, Gates and Shorthouse2014). Although that approach is generally more efficient, it can be problematic if a sampled locality yields only a small proportion of the total regional parasitoid species diversity for a given host species. We therefore suggest that future studies focus on the extent of component community variation at local and regional spatial scales for individual host species.
The five individuals from our 2018 collections that form the “Unknown Eurytoma” clade in our tanglegram did not show strong genetic association with any species represented in the barcodes uploaded by Zhang et al. (Reference Zhang, Gates and Shorthouse2014) nor with any other Eurytoma barcode identified to species in either BOLD or GenBank. The phylogenetic work done by Zhang et al. (Reference Zhang, Gates and Shorthouse2014) generated CO1 sequences for most Eurytoma species known to be associated with Diplolepis in Canada. However, the only four known specimens of the newly described species Eurytoma shorthousei Zhang and Gates did not yield usable CO1 sequences from DNA extractions (Y.M. Zhang, personal communication) and therefore could not be used as a reference in our CO1 tree. Although the type specimen for this newly described species came from the same general location as one of our Unknown Eurytoma specimens, we concluded by examination of published morphological characters that our Unknown Eurytoma are not E. shorthousei (Zhang et al. Reference Zhang, Gates and Shorthouse2017). Eurytoma shorthousei is characterised by distinct yellow colouring in the tegula, pedicel, and scape (Zhang et al. Reference Zhang, Gates and Shorthouse2017); these features were lacking in our Unknown Eurytoma specimens. The description of our potentially undescribed species has not yet been completed.
We note that the range of D. variabilis, and therefore of its associated component community, extends far past the Canada–United States of America border – at least into Washington and northern Idaho (Looney and Eigenbrode Reference Looney and Eigenbrode2011). However, the full extent of the range of this species and associated community in North America has not yet been described. Our samples thus represent the extent of the Canadian range of D. variabilis but may represent only a small subset of the spatial range covered by the species. We recommend that future work investigates the diversity of species in the rosae group of the genus Eurytoma associated with D. variabilis south of the Canada–United States of America border.
Wolbachia infection of 2018 specimens
Eurytoma species in our study showed strong variation in Wolbachia infection. The most abundant species in our study, E. imminuta, showed the highest level of Wolbachia infection. Although it is possible that the three individuals of this species that did not show evidence of Wolbachia infection represent some heterogeneity within the species (Armoo et al. Reference Armoo, Doyle, Osei-Atweneboana and Grant2017), we think it more likely that this result represents errors in our polymerase chain reaction amplification or Sanger sequencing due to low DNA volume compromising amplification efficiency in these samples (Nunes et al. Reference Nunes, Nolte and Schlötterer2008).
The presence of Wolbachia in Eurytoma across the latitudinal range is associated with the broad range of the highly infested E. imminuta in the Okanagan Valley. Wolbachia presence in aculate Hymenoptera is a strong indication of thelytoky (Stouthamer and Kazmer Reference Stouthamer and Kazmer1994; Plantard et al. Reference Plantard, Rasplus, Mondor, Clainche and Solignac1999), and we suggest that the consistent presence of Wolbachia in our E. imminuta samples and the absence of emergent male E. imminuta indicate that this species is thelytokous, at least in this region.
The low Eurytoma diversity in the south (exclusively E. imminuta) in our 2018 samples may be driven by the relatively large distance between localities supporting D. variabilis populations (observed anecdotally during gall collection in the field). This could favour the likely thelytokous E. imminuta in two ways. Lineages that express Wolbachia-driven thelytoky (Stouthamer and Kazmer Reference Stouthamer and Kazmer1994) confer a demographic advantage because these produce approximately twice the number of females, which greatly increases the probability that a lineage will successfully locate and parasitise an isolated cluster of hosts. A second advantage to thelytoky is that large distances between populations may constrain mate location by sexual Eurytoma species. This may be especially significant for parasitoid species because many species associated with gall communities may suffer limitations to dispersal (Cornell Reference Cornell1985; Cornell and Lawton Reference Cornell and Lawton1992; Bannerman et al. Reference Bannerman, Shorthouse, Pither and Lalonde2012). A number of our southernmost sites in the 2007 collection yielded only females, and the 13 southernmost Eurytoma sampled in the 2018 study were all female E. imminuta, each of which was associated with Wolbachia. We recommend that future studies with D. variabilis component communities quantify any relationship between the relative density of D. variabilis gall subpopulations and the frequency of thelytoky in associated Eurytoma across the Okanagan.
Eurytoma patterns of emergence
The difference in emergence periods between the 2007 samples, which emerged between 1 and 79 days after collection, and the 2018 samples, which emerged between 19 and 169 days after collection, is likely due to the earlier collection dates for the 2018 samples. The 2018 sampling began in January, whereas the first 2007 samples were collected in early May. We speculate that exposing diapausing gall inhabitants to constant room temperature, thereby breaking inhabitant diapause earlier in the season (Williams et al. Reference Williams, Shorthouse and Lee2003), may have attenuated emergence by slowing postdiapause development of some individuals in the 2018 samples. Because wasps were collected later in 2007, they may have already completely broken their diapause under the natural temperature regime before being collected, perhaps compacting the emergence pattern through some unknown mechanism. It is also possible that some early emergents in the 2007 collections were missed: wasps were observed emerging from the galls within a day of gall collection. The timing of the 2007 samples therefore likely reflects a more natural emergence. However, although the 2018 samples are more protracted, gall inhabitants from both sample series show the same temporally bimodal pattern in emergence.
In our 2007 samples, southern collection sites showed a strong pattern towards female bias and late Eurytoma emergence compared with northern collection sites that is consistent with the pattern of Eurytoma emergence observed in our 2018 collections. Excluding E. imminuta, the emergence of all 2018 specimens occurred within the first 85 days after galls were collected. The mean emergence period did not vary significantly between the non-E. imminuta species. In contrast, the mean emergence period for the relatively common and exclusively female E. imminuta was significantly later than that of all other species, and the emergence period extended until 169 days after collection.
In our 2018 collections, all male Eurytoma emerged within 51 days of their collection and all non-E. imminuta females emerged within 72 days of their collection, with the exception of one female that emerged 85 days after it was collected. The right-skewed male emergence for Eurytoma observed in the 2007 data set is also present in the 2018 data set. In the 2018 collection, the skew results from the late emergence of the apparently asexual and entirely female local population of E. imminuta. Therefore, the significantly later emergence of this common species would likely have similarly skewed the 2007 data set, particularly in the southern portion of our sampling range, where this species comprised the vast majority of all identified Eurytoma collected in 2018. It should be noted that in a study of the inhabitants of galls induced by Diplolepis polita Ashmead, Shorthouse (Reference Shorthouse1973) reported 91.2% of E. longavena emergents were female and that males completed their emergence earlier in the approximately 20-day emergence period than females did. This observation is consistent with our findings for our 2018 collections (exclusive of E. imminuta), where species emerged over shorter emergence periods and males had finished emergence early in their species’ respective emergence period.
The temporal right skew in male Eurytoma emergence observed here and in Shorthouse (Reference Shorthouse1973) may be due to mating pressures imposed on males. Arrhenotokous insects have haplodiploid sex determination and produce haploid males through parthenogenesis and diploid females sexually. For the Palearctic almond pest E. amygdali Enderlein, courting and mating occur only on the oviposition substrate (fruit; Plaut and Mansour Reference Plaut and Mansour1973). If this were true for arrhenotokous Eurytoma in the rosae group, we speculate that an earlier emergence would allow males to find oviposition substrate (galls) sooner than females are able to, thereby improving the males’ chances of reproducing. Conversely, for the arrhenotokous parasitoid Trichogramma dendrolimi Matsumura (Hymenoptera: Trichogrammatidae), mating primarily occurs before the wasps egress from their host egg, and males eclose from their pupae before females, which allows the males to mate in the developmental patch (Suzuki and Hiehata Reference Suzuki and Hiehata1985). If mating of arrhenotokous Eurytoma in the rosae group occurs on the gall that the emergent adults developed from, we speculate that an earlier emergence would allow males to mate with females before they leave their developmental patch.
A potential explanation for the late emergence of E. imminuta might be that this species preferentially attacks the inquiline Periclistus Förster spp., which necessarily attacks D. variabilis galls sometime after gall initiation (Ritchie Reference Ritchie1985) and is thus more available as hosts for Eurytoma later in the season than D. variabilis is. In Ontario, Canada, the emergence of Periclistus pirata Osten Sacken from Diplolepis nodulosa Beutenmüller galls was shown to occur significantly later than the emergence of the Diplolepis gallers themselves (Brooks and Shorthouse Reference Brooks and Shorthouse1997). Brooks and Shorthouse (Reference Brooks and Shorthouse1997) observed a protracted Eurytoma emergence, spanning the emergence periods of both the inducer, D. nodulosa, and the inquiline, P. pirata, with E. discordans and another Eurytoma species attacking the inquiline. The most numerous members of the D. variabilis community present in the Okanagan are Periclistus inquilines, which account for 38% of component community (Bannerman et al. Reference Bannerman, Shorthouse, Pither and Lalonde2012). Okanagan Periclistus emerge later in the season than do D. variabilis (Bannerman et al., unpublished data). Specialising on the most abundant taxon within the community may provide E. imminuta with the inherent fitness benefits that accrue from high host availability and reduced competition with other Eurytoma species. The later emergence of this species is consistent with such specialisation because this strategy would likely improve its encounter rate with Periclistus larva developing in D. variabilis galls.
Conclusions
Our study supports the prediction that the E. imminuta present in the Okanagan Valley, British Columbia, represent a thelytokous local population, as indicated by a wholly female population and high infection levels of the endosymbiont bacteria Wolbachia. We demonstrate that the strong temporal right skew in male Eurytoma emergence from Okanagan D. variabilis galls is a result of the later emergence of the potentially thelytokous E. imminuta. Our samples also provide evidence for what appears to be a previously undescribed North American species of Eurytoma, possibly overlooked due to cryptic morphology. Finally, our analysis of species diversity and distribution at a relatively small geographic scale provides evidence that gall wasp–component communities are not static; we suggest that sampling at several localities within a region may more accurately characterise the full scope of parasitoids present in regional component communities.
Acknowledgements
The authors thank Yoamel Milián-García for his expertise in navigating genetic analysis software and Yuanmeng Miles Zhang for his help with Eurytoma identification. The authors also thank Daniel Durall and Sarah Lyons for their work on Sanger Sequencing and Rosemary Garner for her patience and assistance in the laboratory. Finally, they thank Chandra Moffat and Tyler Nelson for their help in the laboratory and David Ensing for his help with making maps. This research was partially supported by a grant from the Department of Biology, University of British Columbia, Okanagan (Kelowna, British Columbia, Canada).
Author contributions
N.G.E. and R.G.L. contributed to the project design. N.G.E. contributed 2018 data collection. J.A.B. contributed 2007 data collection. N.G.E and R.G.L. contributed data analysis. N.G.E. contributed the initial draft of the manuscript. J.A.B. and R.G.L. contributed revisions to the manuscript.
Conflicts of interest
The authors declare they have no competing interests.


 Open access