


Introduction
Alzheimer's disease (AD) is a progressive neurodegenerative disorder characterized by the presence of neurofibrillary tangles and amyloid plaques, which represent the histopathological hallmark of the disease (Perl, Reference Perl2010). The accumulation of amyloid plaques in the extracellular space has long been considered as a major cause of nervous tissue damage that occurs in AD (Dong et al., Reference Dong, Duan, Hu and Zhao2012). However, failures in developing effective drugs that target the amyloid-β (Aβ) pathway have, in recent years, shifted the research focus from the amyloid to the tau hypothesis (Kametani & Hasegawa, Reference Kametani and Hasegawa2018). The two main findings that are inconsistent with the amyloid hypothesis are (1) the existence of amyloid plaques in brains of people without cognitive impairment and (2) the small amyloid plaque burden in a number of diagnosed AD patients (Edison et al., Reference Edison, Archer, Hinz, Hammers, Pavese, Tai, Hotton, Cutler, Fox, Kennedy, Rossor and Brooks2007). These plaques can be morphologically classified into diffuse and dense-core types based on their morphology and staining with Thioflavin-S or Congo Red (Bussière et al., Reference Bussière, Bard, Barbour, Grajeda, Guido, Khan, Schenk, Games, Seubert and Buttini2004; Serrano-Pozo et al., Reference Serrano-Pozo, Frosch, Masliah and Hyman2011). Dense-core plaques cause neuron damage and subsequent microglia activation and are associated with cognitive impairment in AD patients. On the other hand, diffuse plaques are a common finding in brains of people who do not have impaired cognitive function. Thus, there is a need to properly distinguish between these two types of morphologically different plaques (Serrano-Pozo et al., Reference Serrano-Pozo, Frosch, Masliah and Hyman2011).
Gray-level co-occurrence matrix (GLCM) texture analysis is a method that has proved to be useful in analyzing and quantifying the texture of different image objects, primarily cancer pathology (Pratiwi et al., Reference Pratiwi, Alexander, Harefa and Nanda2015; Vujasinovic et al., Reference Vujasinovic, Pribic, Kanjer, Milosevic, Tomasevic, Milovanovic, Nikolic-Vukosavljevic and Radulovic2015; Meyer et al., Reference Meyer, Schob, Höhn and Surov2017). Several papers have explored the efficacy of GLCM in the analysis of stained brain tissue samples (Pantic et al., Reference Pantic, Dacic, Brkic, Lavrnja, Pantic, Jovanovic and Pekovic2014, Reference Pantic, Jeremic, Dacic, Pekovic, Pantic, Djelic, Vitic, Brkic and Brodski2020; Tesic et al., Reference Tesic, Perovic, Zaletel, Jovanovic, Puskas, Ruzdijic and Kanazir2017; Dragic et al., Reference Dragic, Zaric, Mitrovic, Nedeljkovic and Grkovic2019). Taking into account the ability of GLCM analysis to detect subtle changes in the image texture of differently stained biological and pathological structures, including those in nervous cells and tissue, we hypothesize that this method is able to distinguish plaques isolated from patients with clinical and pathological diagnosis of AD dementia from plaques isolated from non-demented individuals.
Here, we demonstrate for the first time that GLCM texture analysis is a useful method in discriminating between images of amyloid plaques isolated from AD patients and non-AD individuals. Additionally, we show how different parameters of GLCM texture analysis correlate with different patient variables that describe their dementia status.
Material and Methods
Specimen Acquisition
Images of amyloid plaques for GLCM texture analysis were obtained from brain tissue samples deposited in the Aging, Dementia and Traumatic Brain Injury (TBI) Project from Adult Changes Through (ACT) study started in 1994 (freely available at https://aging.brain-map.org) (Miller et al., Reference Miller, Guillozet-Bongaarts, Gibbons, Postupna, Renz, Beller, Sunkin, Ng, Rose, Smith, Szafer, Barber, Bertagnolli, Bickley, Brouner, Caldejon, Chapin, Chua, Coleman, Cudaback, Cuhaciyan, Dalley, Dee, Desta, Dolbeare, Dotson, Fisher, Gaudreault, Gee, Gilbert, Goldy, Griffin, Habel, Haradon, Hejazinia, Hellstern, Horvath, Howard, Howard, Johal, Jorstad, Josephsen, Kuan, Lai, Lee, Lee, Lemon, Li, Marshall, Melchor, Mukherjee, Nyhus, Pendergraft, Potekhina, Rha, Rice, Rosen, Sapru, Schantz, Shen, Sherfield, Shi, Sodt, Thatra, Tieu, Wilson, Montine, Larson, Bernard, Crane, Ellenbogen, Keene and Lein2017). This database contains neuropathological, molecular, and transcriptomic data of brain samples from 107 aged control and AD patients with and without the history of TBI, as well as their demographic and clinical information. The deposited data have been generated from three brain regions (hippocampus, parietal, and temporal cortices). The initial inclusion criteria for the ACT study included volunteers aged ≥65 and free of dementia. During their follow-up, different neurophysiological battery tests were used to assess their mental and dementia status, while gathering additional information about TBI exposure. The diagnosis of dementia and AD was made by using the Diagnostic and Statistical Manual of Mental Disorders (DSM-IV) and the National Institute of Neurological and Communicative Disorders and Stroke–Alzheimer's Disease and Related Disorders Association (NINCDS-ADRDA) criteria. Additional information about the ACT study design can be found on Aging, Dementia and Traumatic Brain Injury Project website (https://aging.brain-map.org). Our attention was focused on formalin-fixed paraffin-embedded (FFPE) tissue samples that had immunohistochemical staining for Aβ plaques. By using application programming interface (API) access through the Python programing language (JupyterLab v2.2.6, free download from: https://jupyter.org/install), we were able to filter the patient database and select a total of 69 patients to include in the present study (26 AD patients and 43 control non-AD patients) and download images of Aβ plaques from three brain regions. The inclusion criteria were (1) diagnosis of dementia (AD) or no diagnosis of dementia for the control, that is, non-AD patients, (2) available immunohistochemical images of Aβ staining in any of the three brain regions, and (3) a minimum of six plaques in any brain region per patient that could be isolated and quantified. By using the selected criteria, we were able to isolate 426 plaques from AD patients (132 from the hippocampus, 168 from the parietal cortex, and 126 from the temporal cortex) and 613 plaques from non-AD patients (249 from the hippocampus, 189 from the parietal cortex, and 175 from the temporal cortex), making a total of 1,039 plaques that were used for further GLCM texture analysis. For each patient, we gathered available data about the history of TBI, number of TBIs, apolipoprotein E (ApoE)-ε4 genotype, as well as both neurofibrillary tangles (Braak) and neuritic plaques (CERAD) stage and the National Institute on Aging (NIA)-Reagen diagnosis, which were used for correlation with GLCM texture analysis parameters.
Aβ Plaque Isolation and Graphical Processing
Plaque isolation, graphic processing, and GCLM texture analysis were done using GIMP software (v.2.10, free download from: https://www.gimp.org/downloads) and ImageJ software (v1.53a, NIH, Bethesda, MD, USA; free download from http://rsbweb.nih.gov/ij). The Aβ-stained plaques were isolated from images of each of the three brain regions, which were downloaded through API access as high-quality images (format: jpg; compression level: 0). The images were scanned at 10× full resolution (approximately 1 μm per pixel) and white balanced for consistency (tissue processing section of Aging, Dementia and Traumatic Brain Injury Project, http://help.brain-map.org/display/aging/Documentation). Due to the fact that these images represent scanned images of different brain regions, they were not uniformly sized (file size ranged from approximately 32 to 229 MB, with corresponding image dimensions of 16,880 × 11,808 pixels and 20,081 × 45,682 pixels), which is why a semi-automated method of Aβ plaque isolation to separate canvases had to be applied. Aβ plaque isolation was done by the supervision of two histologists using a scissor selection tool in the GIMP software, which enabled us to specifically isolate the Aβ plaques due to their staining differences in contrast to surrounding brain tissue. Each isolated plaque was then transferred to a predefined canvas (dimension: 150 × 150 pixels, resolution: 300 dpi, bit depth: 24), thus making standardized images of Aβ plaques. These images were subsequently loaded into ImageJ and converted to grayscale 8-bit images using its default image-type converter (Fig. 1).
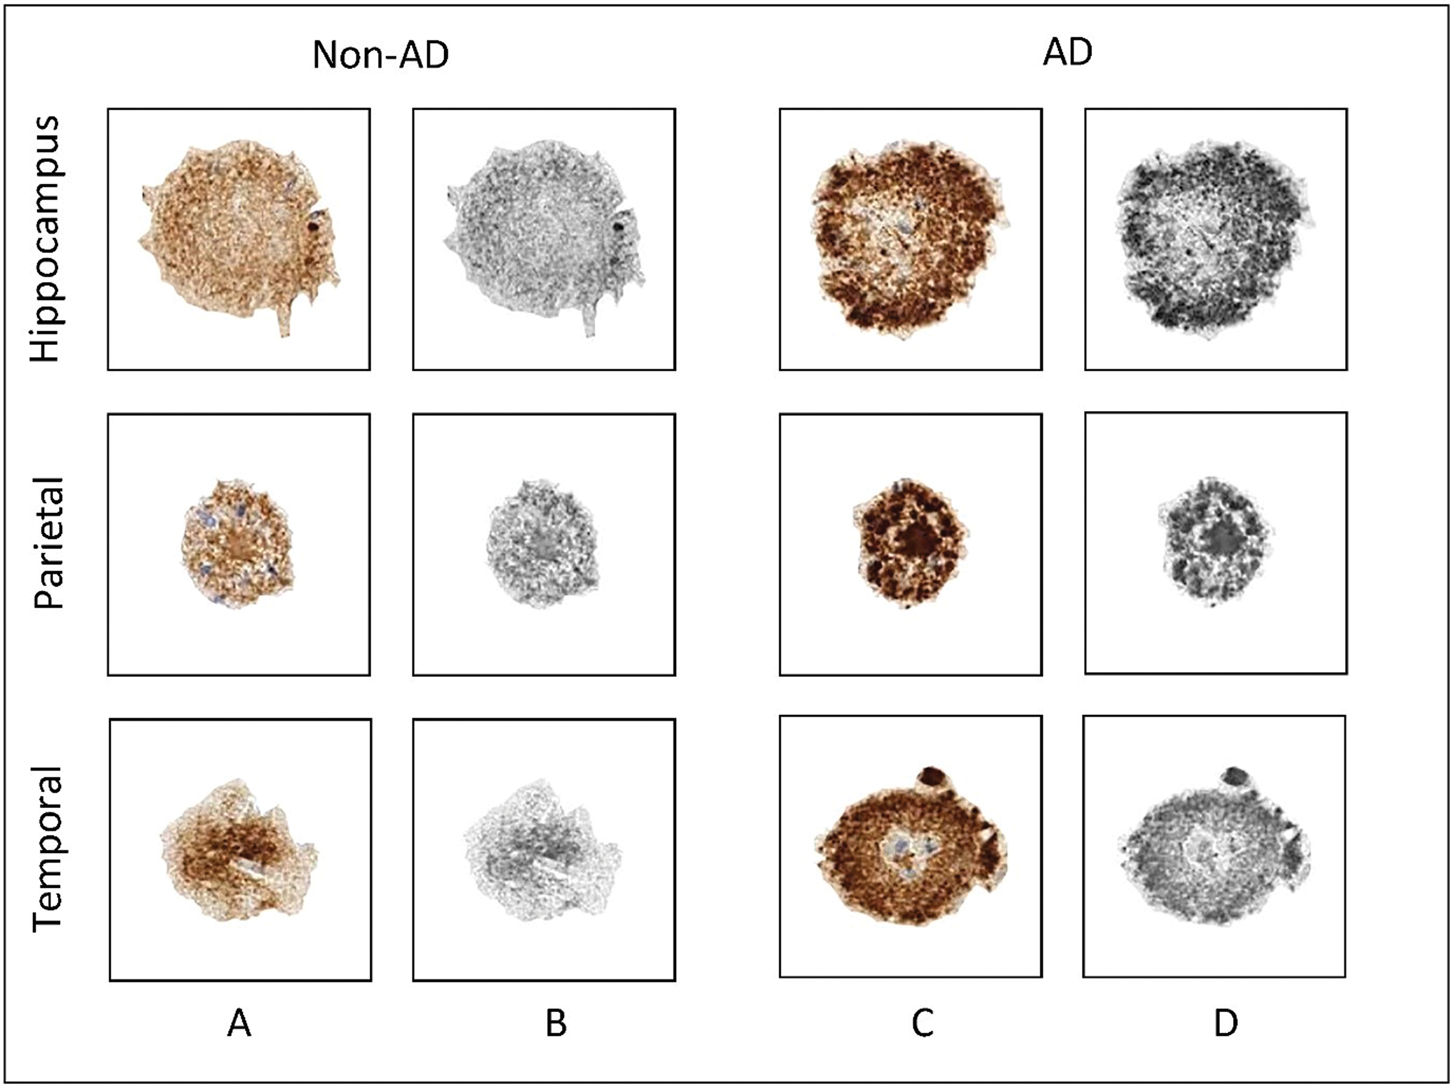
Fig. 1. Graphic processing of representative Aβ-stained plaques. Rows represent the three brain regions from which the plaques were isolated, while columns represent the patient group, that is, the dementia status of patients involved in the present study. (a) Aβ-stained plaques from non-AD patients; (b) gray-scale images of plaques from non-AD patients used for texture analysis; (c) Aβ-stained plaques from AD patients; (d) grayscale images of plaques from AD patients used for texture analysis. AD, Alzheimer's disease; non-AD, non-Alzheimer's disease.
GLCM Texture Analysis
GLCM texture analysis is a mathematical method that aims to identify texture features of an image object by analyzing the intensity differences of neighboring pixels. The analysis was done using a specific ImageJ plugin “Texture Analyzer” (version 0.4, http://rsb.info.nih.gov/ij/plugins/texture.html; developed by Julio E. Cabrera). After the grayscale images were obtained, the size of the step (in pixels) was set to 1 and the direction of the step was set to 0°. The following five parameters were computed based on the following formulas: angular second moment (ASM) [equation (1)], inverse difference moment (IDM) [equation (2)], correlation (COR) [equation (3)], contrast (CON) [equation (4)], and entropy (ENT) [equation (5)]:
 $${\rm ASM} = \sum\limits_i {\sum\limits_j {{ {\,p( {i, \;j} ) } } } } ^2, \;$$
 $${\rm IDM} = \sum\limits_i {\sum\limits_j {\displaystyle{1 \over {1 + {( i-j) }^2}}p( {i, \;j} ) , \;} } $$
 $${\rm COR} = {-}\sum\limits_{i, j} {\displaystyle{{( {i-\mu_x} ) ( {\,j-\mu_y} ) } \over {\sqrt {( {\sigma_x\sigma_y} ) } }}p( {i, \;j} ) , \;} $$
 $${\rm CON} = \sum\limits_{n = 0}^{N_{\rm g-1}} {n^2\left\{{\sum\limits_{i = 1}^{N_\rm g} {\sum\limits_{\,j = 1}^{N_\rm g} {\,p( {i.j} ) } } } \right\}, \;\vert {i-j} \vert = n, \;} $$
 $${\rm ENT} = {-}\sum\limits_i {\sum\limits_j {\,p( {i, \;j} ) {\rm log}( {\,p( {i, \;j} ) } ) . \;} } $$
The term p(i,j) is the ith and jth entry in a normalized gray-tone spatial-dependence matrix (i.e., the co-occurrence matrix), and N g is the number of distinct gray levels in the quantized image. The above formulae were originally described by Haralick et al. (Reference Haralick, Shanmugam and Dinstein1973) and subsequently modified by Walker et al. (Reference Walker, Jackway and Longstaff1995). These five parameters represent measures of an image/object homogeneity and heterogeneity; thus, the more homogeneous the pixel intensity in the image object is, the higher the values of ASM, IDM, and COR, while heterogeneous objects will have higher values of CON and ENT (Haralick et al., Reference Haralick, Shanmugam and Dinstein1973; Mohanaiah et al., Reference Mohanaiah, Sathyanarayana and GuruKumar2013; Stankovic et al., Reference Stankovic, Pantic, De Luka, Puskas, Zaletel, Milutinovic-Smiljanic, Pantic and Trbovich2016) (Fig. 2). High ASM and IDM values can be seen in images with pixels of similar gray-level values, suggesting that the texture is uniformly repetitive. On the other hand, CON and ENT as measures of heterogeneity point to higher gray-level pixel variation and are seen in heavy and chaotic texture images (Gebejes & Huertas, Reference Gebejes and Huertas2013). COR is a measure of linear dependency between neighboring pixels, where a higher COR suggests pixel similarity (Stankovic et al., Reference Stankovic, Pantic, De Luka, Puskas, Zaletel, Milutinovic-Smiljanic, Pantic and Trbovich2016). In a previous paper, we showed for the first time that these parameters can also be applied to immunohistochemically stained brain specimens, which can help us to quantify the expression of certain proteins and to which the readers are referred for additional information (Tesic et al., Reference Tesic, Perovic, Zaletel, Jovanovic, Puskas, Ruzdijic and Kanazir2017).

Fig. 2. Example of GLCM texture analysis on a gray-scale image of Aβ-stained amyloid plaque. The figure illustrates texture classification by using the GLCM analysis on a gray-scale image of Aβ-stained amyloid plaque obtained from the temporal cortex of patient with AD. This exemplary calculation is represented on four regions from the plaque center and four regions from the plaque periphery for two GLCM parameters: correlation and entropy. GLCM, gray-level co-occurrence matrix.
Data Processing and Statistical Analysis
For each patient, six plaques per available brain region were isolated. For each of the isolated plaques, five values of the GLCM texture parameters were generated, after which the mean values for each of the five parameters were calculated for each patient. These values represented final data used for statistical analysis and further graphing. The data normality was tested using Kolmogorov–Smirnov and Shapiro–Wilk tests. To assess the differences in the value of GLCM parameters between different groups of patients according to their dementia status, we used Student's independent t-test. Three-way analysis of variance (ANOVA) was used to explore the interactions between patient group–TBI–ApoE4 status relative to GLCM parameters, while two-way ANOVA was used to explore the differences in GLCM parameters between brain regions and patient's dementia status. Correlation testing between GLCM parameters and patient's dementia status was done using Spearman's rank correlation coefficient. A p-value less than ≤0.05 was considered statistically significant.
Graphical Representation
Since the ASM, IDM, COR, CON, and ENT have different ranges of generated values, we did z-score standardization in order to gain a standard score. The standardized mean values for each group were plotted in a form of radar chart, where each spoke radiating from the center of the graph represents one of five GLCM texture parameters. By connecting the mean values of GLCM parameters, which are represented as specific points on spokes, a geometrical shape in the form of a pentagon is created. One pentagon represents one group of patients in relation to their dementia status or brain region. Groups with similar values of GLCM parameters will have pentagons of similar shape and position in the radar chart graph.
Results
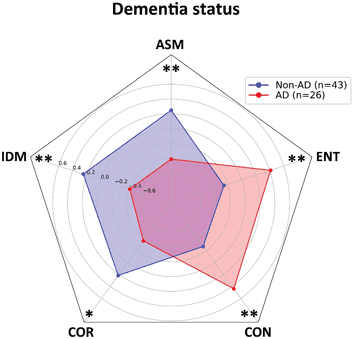
The first step in our analysis is to compare the average values of GLCM parameters between AD and non-AD patient groups. Analysis on our sample of 26 AD and 43 non-AD patients shows a statistically significant difference in all of the five analyzed parameters. The homogeneity parameters have higher values in non-AD patients (ASM: t = 3.084, p < 0.01; IDM: t = 3.061, p < 0.01; COR: t = 2.605, p < 0.05), while heterogeneity parameters (CON: t = 3.259, p < 0.01; ENT: t = 3.078, p < 0.01) are higher in AD patients, suggesting a higher pixel variation in plaques isolated from demented patients (Fig. 3).

Fig. 3. Values of gray-level co-occurrence parameters of Aβ-stained plaques isolated from Alzheimer's disease patients and non-Alzheimer's disease patients. The homogeneity parameters (ASM, IDM, and COR) show higher values in patients from non-AD group. Patients from AD group have higher values of heterogeneity parameters (CON and ENT) and lower values of mentioned homogeneity parameters. Results are represented as mean ± standard deviation. AD, Alzheimer's disease; non-AD, non-Alzheimer's disease; ASM, angular second moment; IDM, inverse difference moment; COR, correlation; CON, contrast; ENT, entropy. *p < 0.05; **p < 0.01.
Since the plaque formation and structure can potentially be influenced by the presence of TBI and ApoE-ε4, we aimed to explore the influence of these two well-known AD risk factors in our sample group. The presence of TBI is reported in 13 (50%) patients with AD and 19 (44.2%) non-AD patients (χ 2 = 0.22, p > 0.05). ApoE-ε4 genotype is present in eight (36.4%) AD patients and five (11.9%) non-AD patients, showing a borderline statistical significance in frequency distribution (p < 0.05). Data exploration with three-way ANOVA shows no significant differences for ASM (F = 0.534, p > 0.05), IDM (F = 0.351, p > 0.05), COR (F = 1.307, p > 0.05), CON (F = 0.574, p > 0.05), and ENT (F = 0.399, p > 0.05), which indicates a lack of patient group–TBI–ApoE-ε4 status interaction.
To assess whether the Aβ-stained plaques differ between brain regions, we compared the three brain regions from which the plaques were isolated, taking into account the dementia status. A statistically significant brain region–dementia status interaction is present for ASM (F = 3.171, p < 0.05), COR (F = 6.117, p < 0.01), CON (F = 5.599, p < 0.01), and ENT (F = 3.116, p < 0.05), but only IDM does not show significant interaction (F = 2.980, p > 0.05). Post hoc analysis reveals a significant difference in GLCM parameter values among brain regions only in non-AD patients. Also, this difference is present between the hippocampus and cortical regions, but not between the parietal and temporal cortices (Fig. 4). The highest statistical significance between brain regions is detected for COR, which differs between the hippocampus and both cortical regions (p < 0.0001). ASM and COR are higher, and CON and ENT are lower in Aβ-stained plaques when compared to plaques isolated from the temporal and parietal cortices, indicating that plaque texture is more homogenous in the hippocampal samples isolated from non-AD patients.

Fig. 4. Values of gray-level co-occurrence parameters of Aβ-stained plaques isolated from Alzheimer's disease patients and non-Alzheimer's disease patients in relation to brain region from which they were isolated. Significant differences are present in non-AD patients in which homogeneity parameters have higher values in plaques isolated from hippocampus, while heterogeneity parameters are higher in plaques isolated from parietal and temporal cortices. No differences are present in AD patient group. Results are represented as mean ± standard deviation. Asterisk denote statistical significance between hippocampus and cortical regions. AD, Alzheimer's disease; non-AD, non-Alzheimer's disease; ASM, angular second moment; IDM, inverse difference moment; COR, correlation; CON, contrast; ENT, entropy. *p < 0.05; **p < 0.01; ****p < 0.0001.
The relationship of the GLCM texture parameters to patient's dementia status shows a low positive correlation between heterogeneity parameters (CON and ENT) and patient group, ApoE-ε4 status and Braak stage and a moderate positive correlation with CERAD stage and NIA-Reagen diagnosis. Concurrently, homogeneity parameters (ASM, IDM, and COR) are negatively correlated with ApoE-ε4 status, Braak and CERAD stage, and NIA-Reagen diagnosis, whereas COR shows a strong correlation coefficient with CERAD stage (r s = −0.64) and NIA-Reagen diagnosis (r s = −0.6) (Fig. 5).

Fig. 5. Heatmap of correlation between gray-level co-occurrence parameters of Aβ-stained plaques and patient's dementia status. Colors in the heatmap correspond to the strength and direction of correlation, where red color denotes a positive correlation, blue color denotes negative correlation, and white color denotes a correlation coefficient of 0. Values in the heatmap boxes represent the Spearman's correlation coefficient.
Discussion
In the present study, we show that GLCM texture analysis parameters differentiate between Aβ-stained plaques isolated from AD and non-AD FFPE brain tissue samples. Previous attempts on classifying amyloid plaques between AD patients and non-AD individuals have been made by using other mathematical methods, such as fractal analysis (Pirici et al., Reference Pirici, Van Cauwenberghe, Van Broeckhoven and Kumar-Singh2011). However, this is the first time that the GLCM texture analysis method has been applied in differentiating these two types of plaques. Our results show that plaques isolated from AD patients have higher values of heterogeneity parameters and lower values of homogeneity parameters than plaques from non-AD patients. This difference in plaque image texture indicates the existence of structural variations between plaques that produce variations in the intensity of their staining. Namely, it has been shown that the plaque structure and formation differ between brains of AD and non-AD aged individuals (Cras et al., Reference Cras, Kawai, Lowery, Gonzalez-DeWhitt, Greenberg and Perry1991; Wang & Munoz, Reference Wang and Munoz1995), and that AD dense-core plaques are up to 30% larger in size than plaques from non-AD individuals (Serrano-Pozo et al., Reference Serrano-Pozo, Mielke, Muzitansky, Gómez-Isla, Growdon, Bacskai, Betensky, Frosch and Hyman2012). Recent proteomic data have supported the differences in plaque composition between these individuals (Zolochevska et al., Reference Zolochevska, Bjorklund, Woltjer, Wiktorowicz and Taglialatela2018), but also between different forms of AD (Drummond et al., Reference Drummond, Nayak, Faustin, Pires, Hickman, Askenazi, Cohen, Haldiman, Kim, Han, Shao, Safar, Ueberheide and Wisniewski2017). Nanoscale analysis has shown higher levels of non-fibrillary Aβ in the autosomal dominant form of AD, suggesting that changes at a molecular level influence the microscopic appearance of the plaque, but also may have an impact on the disease course itself (Querol-Vilaseca et al., Reference Querol-Vilaseca, Colom-Cadena, Pegueroles, Nuñez-Llaves, Luque-Cabecerans, Muñoz-Llahuna, Andilla, Belbin, Spires-Jones, Gelpi, Clarimon, Loza-Alvarez, Fortea and Lleó2019). These variations in the spatial organization of amyloid plaques are also affected by differences in the chemical composition of the plaques themselves. Beside Aβ, the plaques contain a number of different proteins including inflammatory molecules, metal ions, proteases, and amyloidogenic molecules such as clusterin, ubiquitin, α-synuclein, and ApoE (Atwood et al., Reference Atwood, Martins, Smith and Perry2002; Drummond et al., Reference Drummond, Nayak, Faustin, Pires, Hickman, Askenazi, Cohen, Haldiman, Kim, Han, Shao, Safar, Ueberheide and Wisniewski2017). The influence of different ApoE genotypes on amyloid plaque pathology was studied in several papers, which yielded different results. ApoE-deficient mice show reduced fibrillar plaque deposition and less shape compaction (Ulrich et al., Reference Ulrich, Ulland, Mahan, Nyström, Nilsson, Song, Zhou, Reinartz, Choi, Jiang, Stewart, Anderson, Wang, Colonna and Holtzman2018), which confirms the influence of ApoE-ε4 on plaque formation through possible glial-mediated inflammatory response (Rodriguez et al., Reference Rodriguez, Tai, LaDu and Rebeck2014; Ulrich et al., Reference Ulrich, Ulland, Mahan, Nyström, Nilsson, Song, Zhou, Reinartz, Choi, Jiang, Stewart, Anderson, Wang, Colonna and Holtzman2018). The lack of influence of ApoE-ε4 allele on amyloid plaques was previously reported by Serrano-Pozo et al. (Reference Serrano-Pozo, Mielke, Muzitansky, Gómez-Isla, Growdon, Bacskai, Betensky, Frosch and Hyman2012), which showed that ApoE4 genotype has no influence on the final plaque size, but is associated with higher plaque burden and early onset of symptoms (Schmechel et al., Reference Schmechel, Saunders, Strittmatter, Crain, Hulette, Joo, Pericak-Vance, Goldgaber and Roses1993; McNamara et al., Reference McNamara, Gomez-Isla and Hyman1998; Serrano-Pozo et al., Reference Serrano-Pozo, Mielke, Muzitansky, Gómez-Isla, Growdon, Bacskai, Betensky, Frosch and Hyman2012). In our study, when taking into account patients' dementia status, as well as the TBI history, there is no statistically significant interaction in relation to the texture of amyloid plaques.
We have also detected brain region differences in amyloid plaque structure, where plaques isolated from the hippocampus are more homogeneous than plaques isolated from the parietal and temporal cortices. Interestingly, this is only present in non-AD individuals, while no variation in plaque texture is shown for AD patients. Topographically, the deposition of amyloid plaques begins at the level of the isocortex, after which deeper subcortical structures, such as the hippocampus, are involved, although in lesser extent (Serrano-Pozo et al., Reference Serrano-Pozo, Frosch, Masliah and Hyman2011). Plaque density across different brain region has been investigated in a smaller number of experimental studies, which showed region-specific differences in plaque density and distribution, as it is the case between the isocortex and hippocampus (Liebmann et al., Reference Liebmann, Renier, Bettayeb, Greengard, Tessier-Lavigne and Flajolet2016; Whitesell et al., Reference Whitesell, Buckley, Knox, Kuan, Graddis, Pelos, Mukora, Wakeman, Bohn, Ho, Hirokawa and Harris2019). Additionally, not only plaque density but also morphology and plaque type have been shown to have region-specific variances (DeTure & Dickson, Reference DeTure and Dickson2019), where so-called diffuse, cored, and cored neuritic plaques can be found in layers III and V of the neocortex and hippocampal regions (Thal et al., Reference Thal, Capetillo-Zarate, Del Tredici and Braak2006). The presence of these plaques in both iso- and allocortical regions may account for the lack of texture differences in plaques isolated from our AD patient sample.
Recent data have shown that different aspects of Aβ pathology, including cognitive status, correlate with one another and can be used as a good way of predicting dementia-related factors (Thal et al., Reference Thal, Ronisz, Tousseyn, Rijal Upadhaya, Balakrishnan, Vandenberghe, Vandenbulcke, von Arnim CA, Otto, Beach, Lilja, Heurling, Chakrabarty, Ismail, Buckley, Smith, Kumar, Farrar and Walter2019). Here, we report that GLCM parameters also show correlation with specific variables that characterize patient's dementia status. Heterogeneity parameters show positive correlation with CERAD and Braak stage and NIA-Reagen diagnosis, which indicate that heterogenous plaques are more likely to be present in patients with the higher probability of having AD diagnosis. In accordance with this, homogeneity parameters show negative correlation, with COR being a parameter with the highest correlation coefficient with CERAD and NIA-Reagen variables. The usefulness of COR in GLCM texture analysis was previously shown in several papers (Pantic et al., Reference Pantic, Dacic, Brkic, Lavrnja, Jovanovic, Pantic and Pekovic2015; Stankovic et al., Reference Stankovic, Pantic, De Luka, Puskas, Zaletel, Milutinovic-Smiljanic, Pantic and Trbovich2016), in which low COR value was correlated with irregular image structure, which corresponds to a heterogeneous characteristic of amyloid plaques from our AD patient sample. When discriminating between different brain regions based on the plaque texture, COR is also one of the parameters with the highest statistical significance, suggesting that COR maybe one of the most useful parameters for quantifying amyloid plaque texture.
The present study demonstrates the usefulness of GLCM parameters in differentiating between AD and non-AD individuals based on the texture analysis of their amyloid plaques. Since many different kinds of plaques have been discovered and reported, both in AD patients and animal models of AD, as well as non-AD cognitively healthy individuals (Thal et al., Reference Thal, Capetillo-Zarate, Del Tredici and Braak2006; D'Andrea & Nagele, Reference D'Andrea and Nagele2010; Pirici et al., Reference Pirici, Van Cauwenberghe, Van Broeckhoven and Kumar-Singh2011), a problem of quantifying and differentiating these plaques emerges. As a simple, time, and cost-efficient method, GLCM texture analysis can be a valuable technique for studying the texture of amyloid plaques, as well as to differentiate and classify between different types of plaques. Given the fact that GLCM parameters also show a certain degree of correlation with variables that characterize patient's dementia status, its application can be used to test and predict values of certain dementia scores and stages. Although this is currently the only study that has used GLCM parameters in analyzing amyloid plaque texture and, therefore, requires additional studies, it represents a good starting point for further research into amyloid plaque structure and its morphometric classification.
Financial support
This work was supported by the Ministry of Education, Science and Technological Development of the Republic of Serbia (Grant No. ON175061). The authors express their gratitude to Milan Stojanović, PhD, for help in radar chart plot design.
Conflict of interest
The authors have no conflict of interest to report.


 Open access