


Introduction
The link between plant populations, vegetation structure and composition, environmental factors, and the reproductive strategies that arise from it, particularly germination ecophysiology, are fundamental factors for maintaining the ecological balance between species. These aspects should be taken into account when planning the management of natural habitats (He et al., Reference He, Zheng, Li and Qian2007; Gomez-Mercado et al., Reference Gomez-Mercado, Giménez-Luque, López-Carrique, De Haro and Del Moral2012; Gul et al., Reference Gul, Ansari, Flowers and Khan2013; Zheng et al., Reference Zheng, Chen and Wu2013). Likewise, knowledge of genetic diversity and the phylogenetic ascription of species are crucial issues to contemplate when carrying out such conservation plans (Maxted et al., Reference Maxted, Hunter and Ríos2020). European Mediterranean halophytic vegetation currently faces a serious risk of extinction and is protected by Directive 92/43/EEC (1420 Mediterranean and thermo-Atlantic halophilous scrubs, Sarcocornietea fruticosae).
In this regard, not much information is available in the literature about the geographical variation of seed features and salt tolerance in the germination phase and their connection with the ecological factors in natural halophytic populations and, furthermore, linked with its variability and taxonomy in molecular terms. We studied this relation in different populations of two species of the genus Halocnemum, perennial shrubs living in the inland salt depressions and littoral marshes of the Mediterranean Basin with differences in salinity. Seeds do not present deep physiological dormancy, although Pujol et al. (Reference Pujol, Calvo and Ramírez-Díaz2000) observed a certain degree of dormancy when the osmotic potential dropped, which disappeared during recovery. The previous analysis of two Mediterranean populations, situated in different climate regions, showed different germination strategies. Those located in an arid regime reveal an opportunistic germination strategy adapted to water availability, whereas the population in the temperate area presented notable adaptation to the season and duration of flooding, unless seeds had been previously exposed to high salt concentrations as an osmopriming effect (Estrelles et al., Reference Estrelles, Biondi, Galiè, Mainardi, Hurtado and Soriano2015). Indeed, different strategies have been previously detected in two populations of this genus, which were morphologically ascribed to distinct species, Halocnemum strobilaceum (Pall.) Bieb. and H. cruciatum (Forssk.) Tod. (Biondi et al., Reference Biondi, Casavecchia, Estrelles and Soriano2013). This gives rise to some questions about its causes and the role of genetic variation during the process. Therefore, it might be an intrinsic species character or an adaptation to environment variations, as proposed by Estrelles et al. (Reference Estrelles, Biondi, Galiè, Mainardi, Hurtado and Soriano2015). It might be related to some genetic feature associated with either genetic variability or species division or lineage because both species were previously considered the same taxon (Papini et al., Reference Papini, Trippanera, Maggini, Filigheddu and Biondi2004).
Donohue et al. (Reference Donohue, Dorn, Griffith, Kim, Aguilera, Polisetty and Schmitt2005) demonstrated the capacity of plants to adapt germination timing to diverse seasonal cues as an evolutionary response. Galloway and Etterson (Reference Galloway and Etterson2007) emphasized that maternal effects are a flexible evolutionary mechanism that allows plants to survive and colonize heterogeneous environments. However, several research works are about the characterization of seed traits, particularly germination patterns, of different taxa that are taxonomically related or not, for example, Song et al. (Reference Song, Feng, Tian and Zhang2005), Noumi et al. (Reference Noumi, Ouled Dhaou and Chaieb2010), Chérifi et al. (Reference Chérifi, Boubaker, Msanda, Saadi, Boufous and Mousadik2011), Kim et al. (Reference Kim, Aldridge, Brookes and Ganf2013) or Silva et al. (Reference Silva, Medina, Barros and Ribeiro2014), among many others. Specific studies on Halocnemum strobilaceum (Pall.) Bieb. have been carried out on various territories by several authors (Pujol et al., Reference Pujol, Calvo and Ramírez-Díaz2000, Reference Pujol, Calvo and Ramírez-Díaz2001; Song et al., Reference Song, Feng and Zhang2006; Qu et al., Reference Qu, Huang, Baskin and Baskin2008; Hosseini and Shahmoradi, Reference Hosseini and Shahmoradi2011), and some include scarce references about its autoecology. Gul et al. (Reference Gul, Ansari, Flowers and Khan2013) reviewed germination strategies in halophytes and found that wider variability in seeds provides numerous germination opportunities to ensure a population's continuity in a changing and stressful environment. Indeed, these authors further discussed how the perennial and annual halophytes living in different environments had developed particular strategies to maintain genetic diversity and to ensure enough variability to guarantee its survival in such a changing environment. Other studies relate fitness measured as germination success, among other parameters, to genetic diversity (Greimler and Dobeš, Reference Greimler and Dobeš2000; Ali et al., Reference Ali, Xu, Ismail, Fu, Vijaykumar, Gao, Domingo, Maghirang, Yu, Gregorio, Yanaghihara, Cohen, Carmen, Mackill and Li2006; Crawford and Whitney, Reference Crawford and Whitney2010; González-Varo et al., Reference González-Varo, Albaladejo, Aparicio and Arroyo2010; Li et al., Reference Li, Qi, Gu and Jin2020). Nevertheless, some authors report that seed responses are more related to environmental aspects than to genetic diversity (Heinicke et al., Reference Heinicke, Hensen, Rosche, Hanselmann, Gudkova, Silanteva and Wesche2016; Rodríguez-Rodríguez et al., Reference Rodríguez-Rodríguez, de Castro and Sosa2018), which might be mediated by epigenetic processes (Zhang and Ogas, Reference Zhang and Ogas2009), whereas some specific genes have been associated with germination success in stressful environments (Liu et al., Reference Liu, Li, Gou, Zhang, Wang, Ren, Wen, Kang, Li, Yu, Gao, Wang, Qi and Qiu2020; Rehman et al., Reference Rehman, Khan, Abbas, Rafique, Zaynab, Qasim, Noor, Inam and Ali2020).
Otherwise, the in situ micro-extraction-assisted voltammetry of microparticles (VMP) assay has been recently revealed as an effective tool in detecting plant response to saline stress (Doménech-Carbó et al., Reference Doménech-Carbó, Cervelló-Bulls, González, Soriano, Estrelles and Montoya2019). This technique has been previously applied for taxonomic purposes to leaves (Doménech-Carbó et al., Reference Doménech-Carbó, Ibars, Prieto-Mossi, Estrelles, Scholz, Cebrián-Torrejón and Martini2015; Ortiz-Miranda et al., Reference Ortiz-Miranda, König, Kahlert, Scholz, Osete-Cortina, Doménech-Carbó and Doménech-Carbó2016) and seeds (Doménech-Carbó et al., Reference Doménech-Carbó, Ibars, Prieto-Mossi, Estrelles, Doménech-Carbó, Ortiz-Miranda and Lee2017). It exploits the electroactive character of many electroactive compounds in plant matter, ranging from lignins (Kilmartin and Hsu, Reference Kilmartin and Hsu2003; Milczarek, Reference Milczarek2009; Admassie et al., Reference Admassie, Nilsson and Inganäs2014) to flavonoids and flavones, etc. (Grygar et al., Reference Grygar, Kučková, Hradil and Hradilova2003; Doménech-Carbó et al., Reference Doménech-Carbó, Doménech-Carbó and Saurí-Peris2005, Reference Doménech-Carbó, Doménech-Carbó, Calisti and Maiolo2010a, Reference Doménech-Carbó, Doménech-Carbó, Calisti and Maiolo2010b; Gil and Couto, Reference Gil and Couto2013).
The objectives of this study were to evaluate the correlation between seed parameters and the germination responses with environmental factors that are significantly involved in these processes; determine the ecological predictors responsible for behavioural strategies in natural populations; assess the role of different types of genetic features in seed responses related to taxonomical ascription of species, phylogeographical relations and genetic diversity.
Furthermore, the voltammetric response of microparticulate films from ethanolic seed extracts has been studied in contact with aqueous acetate buffer to detect possible differences associated with the distinct stress experienced by mother plants in relation to the environmental conditions of the ripening year.
In order to clarify these issues, the following hypotheses about Halocnemum species were posed:
-
- Specific climatic and edaphic factors are determinant parameters that control variation in seed response to temperature and salt tolerance.
-
- Germinative strategy correlates with phylogenetic or phylogeographic relations.
-
- Germinative response correlates with genetic diversity.
-
- The voltammetric response of seeds is a good indicator of the stress level to which the seed-producing plant has been subjected in its natural habitat.
Materials and methods
Population characterization
Field sites description
Six populations were considered: (1) Parque Natural El Hondo, Crevillente, Spain; (2) Ravenna, Riserva Naturale Sacca di Bellocchio; (3) Toscana, Principina a Mare, Parco Naturale della Maremma; (4) Cagliari, Santa Gilla, Sardegna; (5) Saline di Trapani, Sicilia, Italy and (6) Sharm el Sheik, Ras Mohamed National Park, southern extreme of the Sinai Peninsula, Egypt. Populations 2 and 3 correspond to H. strobilaceum, while the rest correspond to H. cruciatum. The population distribution map for the studied populations is shown in Fig. 1.

Fig. 1. Studied populations: (1) El Hondo, (2) Ravenna, (3) Toscana, (4) Cagliari, (5) Trapani and (6) Sharm el Sheikh. Sector graphs represent haplotype partition. The statistical parsimony haplotype network (bottom right): different haplotypes are coded with colours and numbers, where 1–5 haplotypes correspond to H. strobilaceum and 8–9 to H. cruciatum. Small white circles represent the single nucleotide intermediate changes. When these changes are multiple, the number of intermediate changes is specified, for example, 21 changes split the haplotypes corresponding to the two species.
Ecological characterization was done by the analysis of 38 parameters per population (Supplementary Appendix A). The bioclimatic diagnosis was typified from monthly temperature and precipitation averages, which were obtained from the Global bioclimatics, Phytosociological Research Centre, Spain (Rivas-Martínez, Reference Rivas-Martínez2008) and the ‘Servizio Meteorologico dell'Aeronautica Militare’, Italy (http://www.meteoam.it/). The field method (Kew et al., Reference Kew, Wetherby, Zimmermann and Meissner2004) was used to define soil texture. Phytosociological characterization was performed according to Biondi et al. (Reference Biondi, Casavecchia, Estrelles and Soriano2013).
Molecular characterization
DNA extraction and PCR amplification
Four individuals per population were germinated to extract DNA for the molecular analysis. These analyses were conducted to prove the phylogenetic ascription and lineage relations of the species and as an approach to their genetic diversity levels. DNA was isolated from Halocnemum seedlings following the Doyle and Doyle (Reference Doyle and Doyle1987) protocol, modified by Soltis laboratory (2002; https://www.floridamuseum.ufl.edu/wp-content/uploads/sites/95/2014/02/CTAB-DNA-Extraction.pdf) and other minor modifications adapted to our organism (700 μl CTAB; 30-minute incubation at 65°C; longer centrifugations; Milli-Q water for DNA resuspension). The entire internal Transcribed Spacer (ITS1 and ITS2, including 5.8S) region of nuclear rDNA was amplified using the universal primer pair ITS1-ITS4 (White et al., Reference White, Bruns, Lee, Taylor, Innis, Gelfand, Sninsky and White1990). PCR reactions were carried out following Molins et al. (Reference Molins, Moya, Garcia-Breijo, Reig and Barreno2018). The trnQ-5’rps16 region of the chloroplast genome T fragment from Shaw et al. (Reference Shaw, Lickey, Schilling and Small2007) was also amplified following the author's instructions. PCR reactions were run in 25 μl using the EmeraldAmp GT PCR Master Mix (Takara, Shiga, Japan), with the addition of Halocnemum template DNA, the specific primers explained above and water. The amplified PCR products were sequenced in an ABI 3100 Genetic Analyzer using the ABI BigDye Terminator Cycle Sequencing Ready Reaction Kit (Applied Biosystems, Foster City, California, USA).
Sequence alignment and phylogenetic analysis
MAFFT v. 7.402 (Katoh et al., Reference Katoh, Misawa, Kuma and Miyata2002; Katoh and Standley, Reference Katoh, Standley and Russel2013) was used to generate a multiple sequence alignment. An automatic search for parameters was performed and the L-INS-I algorithm was selected, which is suitable for up to 200 sequence alignments. 200PAM/k = 2 scoring matrix, the gap open penalty of 1.53 and the offset value were the other parameters. Manual optimization consisting in trimming alignment ends of longer sequences or replacing gaps at the ends of shorter sequences with ‘N’ (IUPAC base representing any base) was carried out in MEGA v. X (Kumar et al., Reference Kumar, Stecher, Li, Knyaz and Tamura2018). Ambiguously aligned regions were automatically dealt with using GBlocks v. 091b (Castresana, Reference Castresana2000) and implementing the least stringent parameters, but allowing gaps in 50% of sequences (NCBI accession numbers: MK928464–MK92848, ITS; MK937247–MK937270, trnQ-5’rps16).
A maximum likelihood (ML) phylogeny was estimated with RAxML-HPC2 (Stamatakis, Reference Stamatakis2006; Stamatakis et al., Reference Stamatakis, Hoover and Rougemont2008). The analysis used the GTRGAMMA substitution model for three delimited partitions, two in nrITS (ITS1 + ITS2 and 5.8S) and the trnQ-5’rps16 chloroplast region, and 1000 pseudoreplicates were conducted to evaluate nodal support. Additionally, a Bayesian phylogenetic MCMC analysis was implemented using MrBayes v. 3.2.2 (Ronquist et al., Reference Ronquist, Teslenko, van der Mark, Ayres, Darling, Höhna, Larget, Liu, Suchard, Huelsenbeck, Rozas, Ferrer-Mata, Sánchez-Del Barrio, Guirao-Rico, Librado, Ramos-Onsins and Sánchez-García2012). Indels were coded by SeqState v. 1.4.1 (Müller, Reference Müller2005) according to modified complex coding. Coded indels were considered a partition of standard data (states = 0, 1, 2) with a gamma rate and hyperprior set at 1.0 to allow different stationary state frequency proportions to be explored by the MCMC procedure. The optimal substitution models for the above DNA three partitions were inferred with PartitionFinder2 (Lanfear et al., Reference Lanfear, Frandsen, Wright, Senfeld and Calcott2016) by considering a model with linked branch lengths for ITS partitions and the Bayesian Information Criterion (BIC). This analysis favoured the model TRN for the ITS1 + ITS2 partition, JC for 5.8S and F81 for the trnQ-5’rps16 chloroplast region. Then, the MrBayes analysis was conducted with two parallel and simultaneous four-chain runs executed over 2 × 10⁶ generations starting with a random tree, and with sampling after every 500th step. The first 25% of the data was discarded as burn-in. The 50% majority-rule consensus tree and the corresponding posterior probabilities were calculated from the remaining trees. Chain convergence was assessed by ensuring that the average standard deviation or split frequencies (ASDSF) values were below 0.01 and the potential scale reduction factor (PSRF) values approached 1.00. FigTree v. 1.4.4 was used to construct the 50% majority-rule consensus tree. Programmes MAFFT, RAxML-HPC2, MrBayes and PartitionFinder2 were hosted on the CIPRES Science Gateway (Miller et al., Reference Miller, Pfeiffer and Schwartz2010).
Genetic diversity and haplotypes partition
Mafft original alignment without outgroups and excluding gaps was used to evaluate DNA polymorphism at the population and species levels. Four parameters were calculated with DnaSP v. 6 (Rozas et al., Reference Rozas, Ferrer-Mata, Sánchez-DelBarrio, Guirao-Rico, Librado, Ramos-Onsins and Sánchez-Gracia2017): segregating sites (s), nucleotide diversity (π), the average number of nucleotide differences (k) and the number of haplotypes (h). Haplotypes partition of population is represented on the map in Fig. 1. The relations among haplotypes were calculated by TCS v1.21 (Clement et al., Reference Clement, Posada and Crandall2000).
Germination tests
Germination analyses were carried out for the seeds collected at the time of natural dispersion in six wild populations. Seeds were manually cleaned and stored in paper bags at 20°C and 40–50% relative humidity until the germination tests began (after 5 months of storage), where the seed were used directly dry, not previously imbibed.
Germination was checked within a constant temperature range from 5 to 35°C at 5°C intervals by considering the minimum and maximum average temperatures of the meteorological stations with the most extreme climate. Salt tolerance was analysed from 0 to 500 mM NaCl at 25°C and with a 12/12 h photoperiod. The percentage and mean germination time (MGT) were calculated for all the tests (Brenchley and Probert, Reference Brenchley and Probert1998). The MGT was not considered when percentages were equal to or below 5% because, in such cases, it is not a consistent indicator of the germination response. The seeds that did not germinate after the different salt treatments were transferred to distilled water to study recovery effects. For the samples with low germination after these experiments, seed viability was checked following the standard tetrazolium staining protocol (AOSA/SCST, 2010) to discriminate non-viable seeds from potentially dormant ones.
All the tests were done on 5.5 cm-diameter Petri dishes, with four samples of 25 seeds and a substrate of 0.6% agar, prepared with the corresponding NaCl solutions to reach the indicated concentrations. Illumination was provided with daylight fluorescent tubes with a 12 h photoperiod and mean irradiance of 100 μmol m−2 s−1. Germination tests, including recovery experiments, were maintained for 30 d. The germination index (GI) sensu Melville et al. (Reference Melville, Galletta, Draper and Ng1980), which emphasizes both the percentage of germination and its speed, was calculated as  ${\rm GI} = \sum ( {T_t-( {T_i-1} ) } ) N_i/S$, where Tt is the total time (days) spent on the germination test; Ti is the number of days until the i th reading; Ni is the number of seeds germinated on day i and S is the total number of tested seeds (Ranal and Santana, Reference Ranal and Santana2006).
Recovery (germination percentage of the seeds transferred to distilled water) and total germination (TG) after recovery (expressed as the sum of the germination percentage at the different salt concentrations, plus recovery) were calculated. Base temperature (Tb), thermal time (S, to predict timing of germination under fluctuating environmental conditions) (García-Huidobro et al., Reference García-Huidobro, Monteith and Squire1982; Trudgill, Reference Trudgill1995), the base water potential (Ψb) (Bradford, Reference Bradford1990) and hydrotime (ѲH, to analyse germination rates at different water potentials) (Kebreab and Murdoch, Reference Kebreab and Murdoch1999) were calculated from the regression line equation values of the inverse of germination velocity (1/T50) to provide information about potential germination process competitiveness. The base values should be treated cautiously because they were obtained from extrapolation beyond the range of experimental conditions. These calculated values were taken as theoretical figures for the comparisons among populations. The osmotic potentials (Ψ) of the different salt concentrations were calculated according to van't Hoff equation (Ben-Gal et al., Reference Ben-Gal, Neori-Borochov, Yermiyahu and Shani2009). All the obtained data shown in both the tables and graphs are expressed as the mean of four samples.
Voltammetric analysis
The voltammetric experiments were performed at 298 ± 1 K in a CH cell using a CH I660 potentiostat (Cambria Scientific, Llwynhendy, Llanelli, Wales, UK). A BAS (Bioanalytical Systems, West Lafayette, USA) MF2012 glassy carbon-working electrode (GCE) (geometrical area 0.071 cm2), a platinum wire auxiliary electrode and an Ag/AgCl (3 M NaCl) reference electrode were used in a conventional three-electrode arrangement. To ensure repeatability, a voltammogram on the bare electrode after mechanical cleaning in a polishing clot with alumina slurry was performed before each voltammogram with a sample-modified electrode.
Voltammetric measurements were taken with freshly prepared sample-modified GCE using air-saturated 0.25 M aqueous acetic acid/sodium acetate buffer at pH 4.75 as a supporting electrolyte. For electrode preparation, 3–4 seeds were crushed in an agate mortar and pestle by adding 0.5 ml of ethanol (HPLC grade, Carlo Erba reagents, Sabadell, Spain) for 1 min. Next, 50 μl of the resulting suspension were dropped onto the GCE surface and the solvent was allowed to evaporate in air. The electrode was inserted into the electrochemical cell and electrochemical runs were performed.
The potential scan was initiated at −1.25 V in the positive direction with a potential step increment of 4 mV (25 mV square wave amplitude; 10 Hz frequency) to check the values of the current peaks at different potential values during scanning.
Statistical analysis
All the germination data used to analyse temperature and salt effects were expressed as mean values and were statistically assessed using IBM SPSS statistics software (v. 26.0). Germination percentage was modelled by fitting Generalised Linear Models (GLMs) with a logit link function and binomial error structure, to evaluate the effects of temperature or salt concentration and population and their interactions on final germination percentage. Considering the low amount of replicates (i.e. Petri dishes) and seeds per replicate, GLMs where carried out considering individual seeds as replicates (i.e. n = 100 or 60, depending on the population), attributing the value of ‘1’ when germinated or ‘0’ when not germinated.
Significant differences in MGT among temperature and salt treatments were calculated by applying one-way ANOVA according to Khan and Rayner (Reference Khan and Rayner2003).
To detect homogeneous groups among all the data resulting from temperature effect, a HSD Tukey post-hoc analysis was applied, and to consider the effect of salt in the different populations the post-hoc comparisons respect to the control were established using Dunnett's test. The equality of variances was checked through a Levene's test.
The correlation between the environmental parameters, germination response, voltammetric measurements and seed features was established with Pearson's coefficients. To find the variables with the strongest influence on population behaviour, a factor analysis based on principal components, CATPCA, was applied. This kind of analyses also incorporates categorical variables and allows any non-linear relations between them to be discovered.
In order to confirm previous results, a cluster analysis (CA) for statistical data processing was carried out. The Ward method was applied for grouping different variables and dissimilarity was defined by Euclidean distance. Ninety-four variables were considered for the analyses: 38 environmental parameters and 56 related to germination responses. The variables considered in these analyses are found in Supplementary Appendix A.
Results
Population characterization
Field sites description
The analysis of climate data and bioclimatic diagnosis of all the localities are compiled in Tables 1 and 2. The data of the meteorological stations allow include all the studied populations in the Mediterranean macrobioclimate, with the only exception being the Ravenna population, which corresponds to the temperate macrobioclimate. This one, along with Toscana, had the highest rainfall values and the lower mean temperature. In contrast, the Egypt population was the driest, with only 1.3 mm of summer precipitations, and where the highest mean temperature was also registered.
Table 1. Climate data of the closest meteorological stations of the studied populations
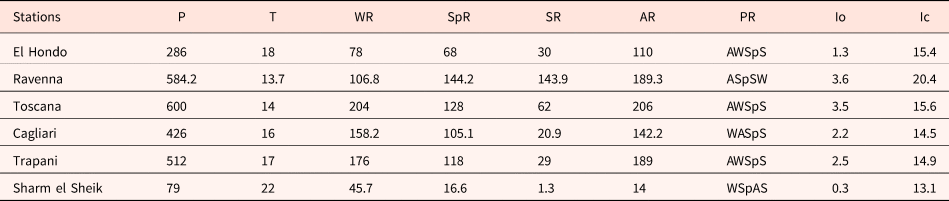
P (mm), mean annual rainfall; T (°C), mean annual temperature; WR, winter rainfall; SpR, spring rainfall; SR, summer rainfall; AR, autumn rainfall; PR, precipitation regime (W: Winter, Sp: Spring, S: Summer, A: Autumn); Io, Rivas-Martínez Ombrotermic Index (Io = 10 × Pp/Tp); Ic, continentality index (Ic = Tmax–Tmin). Data from the Global bioclimatics, Phytosociological Research Centre, Spain (Rivas-Martínez, Reference Rivas-Martínez2008) and the ‘Servizio Meteorologico dell'Aeronautica Militare’, Italy (http://www.meteoam.it/).
Table 2. Bioclimatic diagnosis

Data from the Global bioclimatics, Phytosociological Research Centre, Spain (Rivas-Martínez, Reference Rivas-Martínez2008) (Tm, Thermomediterranean; Mm, Mesomediterranean; Im, Inframediterranean).
The considered populations showed diverse soil textures ranging from sandy (Sharm el Sheik) to clay (Ravenna). The textures measured for the other populations were clay loam (El Hondo), loamy sand (Toscana), clay loam (Cagliari) and loam (Trapani).
Plant communities were assigned to four different associations: Frankenio corymbosae–Halocnemetum cruciati (El Hondo), Arthrocnemo macrostachyi–Halocnemetum cruciati (Cagliari and Trapani), Arthrocnemo glauci–Halocnemetum strobilacei (Ravenna and Toscana) and Zygophyllo albi–Halocnemetum cruciati (Sharm el Sheik) (Biondi et al., Reference Biondi, Casavecchia, Estrelles and Soriano2013).
Molecular characterization
Phylogenetic analysis
When considering a molecular analysis, the dataset comprised new 24 nrITS and cpDNA concatenated sequences belonging to species H. cruciatum and H. strobilaceum. Phylogenetic analyses included two more concatenated sequences as the outgroups obtained from NCBI: Kalidium cuspidatum and Pachycornia triandra. The Mafft algorithm produced an alignment of 1195 bp with outgroups and 1187 without them. After the automatic removal of the ambiguously aligned positions in GBlocks v. 0.91b, 99% (1184 nucleotides) of the original length was left in five selected blocks after taking outgroups into account. This final alignment included 129 variable positions, of which 41 were parsimony informative and 78 singletons. The ML analysis resulted in a single best tree of Ln = −2500.91. The Mrbayes analysis reached an average standard deviation of split frequencies of 0.01 after 390,000 generations. No statistically supported conflict was observed among the Halocnemum branch topologies obtained by these two methods. The RAxML-resulting topology is seen in Fig. 2. It shows a better resolution of the outgroups topology.

Fig. 2. Phylogram depicting the phylogenetic relations between H. cruciatum (El Hondo, Sharm el Sheik, Trapani and Cagliari) and H. strobilaceum (Toscana and Ravenna), obtained with RAxML and based on the nrITS and cpDNA data. Support values are given for each node (ML and BI analyses on the left and right, respectively).
The phylogenetic relations inferred with RAxML and Mr Bayes agree with the species division proposed in previous works based on morphology characters (Biondi et al., Reference Biondi, Casavecchia, Estrelles and Soriano2013) and a high clade support (BP = 99%, PP = 1) defined both species. The H. cruciatum populations were also separated with high clade support (BP = 100%, PP ≥ 0.99). In contrast, the two H. strobilaceum populations were clustered in a single group.
Genetic diversity and haplotypes partition
The genetic diversity approach revealed low intrapopulation variation, except for Trapani, which showed 12 polymorphic sites (s) and 7 was the average number of nucleotide differences (k). This resulted in three haplotypes separated by intermediate nucleotide changes, which indicated that more extensive sampling could discover a higher diversity. On the contrary, Sharm el Sheik, Cagliari and Ravenna did not show any diversity (Table 3) in the analysed samples.
Table 3. Polymorphism analyses for populations and species

Gaps, the number of gaps after removing ambiguously aligned positions in GBlocks v. 0.91b; s, the number of segregating sites; k, the number of nucleotide differences; π, nucleotide diversity; h, number of haplotypes.
Trapani presented three haplotypes, El Hondo and Toscana two, and the rest one per population. All the haplotypes were private for one population, except 8 that was shared between Ravenna and Toscana. Haplotypes distribution and the relations among them are shown in Fig. 1. The haplotype network revealed a specific lineage for each H. cruciatum population. Therefore, specific features could be associated with each one, for example, germination response. Another clearly differentiated lineage, separated by 21 changes of the main network, was found for H. strobilaceum.
Germination tests
Regarding temperatures, germination percentages and velocity, measured as the MGT, were significantly different (Table 4), showing an effect that depends on the population (Figs. 3 and 4; Table 5). All the studied populations reached high germination percentages, even at the extreme temperatures tested, except El Hondo and Ravenna. The less limiting and more competitive response was observed in the seeds collected from Sharm el Sheik, the most restrictive in the material from Ravenna. The moderate values and high standard deviation observed for Sharm el Sheik were associated with poor seed quality, as the tetrazolium test confirmed.

Fig. 3. Germination response to temperature for all the studied populations (0 mM NaCl). (a) El Hondo, (b) Ravenna, (c) Toscana, (d) Cagliari, (e) Trapani and (f) Sharm el Sheik. For each population, p-values are indicated and the same letters indicate homogeneous groups (Tukey P < 0.05).

Fig. 4. Relation between temperature and the germination rate (1/T50) for each studied population. Regression lines are represented for the calculation of the thermal time requirements. The regression lines that are above correspond to the most competitive population within a range of temperatures.
Table 4. Generalised linear model (GLM) results for the effect on germination of different factors: Pop (seed population), Temp (incubation temperatures from 5 to 35°C) and their interactions

Significance levels: P < 0.001.
Table 5. The mean germination time (MGT) in days within the range of studied constant temperatures with a 12/12 h photoperiod and 0 mM NaCl

The same letters indicate homogeneous groups (Tukey P < 0.05). When germination percentages were lower than 5%, the MGT was not calculated.
Trapani showed greater competitiveness at temperatures below 10°C. The Egypt population displayed the strongest reaction to increasing temperatures, the most opportunistic strategy and the most competitive response for temperatures higher than 11.6°C (calculated from intersection in regression lines, Fig. 4). In comparison to this strategy, the Ravenna and El Hondo populations showed less competitiveness at most of the temperatures. The Tb and S data were obtained from regression lines (Table 6), which numerically reflected the presented results.
Table 6. Theoretical base temperature (Tb) and the thermal time (S) calculated for each population from linear regressions, and data relative to the regression analysis, R square (R2), standard error (SE), F-test (F), coefficients (Coef) and P-value (P)

The base values shown in Fig. 4 and Table 6 should be cautiously interpreted because they were obtained from the extrapolation beyond the range of experimental conditions. These calculated values were taken as theoretical figures.
Regarding salt response, germination percentages and velocity (as MGT) were significantly different (Table 7) depending on osmotic potential and populations. The overall effect in the studied populations was negative when the salt concentration increased (Fig. 5). Two exceptions were observed: Ravenna due to the low germination of the control, and Egypt, the most tolerant without significant differences between the control and the highest tested salt concentration. However, the MGT significantly increased under all the salt conditions in relation to 0 mM NaCl (Table 8).

Fig. 5. Germination response to NaCl for all the studied populations (25°C). (a) El Hondo, (b) Ravenna, (c) Toscana, (d) Cagliari, (e) Trapani and (f) Sharm el Sheik. For each population, P-values are indicated and the asterisks indicate significant differences from 0 mM NaCl (Dunnett P < 0.05).
Table 7. Generalised linear model (GLM) results for the effect on germination of different factors: Pop (seed population), Osmpot (osmotic potential from 0 to 500 mM MPa) and their interactions

Significance levels: P < 0.001.
Table 8. Mean germination time (MGT) expressed in days under the range of studied salt concentrations (mean) at 12/12 h photoperiod

Asterisks indicate significant differences from the control (Dunnett P < 0.05). When germination percentages were lower than 5%, MGT was not calculated
When the MGT and GI values were analysed, greater competitiveness and better tolerance of the Sharm el Sheik population were once again noted under the most stressful conditions when the osmotic potential was very low (Figs. 6 and 7; Table 9).

Fig. 6. Relation between the osmotic potential and germination rate (1/T50) for the studied populations. Regression lines are represented for the calculation of the thermal time requirements. The regression lines that are above correspond to the most competitive population at the determined osmotic potentials or salt concentrations.

Fig. 7. Germination response to the different salt concentration for all the studied populations, and represented by the germination index (GI), which combines both the germination percentage and speed. (a) El Hondo, (b) Ravenna, (c) Toscana, (d) Cagliari, (e) Trapani and (f) Sharm el Sheik. Asterisks indicate significant differences in relation to the control (P < 0.05).
Table 9. Base water potential (Ψb) and hydrotime (ѲH) calculated for each population through the linear regressions, and data relative to the regression analysis, R square (R2), standard error (SE), F-test (F), coefficients (Coef) and P-value (P)

For recovery after salt exposure, the case of the seeds from Ravenna was remarkable (Fig. 8), with a strong stimulation effect observed at all the tested salt concentrations in relation to the low germination percentage obtained in the control. Indeed, the TG values for this population, expressed as the sum of the germination percentages at the different salt concentrations, plus recovery, showed a significant increase in TG after recovery with rising NaCl concentration. In the other populations, this priming effect is not observed on the TG after recovery.

Fig. 8. Germination recovery (yellow bars) after salt exposure and the germination percentage of the 0 mM from the initial salt experiment (white bar). (a) El Hondo, (b) Ravenna, (c) Toscana and (d) Cagliari. Asterisks indicate significant differences in relation to the control (P < 0.05).
Regarding the correlation between the considered environmental parameters and germination, when we looked for the potential predictors of specific seed response, Pearson's coefficients of the bioclimatic variables revealed a higher correlation with the germination parameters, as summarized in Supplementary Appendix B. From these results, we conclude that macrobioclimate, continentality index (Ic) based on the warmest and coldest temperatures of the year, winter temperatures and summer rainfall (Psm), were the climate factors that showed a higher correlation with the germination parameters, mainly with S, velocity, expressed as the MGT in the salt treatments and final germination after recovery (TG).
The germination percentages exhibited an inverse correlation with Ic, and also with Psm. MGT, showed a higher correlation with the same bioclimatic parameters in the response to both temperature and salt concentration.
Of the thermal parameters (Tb and S), only S revealed a positive correlation with Ic and Psm. TG also showed a strong positive correlation with the same climatic parameters, mainly at lower salt concentrations.
Neither phylogenetic relations nor genetic diversity could be correlated with germination strategy, but the CATPCA analysis provided relevant data when comparing environmental factors to germination response. This analysis indicated that the considered variables were represented by two new variables or principal components. These two new components accounted for 78.9% of total variance. Therefore, two vectors were used for the statistical analysis. Of the total variance given by these first two components, 58.7% corresponded to the first component and 20.2% to the second component. Cronbach's alpha values for each component were 0.986 and 0.921, respectively, with a total of 0.995 that indicated good internal consistency.
The graphic representation of the loadings and scores in Components 1 and 2 shows the distribution of the studied populations according to the considered variables, seed features, climate factors, soil texture and germination variables (Fig. 9). To simplify the graphic, only the most correlated variables, based on the Pearson coefficient results, are represented.

Fig. 9. Biplot of the component loadings from CATPCA for the first two components. Populations are indicated by vectors. The acronyms for the variables are described in Supplementary Appendix A.
The variables with the highest weight value in each component were:
-
- Component 1: Recovery from 300 to 500 mM NaCl, MGT 350–400 mM and S; with negative values: Bioclimate and germination percentage at 500 mM.
-
- Component 2: Germination percentage at 10, 20 and 25°C, and percentage at 50 and 150 mM; with negative values, MGT at 100 mM NaCl.
Based on these findings, the Ravenna population showed a considerable distance from the others, mainly due to the low germination (percentage and velocity) and greater recovery at high salt concentrations. Sharm el Sheik was on the other extreme of the graph because of its broad germination response under the highest salinity conditions.
The other four populations, with intermediate behaviour in relation to these variables, were separated into two groups according to the variables with the highest weight values in Component 2. Toscana differed from El Hondo, Cagliari and Trapani given by the response under low salt concentrations and at moderate temperatures, but mostly by climate factors.
The CA analysis results agree with those previously described for CATPCA and showed three clusters (Fig. 10) based on the different environmental factors and germination response. The analyses indicated that only 70 of the 94 examined parameters had a significant effect on the separation of groups.

Fig. 10. Dendrogram for the cluster analysis conducted with 94 variables. Dissimilarities are defined by Euclidean distance and the combination of clusters is based on the Ward method.
Group I, represented by a single population (Ravenna), showed a long distance from the other groups. This sample point displayed substantial differences for both environmental conditions (Ic, winter and autumn temperatures and summer rainfalls) and germination response, mainly the seeds with the lowest germination percentage and the slowest velocity, as well as the greatest recoveries.
As expected, the Sharm el Sheik population in cluster II showed an intermediate distance between clusters I and III as a result of the special environmental factors (higher winter temperatures, and less summer, spring and autumn rainfall). This environment gave rise to a different germination strategy, a high germination percentage and a high velocity value, with no recovery after salt exposure.
The four remaining populations formed the other group (cluster III). It obtained intermediate values for the above-mentioned climatic parameters between the other two groups, and also an intermediate response to salt exposure and recovery.
Voltammetric analysis
In relation to the voltammetric study, Fig. 11 shows the square wave voltammograms recorded for the seeds of studied populations. The values of the intensity measured at the potentials of 400 mV (i(400)), 750 mV (i(750)) and 950 mV (i(950)) provided useful information, but their absolute values could not be considered because they depend on the amount of extract deposited on the electrode. However, the general voltammogram profile was precisely repeated for each sample. This means that the ratios between the different peak intensities were correctly reproduced regardless of the amount of extract. The ratio between the signals at +0.40 and +0.75 V significantly varied for the different samples.

Fig. 11. Square wave voltammograms of the microparticulate films deposited on glassy carbon electrode from the ethanolic extracts of Halocnemum strobilaceum seeds from (a) El Hondo, (b) Ravenna, (c) Toscana, (d) Cagliari, (e) Trapani and (f) Sharm el Sheik immersed into air-saturated 0.25 M aqueous acetate buffer, pH 4.75. Only the region of the potentials between −0.40 and +1.20 V is depicted. Dotted lines represent the base lines adopted for the peak current measurements.
As shown in Fig. 12, where a two-dimensional diagram containing the i(950)/i(750) and i(400)/i(750) peak current ratios measured from the base lines depicted are in Fig. 11. Two groups from the averaged values of the i(950)/i(750) ratio were discerned: (1) the samples from Toscana, El Hondo and Sharm El Sheik, characterized by higher values for the above ratios (0.88, 0.754 and 0.947, respectively); (2) the samples from Cagliari, Ravenna and Trapani with values of around 0.5.

Fig. 12. Two-dimensional diagram showing the i(950)/i(750) and i(400)/i(750) peak current ratios recorded from the voltammograms in Fig. 11.
This ratio (i(950)/i(750)) correlated with specific environmental parameters and seed response. The Pearson analysis between the voltammetric and germination parameters showed a higher correlation of i(950)/i(750) with the germination percentage and recovery at high salt concentrations, that is, 450 and 500 mM NaCl (Supplementary Appendix C). The same analysis carried out, but by considering the voltammetric and environmental parameters, gave higher correlations between i(950)/i(750), (Supplementary Appendix D) and spring and autumn temperatures and spring and summer rainfall. In our case, ratio i(950)/i(750) provides us with a good indicator tool.
Discussion
Germination behaviour is a complex process dependent on multifactorial causes. In most cases, and especially under extreme conditions, it is somewhat determined by the local intrinsic and environmental factors interacting in a complex manner. The genetic factors, such as local alleles or epigenetic modifications, lead the process in the last term. Finally, all these factors allow plants to be in the right place at the right time to reach germination success (Li et al., Reference Li, Lu, Yang, Kong and Deng2015).
The germination of the studied populations differs considerably in response to the tested temperature and salinity conditions, and depending on the geographical distribution of populations. Sharm el Sheik in Egypt proved to be the most tolerant population, just the opposite of Ravenna in northern Italy. In the present article, some predictors associated with these responses have been identified for Halocnemum species. In general, these responses appear to be directly related to ecological factors rather than phylogenetic ascription or genetic variability, as previously observed in other species (Estrelles et al., Reference Estrelles, Güemes, Riera, Boscaiu, Ibars and Costa2010; Gul et al., Reference Gul, Ansari, Flowers and Khan2013; Rasool et al., Reference Rasool, Hameed, Khan and Gul2017). Additionally, a voltammetric tool has been successfully tested as an indirect technique to predict seed response in stressful environments.
Environmental parameters
The first group of predictors of germination studied, which affect both percentage and speed, are those related to environmental parameters. The differences in germination behaviour in relation to them have been described as a survival mechanism characteristic of species growing in areas subjected to extreme water stress, with unpredictable amounts and rain distribution (El-Keblawy and Al-Shamsi, Reference El-Keblawy and Al-Shamsi2008; El-Keblawy et al., Reference El-Keblawy, Al-Sodany and Al-Hadad2009; Liu et al., Reference Liu, Zhang, Yang, Huang, Duan and Wang2014). For Halocnemum species, the CATPCA analysis points out the fundamental role of the environmental variables, such as soil texture, bioclimate, thermotype and ombrotype, in the distribution of the populations in both the extracted components. However, macrobioclimate comes over as the key factor for seed germination in the studied species. The populations belonging to the Mediterranean macrobioclimate display an opportunistic strategy, which is the characteristic of drought stress environments in which germination depends on water availability. This behaviour is even more pronounced in places with lower precipitation rates. Conversely, the seeds collected at Ravenna show the opposite response, with specific requirements to reach optimal germination levels. The climate of this locality is considered a sub-Mediterranean variant of the temperate macrobioclimate according to Biondi et al. (Reference Biondi, Casavecchia, Estrelles and Soriano2013), that is, a higher and more regular precipitation regime. Additionally, the analyses conclude that the use of the specific climatic data of the collection year can be proposed to obtain more accurate correlations with the analysed germinative parameters, instead of taking average from different year values (T and P). In our study, the values of winter temperatures and summer precipitation recorded in the collecting localities have been revealed as determining factors.
In addition, soil texture acts as another fundamental factor predicting seed response given the interpopulation differences when exposed to different salt concentrations, since both are directly related due to water holding capacity. In this sense, the clay soil had the highest water holding capacity and the sand soil had the least, the latter enhancing the stress due to osmotic potential. Thus texture and, therefore, water retention capacity, are among the most determining variables in the PCA analysis for the separation between populations. Previous studies into Halocnemum populations have pointed out the influence of soil features on germination behaviour (Estrelles et al., Reference Estrelles, Biondi, Galiè, Mainardi, Hurtado and Soriano2015). These results also agree with not only Rubio and Escudero (Reference Rubio and Escudero2000), who highlighted the relevance of this soil property for the vegetation response in dry gypsum environments, but also with Ferriol et al. (Reference Ferriol, Perez, Merle and Boira2006), who found a correlation between sand proportion in soil and germination velocity.
Therefore, the seeds from Sharm el Sheik are exposed in a natural environment to water stress conditions, which result from the low rainfall and high temperatures registered all year long, plus sandy soils make water retention difficult. In this sense, the effect of maternal conditions to improve salt tolerance for offspring of different species has also been evidenced by several authors (Mohamed et al., Reference Mohamed, Kasem, Gobouri, Elkelish and Azab2020; Shah et al., Reference Shah, Rasheed, Gul, Khan, Nielsen and Hameed2020). An opposite response is seen for the seeds collected from Ravenna, where clay is the main soil component and is responsible for high water retention capacity, long flooding periods and low salt concentrations.
Although Ravenna proved to be the least tolerant population in relation to the low salt concentration of its maternal location, its results in terms of recovery rates allow to confirm a halopriming effect for this species. The recovery test showed that germination was stimulated after exposure to a high concentration of NaCl. This response has been formerly verified in other species living under similar environmental conditions (Khan and Gul, Reference Khan, Gul, Khan and Weber2006; Estrelles et al., Reference Estrelles, Prieto-Mossi, Escribá, Ferrando, Ferrer-Gallego, Laguna, Ibars and Soriano2018). Natural priming confers these plants major advantages over others, mainly better germination process initiation control, others like a quick cellular defence response against abiotic stress (Jisha and Puthur, Reference Jisha and Puthur2014) and a strategy for increasing antioxidant enzyme activities to achieve osmotic adjustment to control salt stress effects (Saha et al., Reference Saha, Chatterjee and Biswas2010).
Genetic features
The other group of predictors analysed is related to the genetic characteristics of species: genetic variability and phylogenetic ascription. On the one hand, higher levels of genetic diversity may offer adaptive advantages in changing environments (Dekker, Reference Dekker2003; Crawford and Whitney, Reference Crawford and Whitney2010) and, on the other hand, species divisions, or even local lineages, could be determined by specific adaptations. However, these intrinsic features do not seem to be clearly related to germination responses.
Genetic diversity does not seem to affect the current germination success herein determined and similar results have been obtained in other plants, such as Sambucus palmerensis (Rodríguez-Rodríguez et al., Reference Rodríguez-Rodríguez, de Castro and Sosa2018), Stippa pennata (Heinicke et al., Reference Heinicke, Hensen, Rosche, Hanselmann, Gudkova, Silanteva and Wesche2016), among others. Likewise, the phylogenetic characterization shows a clear split into two species, as Biondi et al. (Reference Biondi, Casavecchia, Estrelles and Soriano2013) concluded using morphologic data, which cannot be associated with germination strategies. Alternatively, specific lineages appear in the haplotype characterization of populations that could be related to these strategies, at least in H. cruciatum. Although the studied genetic regions are no related to ecophysiology plant responses, they could develop in parallel with other genetic adaptations to the conditions of their particular area due to environmental selection pressure. In fact, some studies report gene alleles related to germination responses and drought or salt stress (Mumtaz et al., Reference Mumtaz, Naveed and Shinwari2010; Liu et al., Reference Liu, Li, Gou, Zhang, Wang, Ren, Wen, Kang, Li, Yu, Gao, Wang, Qi and Qiu2020; Rehman et al., Reference Rehman, Khan, Abbas, Rafique, Zaynab, Qasim, Noor, Inam and Ali2020). However, the two H. strobilaceum populations belong to the same lineage, but the ecological conditions of their localities and, therefore, their germinative responses, significantly differ. This means that different responses cannot be explained by the existence of these lineages alone, and genetic characterization appear to be a partial predictor, which only function in one of the species. In this sense, other genetic processes related with priming and epigenetics could determine the different responses observed (Chinnusamy et al., Reference Chinnusamy, Gong and Zhu2008; Zhang and Ogas, Reference Zhang and Ogas2009; Roy, Reference Roy2016; Bowers and McCullough, Reference Bowers and McCullough2017; Al-Shamsi et al., Reference Al-Shamsi, El-Keblawy, Mosa and Navarro2018; Godwin and Farrona, Reference Godwin, Farrona, Spillane and McKeown2020).
The voltammetric tool
The study of the voltammetric profiles proves an effective technique that can act as an indirect behaviour predictor based on maternal plant stress. Plants under abiotic stress conditions exhibit an increased synthesis of polyphenols, such as phenolic acids and flavonoids (Sharma et al., Reference Sharma, Shahzad, Rehman, Bhardwaj, Landi and Zheng2019). Water deficit or salt stress, and some stress types in general, trigger the metabolic mechanisms related to the chemical group of flavonoids and other polyphenolics (Winkel-Shirley, Reference Winkel-Shirley2002; Hernández et al., Reference Hernández, Alegre, Van Breusegem and Munné-Bosch2009). The presence of this kind of compounds in seeds is widely referenced in the literature and also in Amaranthaceae (Oliveira-Alves et al., Reference Oliveira-Alves, Vendramini-Costa, Cazarin, Júnior, Ferreira, Silva, Prado and Bronze2017; Adegbola et al., Reference Adegbola, Adetutu and Olaniyi2020), mainly in relation to their use as antioxidants, but also in association with stress tolerance (Sahitya et al., Reference Sahitya, Krishna, Deepthi, Prasad and Kasim2018). Thus, voltammetric profiles provide valuable information about the oxidation of polyphenolic compounds in plants (Doménech-Carbó et al., Reference Doménech-Carbó, Ibars, Prieto-Mossi, Estrelles, Scholz, Cebrián-Torrejón and Martini2015). Indeed, these techniques have been applied to different aspects related to germination response and offer interesting results (Doménech-Carbó et al., Reference Doménech-Carbó, Cervelló-Bulls, González, Soriano, Estrelles and Montoya2019). In this study, the parameter i(950)/i(750) ratio obtained from the voltammetric profile measured from seeds can be specifically associated with plant stress by showing the maternal effect related to drought in Halocnemum species. Although other factors influence the observed electrochemical response, the data summarized in Fig. 12 can only be analysed after considering the local environmental factors found where specimens grow.
Conclusion
The multidisciplinary approaches that encompass different aspects of halophytes are important to help to gain a better understanding of these species’ ecophysiology. From this research, the following conclusions can be drawn:
-
- Macrobioclimate, the continentality index, summer precipitation and winter temperatures, and soil texture, are determinant parameters that are directly associated with the differences in seed response.
-
- The specific climatic data of the collection year are fundamental in germination and should be considered by future research.
-
- Germination strategies cannot be associated with the taxonomic rank and genetic diversity of the studied species.
-
- The existence of local lineages can be related to seed responses only in H. cruciatum.
-
- Some voltammetric parameters are good indicators of the water stress that plants undergo in their natural habitats, which support the applicability of these techniques as a tool to predict germination response.
The determination of key parameters related to the timing of emergence events provides effective tools for optimizing management programmes in natural habitats.
Supplementary material
To view supplementary material for this article, please visit: https://doi.org/10.1017/S0960258522000253.
Acknowledgements
We wish to thank the collaboration of the foresters who manage the ‘State Natural Reserve Sacca di Bellocchio’ for their assistance in seed collection, and the ‘El Hondo Nature Park’ for providing the required permissions.
Author contributions
E.E., P.S., E.B.: conceived and designed the research; E.E., P.S., E.B.: provided seed samples; E.E., P.S., A.D-C., M.I.M-N., M.G.: carried out all the experimental work; E.E., P.S., M.I.M-N., M.G.: performed the statistical analysis; E.E., P.S., A.D-C., M.I.M-N., E.B.: data interpretation; E.E., P.S., M.I.M-N.: wrote the manuscript. All the authors contributed to data discussion and conclusions, and reviewed and approved the final manuscript.
Funding
Partial financial support is acknowledged from the MICINN Project CTQ2014-53736-C3-2-P and the subsequent PID2020-113022GB-I00, which are also supported with ERDF funds related to the electrochemical experiments.
Conflict of interest
The authors declare no conflict of interest.


 Open access