


Brain structures implicated in schizophrenia include the prefrontal cortex (Reference Selemon and Goldman-RakicSelemon & Goldman-Rakic, 1999), the anterior cingulate (Reference BenesBenes, 1998), the thalamus (Reference JonesJones, 1997), the hippocampus (Lipska & Weinburger, 1993), the cerebellum (Reference AndreasenAndreasen, 1999) and the neuronal circuits connecting these structures (Reference Carlsson and CarlssonCarlsson & Carlsson, 1990; Reference FristonFriston, 1998; Reference Grace, Moore and O'DonnellGrace et al, 1998; Reference Feinberg and GuazzelliFeinberg & Guazzelli, 1999). Phosphorus magnetic resonance spectroscopy (31P-MRS) measures membrane (phosphomonesters (PME); phosphodiesters (PDE)) and energy (adenosine triphosphate (ATP); phosphocreatine (PCr)) metabolism. Past 31P-MRS of patients with schizophrenia who had never been treated shows decreased PME and increased PDE in the left prefrontal and left temporal regions. Studies of people with chronic schizophrenia are inconsistent with unchanged or decreased PME in prefrontal and temporal locations and increased, unchanged or decreased PDE in prefrontal, parietal and temporal locations (Reference Williamson, Drost, Glen and HorrobinWilliamson & Drost, 1999). Past 31P-MRS at low fields had limited spatial resolution. This high-field study images effective voxels of 15 cc and measures each PME metabolite — phosphoethanolamine (Peth) and phosphocholine (PCh) and PDE metabolite — glycerophosphoethanolamine (GPEth) and glycerophosphocholine (GPCh) from multiple locations. We hypothesised that people with schizophrenia would show altered membrane phospholipid metabolism in structures implicated in schizophrenia — the dorsolateral—prefrontal cortex, the anterior cingulate, the thalamus, the hippocampus and the cerebellum.
METHOD
Subjects
Eleven male patients with chronic schizophrenia and 11 healthy male volunteers participated in the study after giving informed consent according to the guidelines of the Review Board for Health Sciences Research Involving Human Subjects at the University of Western Ontario (see Table 1). The DSM-IV diagnosis of schizophrenia was established with the Structured Clinical Interview for DSM-IV (SCID) (Reference First, Spitzer and GibbonFirst et al, 1997) administered by a psychiatrist (P. C. W., Y. S). Four were classified as having paranoid, five residual and two undifferentiated schizophrenia. Six patients were on olanzapine (10.8 mg, s.d.=5.3), two were taking conventional neuroleptics (fluphenazine decanoate 25 mg intramuscular every three weeks, flupenthixol decanoate 20 mg intramuscular every four weeks), one was taking clozapine 350 mg four times daily, one was taking quetiapine 450 mg four times daily and one ziprasidone 120 mg four times daily at the time of the scan and all had been on conventional medications prior to going on atypical neuroleptics. Four had received an anticholinergic agent and one benzodiazepine in the 24 hours before the scan. Ratings of symptoms were assessed with the Scale for the Assessment of Negative Symptoms (SANS) (Reference AndreasenAndreasen, 1984a ) and the Scale for the Assessment of Positive Symptoms (SAPS) (Reference AndreasenAndreasen, 1984b ) without knowledge of 31P-MRS results. Parental education of the most educated parent was rated on a four-point scale as in our previous publications (Reference Stanley, Williamson and DrostStanley et al, 1995; Reference Potwarka, Drost and WilliamsonPotwarka et al, 1999a ). Handedness was also assessed by a rating scale (Reference BrydenBryden, 1977).
Table 1 Subject characteristics
| Control group | Schizophrenia group | |
|---|---|---|
| Male | 11 | 11 |
| Female | 0 | 0 |
| Right-handed | 9 | 9 |
| Age (years) | 42.2 (s.d.=8.5) | 42.9 (s.d.=7.4) |
| Parental education1 | 2.4 (s.d.=1.2) | 1.7 (s.d.=7.3) |
| Length of illness (years) | 21.6 (s.d.=7.3) | |
| Total SANS score | 28.9 (s.d.=11.7) | |
| Total SAPS score | 16.4 (s.d.=6.0) |
The healthy volunteers were recruited from the community by advertisement and were assessed by a psychiatrist (P. C. W., Y. S.) with the SCID. Controls were of comparable age, gender, handedness and parental education levels. No patients or controls had a history of head injury, drug or alcohol misuse or serious medical illnesses.
1H-MRI
All experiments were performed on a 4.0 Tesla (Varian/Siemens/Unity-INOVA) whole-body magnetic resonance scanner operating at 170.3 MHz. A single-tuned, 1H quadrature hybrid-birdcage volume headcoil was used for shimming and imaging. Subjects were positioned supine with their heads secured in a plexiglas cradle and a 10 × 10 × 6 cm (6 cm superior-inferior) volume positioned mid-sagittally was shimmed with an automated shim protocol (Reference GruetterGruetter, 1993). A 2D-FLASH imaging sequence acquired anatomical sagittal and coronal images of the brain for 31P voxel positioning (TR=11 ms, TE=6 ms, 256 phase-encodes, 0.93 × 0.93 mm pixels). Thirty-two T1-weighted transverse images were acquired on the brain using a magnetisation-prepared (adiabatic inversion pulse 0.5 secs prior to data collection) 3D-FLASH imaging sequence (TR=11 ms, TE=6.2 ms, total acquisition time <3 minutes) with a nominal slice thickness of 4.375 mm and 1.09 × 1.09 mm in-plane resolution. These images were used to calculate grey matter, white matter and cerebrospinal fluid (CSF) ratios in the 31P-CSI volumes.
Image segmentation/partial-volume estimation
The transverse image data set for each subject was first separated into three distinct binary tissue maps: grey matter, white matter and CSF/air/bone by thresholding the original high-contrast image set, which best displayed the ventricles, corpus callosum and grey matter of the anterior cingulate. The thresholding co-efficients were then varied until each segmented image type matched the corresponding anatomy in the original reference image. The thresholding values differed between subjects since image signal intensity depended on receiver gain and coil loading. To obtain the tissue ratio contribution for each 31P region of interest (ROI), the three segmented image data sets were convolved with the calculated 3D-PSF of the 31P-CSI acquisition (Jensen et al, 2001). The partial volume contribution for each tissue type was then expressed as a percentage of total tissue contribution for each ROI.
In vivo 31P-MRS
Once the 1H-shimming and imaging were completed, the 1H-head coil was manually replaced with a single-tuned, 31P quadrature, 14 cm long birdcage head-coil with the subject still in place in the plexiglas cradle inside the magnet. Previous phantom experiments verified that manual coil replacement did not affect the shim. A 31P external reference standard (methylene diphosphonic acid (MDP), 270 mM, T1@ 4.0T∼6 secs) was fastened to the plexiglas head cradle just left of the patient's head The 1.5 cm diameter reference tube was positioned so its length ran axially, spanning the sensitive region of the 31P-RF coil. Transmit/receive frequency was centred on PCr, as measured with a global free induction decay (FID). Tip angle, optimised for the PME/PDE resonance at a 500 ms TR, was 32 degrees. In vivo 31P-MRS utilised an optimised 3D-CSI sequence: TR=500 ms; Rx bandwidth=±2 kHz; complex-points=1600; readout duration=400 ms; pre-pulses=20; Rx gain=94 dB; pre-acquisition delay=1.905 ms; field of view (FOV) (x, y, z)=280 mm; nominal volume=5.4 cc; maximum phase-encode matrix dimension (x, y, z) 14 × 14 × 14 (zero-filled out to 16 × 16 × 16 prior to reconstruction). The 3D-CSI sequence used a reduced phase-encoding scheme based on prior work (Reference Ponder and TwiegPonder et al, 1994). This scheme allows for the inclusion of spherically bound, reduced-point, weighted k-space acquisition, providing approximately 40% more signal-to-noise for a given scan time and effective voxel volume over conventional methods.
In vivo post-processing and spectral analysis
All in vivo CSI/image data were processed and viewed using Varian Nuclear Magnetic Resonance (VNMR) software, Version 6.1b and software designed and written on site. Prior to Fast Fourier Transform (FFT) reconstruction to spatially resolve the CSI spectra, the collected k-space data was centred in a 16 × 16 × 16 cubic matrix. Each time-domain FID was then zero-filled out to 2048 complex points and left-shifted five points to remove residual bone/rigid membrane signal.
Using the 1H images, the 3D-CSI data grid was shifted in thex, y and z dimensions in order to position each voxel in the appropriate 31P ROI. For all subjects, the Brodmann area and Talairach coordinates for voxel centres (x, y, z) in the brain were evaluated for every 31P ROI using SPM99b-Statistical Parametric Mapping (Reference Ashburner, Fristor and HolmesAshburner et al, 2000) and are listed in Table 2. Partial overlap with adjacent structures was unavoidable in many of the regions due to voxel volume and shape (Fig. 1).

Fig. 1 Voxel positions. Regions of interest displayed on transverse localiser images. Pre-frontal, IA; anterior cingulate, 2A; parieto-occipital, 3A; posterior cingulate, 4A; thalamus, 5B; hippocampus, 6B; cerebellum, 7C. Corresponding voxel positions are displayed on sagittal (D) and coronal images (E, F). Effective voxels shown represent actual size with respect to images and are 3.1 cm in diameter (15cc volume).
Table 2 Brodmann areas and Talairach coordinates for regions of interest
| Region | Brodmann | Talairach | ||
|---|---|---|---|---|
| x | y | z | ||
| Anterior cingulate | 32 | 0 | 44 | 2 |
| Posterior cingulate | 23 | 0 | -48 | 26 |
| Left pre-frontal | 10 | -22 | 42 | 2 |
| Right pre-frontal | 10 | 22 | 42 | 2 |
| Left thalamus | -9 | -11 | 5 | |
| Right thalamus | 9 | -11 | 5 | |
| Left parieto-occipital | 39 | -31 | -56 | 26 |
| Right parieto-occipital | 39 | 31 | -56 | 26 |
| Left cerebellum | -20 | -31 | -26 | |
| Right cerebellum | 20 | -61 | -26 | |
| Left hippocampus | -24 | -29 | -12 | |
| Right hippocampus | 24 | -29 | -12 | |
All in vivo spectra were fit in the time-domain using a non-linear, iterative fitting program developed on site. The fitting routine is based on the Marquardt—Levenberg algorithm, utilising prior spectral knowledge for the relative amplitudes, linewidths, lineshapes, peak positions and J-coupling constants to model the in vivo 31P brain spectrum (Reference Potwarka, Drost and WilliamsonPotwarka et al, 1999b ). Since it was positioned along the inner face of the coil, the reference standard was subject to different RF power than the subject and was volume-bound by the x and y tube dimension (1.5 cm diameter), both requiring correction. Therefore, the MDP reference area, fitted with a single Gaussian peak, was corrected for T1-saturation, RF coil sensitivity and volume. Each 31P metabolite area was also T1-corrected, then normalised to the MDP signal and finally corrected by the brain water fraction of 75% to obtain absolute millimolar values per unit brain water (mM/L H2O) for each 31P metabolite. Human in vivo 31P metabolite T1-values at 4.1T for Pi, PCr and ATP of 1.59 secs, 2.39 secs and 0.79 secs were used for the T1-correction (Heatherington et al, 2001). T1-values averaged from the literature at 1.9-2.0T of 2.35 secs and 2.14 secs for the PME and PDE metabolites, respectively, were also used (Boska et al, 1990; Reference Bottomley and OuwerkerkBottomley et al, 1994; Reference Oberhaensli, Galloway and Hilton-JonesOberhaensli et al, 1987). These values agreed closely with our own in vivo T1-values at 4.0 Tesla obtained from a global FID with a 90 degree pulse and TR values ranging from 0.5 to 20 secs. The fitted metabolite amplitudes are not T2-weighted since the fitting algorithm back-extrapolates to time zero. No partial volume corrections were made to any of the derived 31P metabolite concentrations.
Statistics
All statistical calculations used SPSS version 10.0 for Windows. A two-tailed t-test was used to test for significant differences in age, parental education, grey matter, white matter and CSF partial volumes between groups (P <0.05). Statistical treatment of all 10 31P metabolite ratios for each region first involved a one-factor MANCOVA including the covariate of age with a between-subjects factor of group. ANCOVA was used to detect what individual metabolites differed significantly (P<0.05) between groups. In each region where significant group differences in 31P were found, Pearson correlations were computed, within the patient group, between 31P metabolite levels and each of the following variables: SANS and SAPS scores, age, parental education, duration of illness and 31P metabolite levels in all regions where significant group differences in 31P metabolites were found. Significance for the Pearson correlate was set toP<0.01.
RESULTS
No significant differences were found in age, parental education level or handedness between people with medicated chronic schizophrenia and healthy controls (see Table 1). Grey matter partial volume was significantly reduced by 15% in the left hippocampus of the schizophrenia group (P=0.04), compared with the control group. Partial volumes of grey matter, white matter and CSF did not differ significantly in any of the other regions studied. MANCOVA showed a significant difference between groups in the left thalamus (Wilk's lambda=0.249, F=3.016, d.f.=10,10,P=0.048) and a trend was seen in the left hippocampus (Wilk's lambda=0.278, F=2.602, d.f.=10,10, P=0.074). The ANCOVA revealed significant alterations of PME and PDE metabolites in several regions in the schizophrenia group (see Table 3). There were no significant correlations between age, duration of illness, parental education, SANS or SAPS scores and any of the significant phosphorus findings. However, a negative correlation was found in the anterior cingulate cortex between membrane phospholipid (Reference Potwarka, Drost and WilliamsonPotwarka et al, 1999a ) and duration of illness (r=-0.761, d.f.=9, P=0.007) and GPCh correlated negatively with SANS in the right parieto-occipital cortex (r=-0.774, d.f.=9,P=0.005).
Table 3 Significant 31P metabolite differences: people with chronic schizophrenia v. matched control subjects
| Region | Metabolite | Schizophrenia group (mM/L) | Control group (mM/L) | F | d.f. | P |
|---|---|---|---|---|---|---|
| Anterior cingulate | PCh | 0.35 (s.d.=0.25) | 0.88 (s.d.=0.53) | 8.222 | 1,19 | 0.010 |
| GPEth | 0.48 (s.d.=0.22) | 0.80 (s.d.=0.18) | 13.843 | 1,19 | 0.001 | |
| Right pre-frontal | PEth | 0.84 (s.d.=0.23) | 1.15 (s.d.=0.28) | 7.397 | 1,19 | 0.014 |
| GPEth | 0.51 (s.d.=021) | 0.85 (s.d.=0.45) | 4.553 | 1,19 | 0.046 | |
| GPCh | 0.84 (s.d.=0.29) | 1.10 (s.d.=0.20) | 5.468 | 1,19 | 0.030 | |
| Left thalamus | GPEth | 0.27 (s.d.=0.22) | 0.71 (s.d.=0.30) | 14.140 | 1,19 | 0.001 |
| Right parieto-occipital | PCr | 2.55 (s.d.=0.40) | 3.19 (s.d.=0.62) | 7.371 | 1,19 | 0.014 |
| Left cerebellum | GPEth | 0.92 (s.d=0.30) | 0.57 (s.d.=0.40) | 4.962 | 1,19 | 0.038 |
| Left hippocampus | GPEth | 0.74 (s.d.=0.26) | 0.45 (s.d.=0.27) | 6.078 | 1,19 | 0.023 |
| α -ATP | 2.19 (s.d.=0.39) | 2.61 (s.d.=0.47) | 5.050 | 1,19 | 0.037 |
DISCUSSION
The most striking finding of this study is that people with chronic schizophrenia showed membrane phospholipid differences from controls on both sides of the brain in all regions implicated by current models of schizophrenia suggesting that, in at least the later stages of illness, there is not a selective involvement of a particular region or neuronal circuit. GPEth appears to be decreased in the anterior cingulate, right prefrontal cortex and left thalamus but is increased in the left hippocampus and left cerebellum compared to controls. PEth and GPCh were decreased in the right prefrontal region and PCh was decreased in the anterior cingulate cortex. No significant differences in membrane phospholipid levels were seen between groups in the parieto-occipital and posterior cingulate regions as expected. Although some differences would be expected due to chance alone, this is unlikely in most of these regions as the MANCOVA indicated significant differences between groups in the left thalamus with a trend in the left hippocampus.
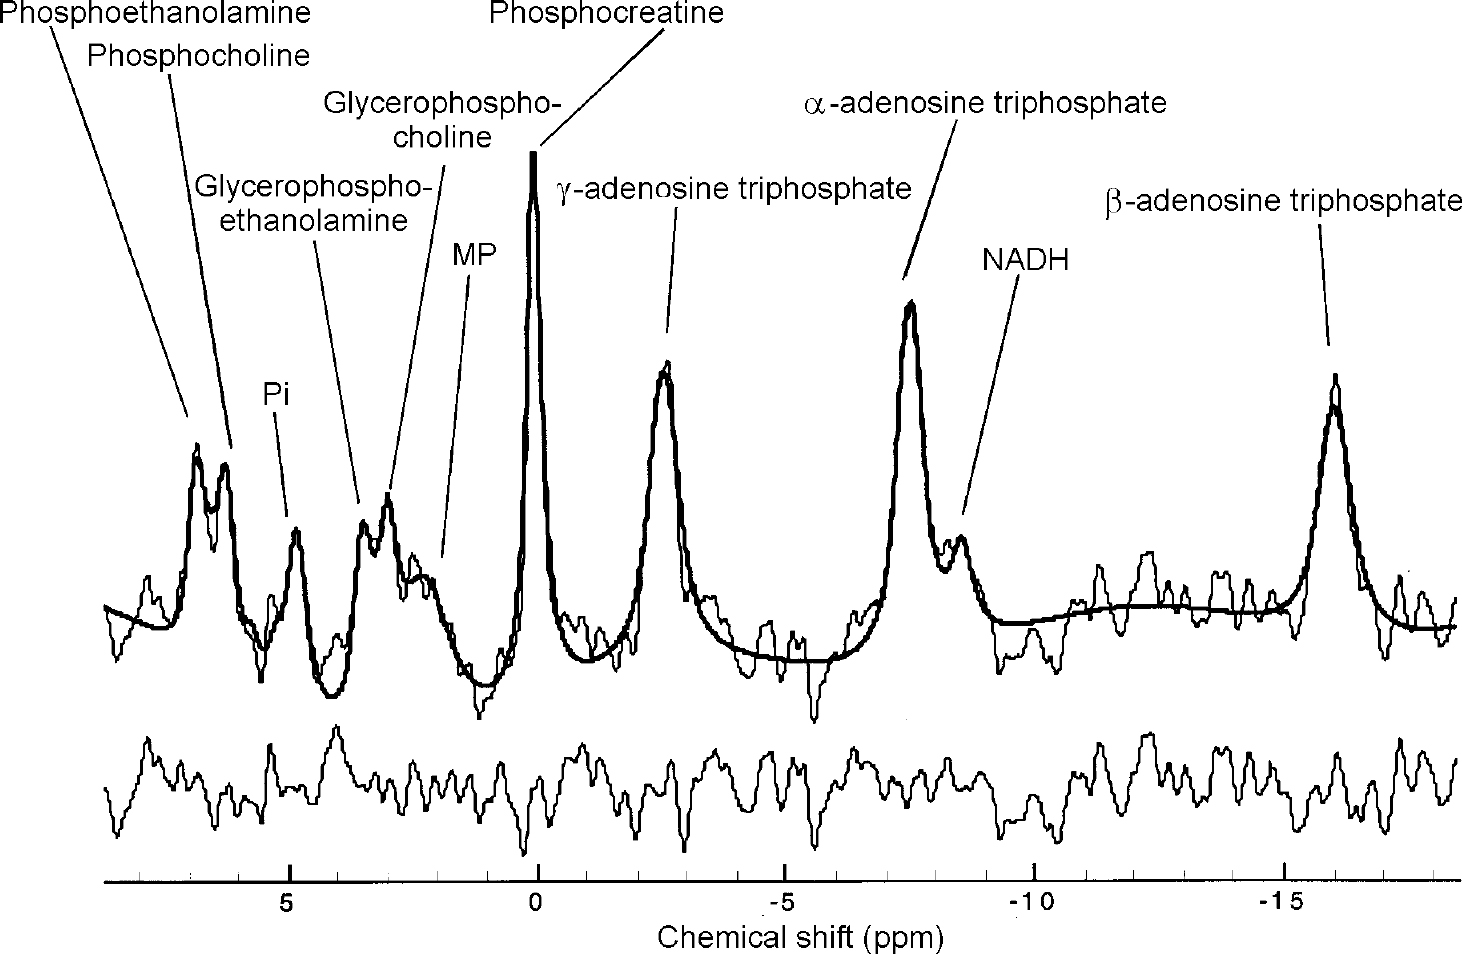
Fig. 2 31P in vivo spectrum from the upper left cerebellum of a healthy control. Raw data are displayed with modelled fit and residual. 15 Hz exponential filtering has been applied for display. Nominal voxel volume is 5.4 cc, effective volume is ∼15 cc.
IMPLICATIONS OF ALTERED PHOSPHODIESTER LEVELS
The PDE metabolites: GPCh and GPEth are both products of phospholipase A1 and A2 activity. Processes that can increase PDE levels in the brain involve decreased phosphodiesterase activity and/or increased phospholipase A1 and A2 activity which have been suggested to play a role in the development of schizophrenia (Reference Horrobin, Glen and VaddadiHorrobin et al, 1994). However, this would not explain the decrease in GPEth in the anterior cingulate, right prefrontal cortex and left thalamus. We have previously observed increased prefrontal PDE in patients with first-episode schizophrenia but not in patients with chronic schizophrenia, suggesting a degenerative process (Reference Stanley, Williamson and DrostStanley et al, 1995). Decreased PDE metabolites in this region in the present study in patients with chronic schizophrenia are consistent with such a process but the finding of increased PDE metabolites in the left hippocampus and left cerebellum could indicate that membrane breakdown continues in these regions long after the onset of the illness. Further studies of patients with first-episode schizophrenia using the present methodology are necessary to support this possibility.
OTHER METABOLITES
Only two significant differences were seen between groups in high-energy phosphates: decreased PCr in the parieto-occipital region and decreased ATP in the left hippocampus in keeping with earlier studies (Reference Williamson, Drost, Glen and HorrobinWilliamson & Drost, 1999). We also did not observe changes in MP which we had found in chronic patients in the medial prefrontal region in a previous study (Reference Potwarka, Drost and WilliamsonPotwarka et al, 1999a ) which might be explained by the much smaller voxel (15 cc v. 60 cc) and a higher field strength which decreases this peak due to chemical shift anisotropy (Reference Kilby, Solas and RaddaKilby et al, 1991). Few correlations were seen between symptoms and 31P-MRS metabolites as also seen in previous studies (Reference Williamson, Drost, Glen and HorrobinWilliamson & Drost, 1999).
Effects of medication
Patients were chronic and on neuroleptic medication. However, two recent 31PMRS studies demonstrated that neuroleptic medications decreased PDE levels in the temporal lobe (Reference Fukuzako, Fukuzako and KodamaFukuzakoet al, 1999) and increased PDE levels in the frontal lobes (Reference Volz, Rossger and RiehemannVolz et al, 1999). As our findings went in the opposite direction in these locations, it is difficult to attribute differences to neuroleptics.
Spectroscopy limitations
Due to the short repetition-time (500 ms) in our acquisition, the resulting 31P spectra are T1-weighted. The observed changes in metabolite levels in schizophrenia may therefore partially result from differing T1-values in the affected regions, and may not be purely due to concentration differences. However, based on literature T1 values, T1 values in people with schizophrenia would have to change considerably, up to 400%, in order to equalise the metabolite ratios between groups. This is unlikely and there is no evidence to date suggesting that brain phosphorus metabolite T1 values are altered in schizophrenia. Our 15 cc voxels are the smallest used in a schizophrenia 31P-MRS study to date, but this volume is still large resulting in considerable contribution from adjacent tissue in the hippocampus, the anterior cingulate and the thalamus. The fall off in the 31P RF coil B1-sensitivity prevented ideal positioning of a 15 cc volume in the cerebellum, resulting in partial contribution of the spectra from the occipital lobes (see Fig. 1). However, the nearby voxels entirely within the parieto-occipital region showed no phospholipid changes, rendering it unlikely that our reported change in GPEth in the left cerebellum is from the occipital region.
Partial-volume limitations
People with schizophrenia have been shown to possess less cortical grey matter and more CSF than controls (Reference Zipursky, Lim and SullivanZipursky et al, 1992). A partial-volume correction was therefore applied to all brain regions showing significant changes in 31P metabolites, using literature estimates for 31P metabolite concentration differences between tissue-type (Reference Buchli, Duc and MartinBuchli et al, 1994; Reference Hetherington, Spencer and VaughanHetherington et al, 2001).
Partial volumes of grey matter, white matter and CSF in the anterior cingulate, left thalamus, right parieto-occipital cortex and right prefrontal cortex differed by only 2-5% between the groups, which was not significant. The effect of these small volume differences on the 31P metabolite concentrations is very slight and does not explain the observed group differences in the 31P metabolites in any of these regions. The 15% reduction in grey matter in the left hippocampus of the schizophrenia group, as well as 13% more white matter in this region, explain only about 4% of the observed 64% increase in GPEth in this group, based on 40% greater PDE levels in white matter (Reference Buchli, Duc and MartinBuchli et al, 1994). Although not found to be significant, the 15% increase in grey matter partial volume, as well as the 7% reduction in white matter and 8% reduction in CSF partial volumes, in the left cerebellum in schizophrenia patients cannot account for the observed 60% increase in GPEth in this region.
Clinical Implications and Limitations
CLINICAL IMPLICATIONS
-
• Membrane phospholipid abnormalities can be demonstrated in all regions implicated in schizophrenia suggesting that there is not a selective involvement of a particular region.
-
• Findings could be consistent with a degenerative process in schizophrenia.
-
• Such widespread changes in membrane metabolism are in keeping with the cognitive deficits seen in these patients.
LIMITATIONS
-
• Results may not be generalisable to other patient groups, owing to the small sample size.
-
• Some differences between groups may be related to the effects of medications.
-
• Only patients with chronic schizophrenia were studied.


eLetters
No eLetters have been published for this article.