


1. Introduction
The rapid evolution of the Ediacaran biota and subsequent explosion and diversification of animals in the Ediacaran-early Cambrian is thought to have been driven by one of the most significant oxygenation events of the earth’s history, commonly known as the Neoproterozoic Oxidation Event (NOE) (Xiao & Laflamme, Reference Xiao and Laflamme2009; Erwin et al. Reference Erwin, Laflamme, Tweedt, Sperling, Pisani and Peterson2011; Knoll, Reference Knoll2011; Lenton et al. Reference Lenton, Boyle, Poulton, Shields-Zhou and Butterfield2014). During the NOE, atmospheric oxygen concentration reached above 40% of the present atmospheric level and probably, for the first time, oxidized the deep oceanic floor (Canfield et al. Reference Canfield, Poulton and Narbonne2007; Sahoo et al. Reference Sahoo, Planavsky, Kendall, Wang, Shi, Scott, Anbar, Lyons and Jiang2012). This rise in oxygen level would have assisted the animal evolution, by developing more efficient metabolic machinery (Jiang et al. Reference Jiang, Kong, Qin, Li, Caetano-Anolles and Zhang2012), increasing the bioavailability of critical trace metals (Anbar & Knoll, Reference Anbar and Knoll2002) and macronutrients. However, more recent studies have suggested that deep-water oxygenations between NOE and early Cambrian were transient, and deep-water column stayed anoxic to ferruginous for most of this interval, probably due to high surface primary productivity and associated dissolved oxygen consumption during organic matter remineralization (Li et al. Reference Li, Planavsky, Shi, Zhang, Zhou, Cheng, Tarhan, Luo and Xie2015; Sahoo et al. Reference Sahoo, Planavsky, Jiang, Kendall, Owens, Wang, Shi, Anbar and Lyons2016; Jin et al. Reference Jin, Li, Algeo, Planavsky, Cui, Yang, Zhao, Zhang and Xie2016; Sperling et al. Reference Sperling, Knoll and Girguis2015). This theory of a drastic increase in primary productivity is supported by the rise in the abundance of phosphorites and phosphorus content in the geological records (Reinhard et al. Reference Reinhard, Planavsky, Gill, Ozaki, Robbins, Lyons, Fischer, Wang, Cole and Konhauser2017). However, for this period, oceanic primary productivity and its control (e.g., nutrient supply from terrestrial weathering or/and upwelling) remain poorly constrained (Xiang et al. Reference Xiang, Schoepfer, Zhang, Cao and Shen2018).
Redox shifts in oceanic bottom waters and sedimentary pore waters are often coupled with the change of the biological pump strength, a process through which inorganic dissolved carbon is fixed as organic matter by phytoplankton in the upper oceanic water column and subsequently exported to the deep ocean (Meyer et al. Reference Meyer, Ridgwell and Payne2016). During this exportation, a significant fraction of organic matter is remineralized back to CO2 by heterotrophs first consuming dissolved oxygen and thereafter other oxidants such as nitrate, manganese, iron and sulphate (Wyrtki, Reference Wyrtki1962). Thus, the degree of oxygen removal from the water column largely depends upon the strength of the biological pump or organic matter transfer into the water column. This process of dissolved oxygen removal from the water column directly/indirectly plays a key role in the accumulation of redox-sensitive trace elements (RSTEs) in underlying sediments. It makes some of the biologically important RSTEs (Cd, Zn, Mo) a suitable proxy for understanding past export production (Wagner et al. Reference Wagner, Hendy, McKay and Pedersen2013). Nevertheless, it is important to note that the remobilization of RSTEs during diagenetic processes can alter the sediment composition, rendering it challenging to use RSTEs for export production estimation. Besides, most of the available Proterozoic geological records are of shallow depositional origin that could have received detrital inputs from local specific mineral assemblages enriched or depleted in specific trace metals. This risk is minimal for elements that are low in crustal rocks but highly incorporated in biogenic particles (Brumsack, Reference Brumsack2006). Cadmium (Cd) is one such RSTEs, the crustal abundance of which is very low but extensively accumulated in marine phytoplankton biomass (Rosenthal et al. Reference Rosenthal, Lam, Boyle and Thomson1995; Ho et al. Reference Ho, Quigg, Finkel, Milligan, Wyman, Falkowski and Morel2003; Morel & Malcolm, 2005; Böning et al. Reference Böning, Cuypers, Grunwald, Schnetger and Brumsack2005; Twining & Baines, Reference Twining and Baines2013; Bryan et al. Reference Bryan, Dickson, Dowdall, Homoky, Porcelli and Henderson2021). For example, Cd concentration in marine phytoplankton can reach up to more than two orders of magnitude compared to crustal abundance (Brumsack, Reference Brumsack2006; Wagner et al. Reference Wagner, Hendy, McKay and Pedersen2013).
Cadmium in the marine water column exhibits a nutrient-like profile, especially similar to dissolved inorganic phosphate, and it is effectively utilized by phytoplankton in the upper water column and released in the deeper water column during organic matter remineralization (Boyle et al. Reference Boyle, Sclater and Edmond1976; Cullen, Reference Cullen2006; Hendry et al. Reference Hendry, Rickaby, de Hoog, Weston and Rehkämper2008). Though the role of phosphate as a bio-essential nutrient is well known, the role of Cd is still not properly understood. A few studies have reported Cd-based carbonic anhydrase enzyme, which plays a role in converting bicarbonate to carbon dioxide in photosynthetic CO2 fixation (Lane et al. Reference Lane, Saito, George, Pickering, Prince and Morel2005; Xu et al. Reference Xu, Feng, Jeffrey, Shi and Morel2008). Furthermore, Cd assimilation in certain phytoplankton is higher under Zn/Fe-limited oceanic conditions (Cullen, Reference Cullen2006; Löscher et al. Reference Löscher, De Jong and De Baar1998; Price & Morel, Reference Price and Morel1990). The remarkable similarity of Cd distribution with the inorganic phosphate and organic carbon in modern Oceans has been proven useful in effectively reconstructing the palaeonutrient and palaeoproductivity from Cd concentration in clastic sediments (Brumsack, Reference Brumsack2006; Wagner et al. Reference Wagner, Hendy, McKay and Pedersen2013). More recently, novel Cd isotope studies on the Mesoproterozoic (Viehmann et al. Reference Viehmann, Hohl, Kraemer, Bau, Walde, Galer, Jiang and Meister2019), Neoproterozoic to Cambrian (Hohl et al. Reference Hohl, Galer, Gamper and Becker2017, Reference Hohl, Jiang, Wei, Pi, Liu, Viehmann and Galer2019, Reference Hohl, Jiang, Viehmann, Wei, Liu, Wei and Galer2020; John et al. Reference John, Kunzmann, Townsend and Rosenberg2017) and Permian (Georgiev et al. Reference Georgiev, Horner, Stein, Hannah, Bingen and Rehkämper2015) sedimentary rock records demonstrated that Cd is closely associated with biogenic organic matter and sulphide. Thus, to develop a better understanding of the late Neoproterozoic palaeoproductivity and their controlling factors, this study investigated a section of the Ediacaran Sirbu Shale of the Vindhyan Supergroup, India, for trace elements and organic carbon isotopes analysis with special emphasis on the use of authigenic Cd as a palaeoproductivity proxy.
2. Geological background and age
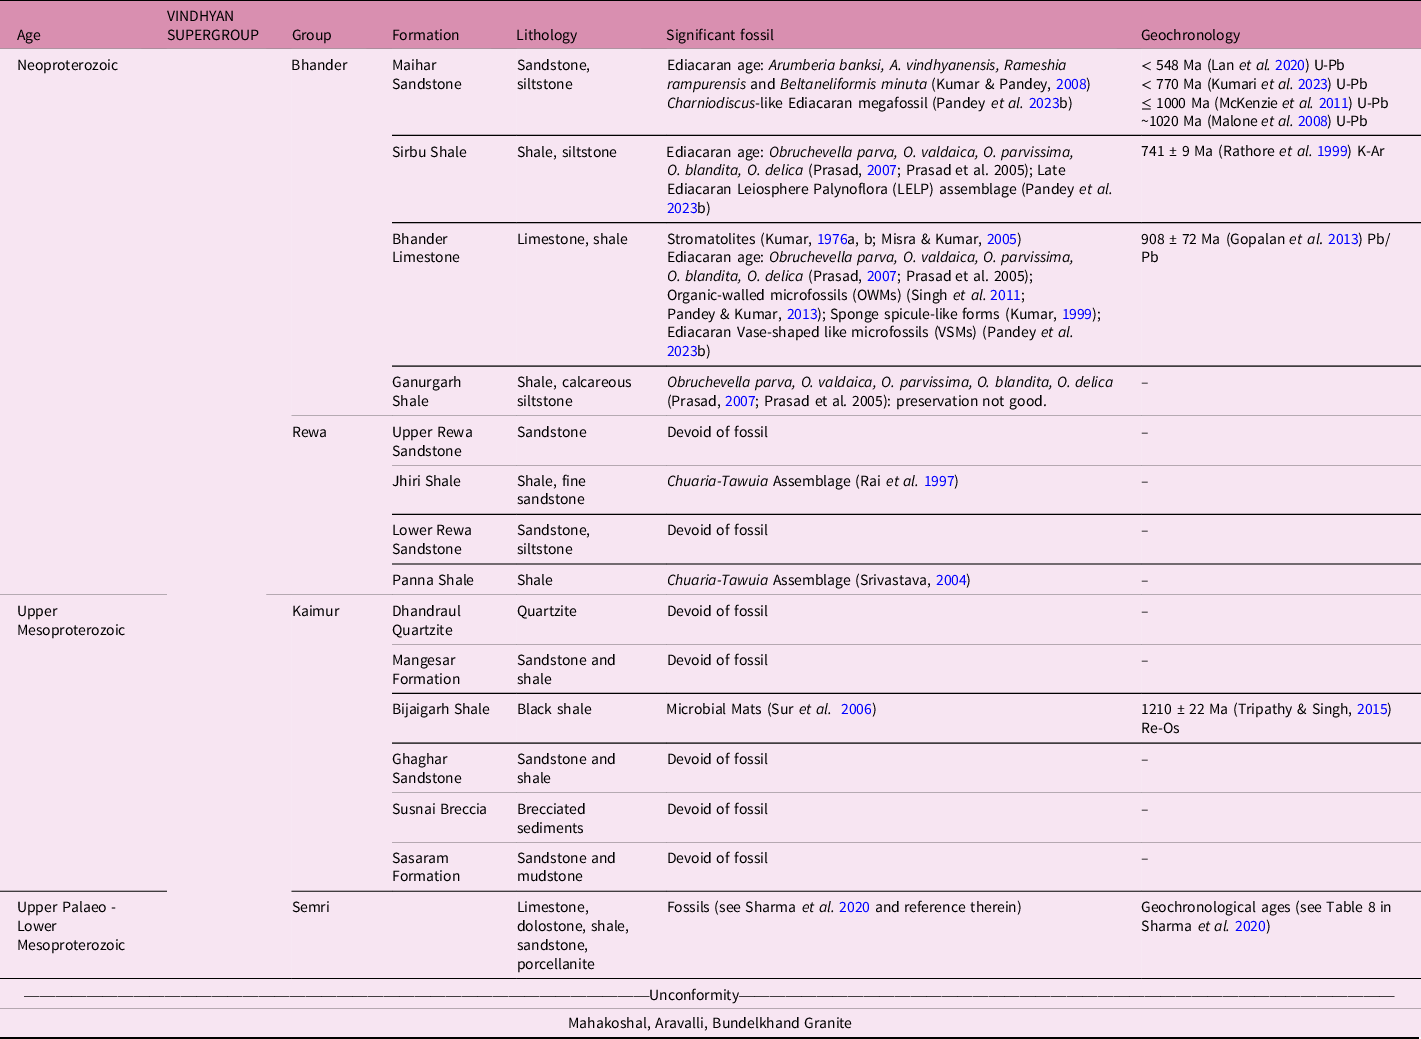
The Vindhyan Supergroup (VSG) is one of the largest well-exposed intracratonic basins (Figure 1), occupying an area of about 1,66,400 km2 in central and western India, with 40,000 km2 under the subsurface profile of Deccan Trap and approximately 10,000 km2 under the Gangetic alluvium (Srivastava et al. Reference Srivastava, Rana, Verma, Bhandari, Venkatachala, Kumar, Swamy, Garga and Srivastava1983; Mathur, Reference Mathur1987; Jokhan Ram et al. Reference Jokhan Ram, Pramanik, Verma, Chandra and Murthy1996; Sharma et al. Reference Sharma, Pandey and Kumar2020). In terms of thickness, age and depositional environment, the VSG is coeval to the other Proterozoic cratonic basins found in other parts of the world, such as America, Siberia, China and Australia (Preiss & Forbes, Reference Preiss and Forbes1981; Deb, Reference Deb2004; Wani & Mondal, Reference Wani and Mondal2011; Mahon et al. Reference Mahon, Dehler, Link, Karlstrom and Gehrels2014; Rogov et al. Reference Rogov, Karlova, Marusin, Kochnev, Nagovitsin and Grazhdankin2015; Cawood et al. Reference Cawood, Zhao, Yao, Wang, Xu and Wang2018; Rooney et al. 2018; Gladkochub et al. Reference Gladkochub, Donskaya, Stanevich, Pisarevsky, Zhang, Motova, Mazukabzov and Li2019). The basin unconformably rests on the top of the Bundelkhand massif (in the west and central parts) and the Bijawar Group of rocks (in the eastern part), which has been considerably metamorphosed (Crawford & Compston, Reference Crawford and Compston1969; Mondal et al. Reference Mondal, Goswami, Deomurari and Sharma2002). VSG is constituted of largely unmetamorphosed/undeformed rocks (Soni et al. Reference Soni, Chakraborty and Jain1987) and is exposed in two geographical locations: in central India (known as the Son Valley) and in western India (known as the Chambal Valley). The maximum cumulative thickness of the basin is around 5000 metres, composed of mainly sandstone, shale, limestone and, to a lesser extent, mudstone, siltstone, porcellanite and ash beds (Bhattacharyya, Reference Bhattacharyya1993, Reference Bhattacharyya1996). It is broadly divided into lower and upper Vindhyans. The entire succession is lithostratigraphically divided into four groups, viz. the Semri, the Kaimur, the Rewa and the Bhander, in ascending order (Table 1). The Bhander Group, the youngest unit (Krishnan, Reference Krishnan1968; Sastry & Moitra, Reference Sastry and Moitra1984), is composed of shale-carbonate-shale-sandstone litho-package and subdivided into four formations: the Ganurgarh Shale, the Bhander Limestone, the Sirbu Shale and the Maihar Sandstone (Table 1).

Fig. 1. Geological map of the Vindhyan Basin (after Krishnan & Swaminath, Reference Krishnan and Swaminath1959) in and around Maihar area, Satna district. Star represents the sampling location of the Dudhiya Nala, North of Sharda Devi Temple, Maihar township.
Table 1. Lithostratigraphy of the Vindhyan Supergroup (modified after Sastry & Moitra, Reference Sastry and Moitra1984; Kumar & Sharma, Reference Kumar and Sharma2012; Sharma et al. Reference Sharma, Pandey and Kumar2020)
The Ganurgarh Shale is an older unit of the Bhander Group characterized by maroon colour fine-grained calcareous silty shale. A few outcrop exposures are available around Rewa and Maihar area, Madhya Pradesh. The presence of salt pseudomorph and gypsum suggests that the Ganurgarh Shale was deposited in the upper intertidal to supratidal depositional setting (Singh, Reference Singh1976; Sarkar et al. Reference Sarkar, Chakraborty, Banerjee, Bose, Alterman and Corcoran2002). The overlying unit, the Bhander Limestone, is exposed in the low-lying areas or mine or quarry sections in the Satna district. It is composed of dark grey-coloured carbonate with subordinate green to buff-coloured shale. Stromatolites are preserved as bioherms and biostromes in the Satna-Maihar area (Kumar, Reference Kumar1976a, b; Misra and Kumar, Reference Misra and Kumar2005, Pandey, Reference Pandey2012). Flaser and lenticular bedding, intraformational conglomerate, small-scale-cross bedding, fractured microbial layers, ripples and mud cracks are some of the sedimentary structures profusely developed within the carbonate units. The lowest part of this carbonate unit was deposited in moderate energy, subtidal to lower intertidal depositional setting. In contrast, the middle to upper part was deposited in an intertidal to supratidal depositional setting (Singh, Reference Singh1976).
The Sirbu Shale is well exposed in hillock sections in and around the Maihar area with overlying Maihar Sandstone and underlying Bhander Limestone (Figure 1, 2) and composed of light yellow-buff, grey to greyish green shale and siltstone interbedded with grey to brownish grey mudstone siltstone and sandstone suitable facies for fossil preservation. The estimated thickness of the Sirbu Shale is 100–250 m (Sastry & Moitra, Reference Sastry and Moitra1984). Based on the sedimentological variations, Singh (Reference Singh1976) divided it into three litho-units: litho-unit A, B and C in ascending order and inferred to be deposited in a lagoon with oxidizing milieu, hypersaline and storm-dominated palaeoenvironment. Sarkar et al. (Reference Sarkar, Chakraborty, Banerjee, Bose, Alterman and Corcoran2002) inferred it to be deposited in storm-dominated shelf and lagoonal palaeoenvironment. A recent study by Singh and Chakraborty (Reference Singh and Chakraborty2022) suggested that the Sirbu Shale is deposited within the storm-dominated outer to inner shelf towards the top based on the physical evidence. In the present study, the classification given by Singh (Reference Singh1976) is being followed for the ease of understanding the different litho-units. Litho-unit A is composed of dark brown to maroon-coloured sand-siltstone with occasional layers of green-coloured shale. Various types of shallow water ripple marks are well exposed, along with intermittent sub-areal exposure. It was deposited in the protected mudflat to the lagoonal hypersaline environment as indicated by the presence of salt-pseudomorphs. It is not exposed in the studied section of Dudhiya nala. Litho-unit B is characterized by the papery thin green, dark grey to black coloured shale (Figure 2(a), (c)) with intercalations of centimetric thin sandy layers (Figure 2(a), (c)) at about 1-metre intervals. Fresh cuttings are typically dark grey in colour, but when exposed to light, they turn brown. Gutter cast, hummocky cross-stratification and load cast are common sedimentary structures between the shaley layers of this unit, suggesting storm-dominated events within the depositional realm (Figure 2(a), (d)). Thus, this unit is inferred to be deposited above the storm wave base or in storm-dominated shelf palaeoenvironment (Singh, Reference Singh1976; Sarkar et al. Reference Sarkar, Chakraborty, Banerjee, Bose, Alterman and Corcoran2002). Litho-unit C comprises decimetre thick sandy layers interbedded with reddish-brown shale, but in fresh cut, light green in the middle and light grey at the top (Figure 2(a), (e), (f)).

Fig. 2. (a) Detailed litholog of the Sirbu Shale exposed in Dudhiya Nala Section; (b) Dudhiya Nala section, where thin layers of black to grey-coloured shale/mudstone/sandy unit of the Sirbu Shale is exposed (see yellow arrow); (c) Litho-unit B of the Sirbu Shale: papery thin green, dark grey to black coloured shale with intercalations of centimetric thin sandy layers; (d) lensoid sandy gutter cast (yellow dotted line) indicates small events of storms within Litho-unit B; (e), (f) partly sandy and light grey to green colour shale in the middle and buff colour at the top.
Both the litho-units B and C are quite different in terms of grain texture, lithology, colour and deposition environment. Litho-unit B is papery thin with the lower part dark grey to grey and the upper part light green in colour. Litho-unit C is light grey in the lower part and light grey at the top (Figure 2(f)) composed of coarse and thickly bedded shale with intercalation of centimetre size sandy layer (Sarkar et al. Reference Sarkar, Chakraborty, Banerjee, Bose, Alterman and Corcoran2002). The litho-unit B is dominated by the gutter cast, whereas in litho-unit C, its presence is rare. The change from litho-unit B to C symbolises a shift in depositional setting from a relatively deeper shelf to a relatively shallower shelf environment (Sarkar et al. Reference Sarkar, Chakraborty, Banerjee, Bose, Alterman and Corcoran2002).
The Maihar Sandstone, characterized by heterolithic stratification of sandstone and siltstone, has a gradational contact with the underlying Sirbu Shale and is best exposed in Maihar township. Cross stratifications, flaser, lenticular bedding, desiccation cracks, penecontemporaneous deformational structures, wave, current ripples and many other sedimentary structures are well preserved within the Maihar Sandstone. The Maihar Sandstone is deposited in the tidal flat–shoal complex depositional environment (Singh, Reference Singh1976).
The Ganurgarh Shale represents the base of the Bhander Group. Prasad et al. (Reference Prasad, Uniyal and Asher2005) and Prasad (Reference Prasad2007) recovered organic-walled microfossil assemblages from subsurface profile (core) and outcrop sections and suggested the late Cryogenian to early Vendian age. From the overlying Bhander Limestone, Kumar (Reference Kumar1999) reported sponge spicule-like structure, and Singh et al. (Reference Singh, Babu and Shukla2011) and Pandey & Kumar (Reference Pandey and Kumar2013) reported microfossils assemblage from the associated black bedded chert and suggested Ediacaran age. Columnar stromatolites and carbonaceous megafossils were reported from the Bhander Limestone (Valdiya, Reference Valdiya1969; Kumar, Reference Kumar1976a, b; Kumar & Srivastava, Reference Kumar and Srivastava1997, Reference Kumar and Srivastava2003; Misra & Kumar, Reference Misra and Kumar2005; Singh et al. Reference Singh, Babu and Shukla2009; Sharma et al. Reference Sharma, Mishra, Dutta, Banerjee and Shukla2009, Pandey, Reference Pandey2012). Pandey et al. (Reference Pandey, Singh, Sharma, Ahmad and Bhan2023b) described large-sized Ediacaran Vase-shaped microfossils (VSMs) from the Bhander Limestone. The Bhander Limestone is overlain by the Sirbu Shale, from where Kumar & Srivastava (Reference Kumar and Srivastava2003) have described Chuaria-Tawuia and other carbonaceous assemblage and suggested the upper Riphean and Vendian age of the Bhander Group. A variety of the Ediacaran-type megafossils were reported from the different shale units of the Sirbu Shale (De, Reference De2003, Reference De2006, Reference De2009), yet their biogenicity is not proven. Recently, Pandey et al. (Reference Pandey, Singh, Sharma, Ahmad and Bhan2023b) described Ediacaran ‘Late Ediacaran Leiosphere Palynoflora’ (LELP) assemblage and other associated organic-walled microfossils from the Sirbu Shale. The Ediacaran fossils, such as Arumberia banksi (Vendobionta), A. vindhyanensis, Rameshia rampurensis, Beltaneliformis minuta, Dickinsonia tenuis (?) and Charniodiscus-like Ediacaran megafossil have been reported and discussed from the Maihar Sandstone and considered to be deposited within the late Ediacaran Period (Kumar & Pandey, Reference Kumar and Pandey2008, Pandey, Reference Pandey2012; Retallack et al. Reference Retallack, Matthews, Master, Khangar and Khan2021; Pandey et al. Reference Pandey, Singh, Sharma, Ahmad and Bhan2023b). However, Dickinsonia tenuis has been challenged by Pandey et al. (Reference Pandey, Ahmad and Sharma2023a) and Meert et al. (Reference Meert, Pandit, Kwafo and Singha2023) and proven to be a pseudofossil.
Stable carbon isotope studies on the Bhander Limestone and carbonate lenses of the Sirbu Shale suggested a probable Precambrian-Cambrian boundary between the Bhander Limestone and the Sirbu Shale (Friedman et al. Reference Friedman, Chakraborty and Kolkas1996; Friedman & Chakraborty, Reference Friedman and Chakraborty1997) though only few samples have been analyzed. Stable carbon and strontium isotope analyses of the Bhander Limestone by Ray et al. (Reference Ray, Martin, Veizer and Bowring2002, 2003); Kumar et al. (2002); and Kumar et al. (2005) suggested Tonian to Cryogenian (∼750-650 Ma) age. Rathore et al. (Reference Rathore, Vijan, Krishna, Prabhu and Mishra1999) dated glauconites occurring in the lowest part of the Sirbu Shale by the K-Ar method and gave 741 ± 9 Ma age for deposition of the Sirbu Shale. Recently, Lan et al. (Reference Lan, Zhang, Li, Pandey, Sharma, Shukla, Ahmad, Sarkar and Zhai2020) dated the topmost unit of the Maihar Sandstone by the U-Pb method, and based on the youngest zircon dataset, the maximum depositional age was estimated as 548 Ma. Lan et al. (Reference Lan, Zhang, Li, Pandey, Sharma, Shukla, Ahmad, Sarkar and Zhai2020) dataset matches the overall fossil assemblage recovered from the Maihar Sandstone. Recent and previous reports of the Ediacaran elements (fossils and radiometric ages) from the Maihar Sandstone (Kumar & Pandey, Reference Kumar and Pandey2008; McKenzie et al. Reference McKenzie, Hughes, Myrow, Xiao and Sharma2011; Lan et al. Reference Lan, Zhang, Li, Pandey, Sharma, Shukla, Ahmad, Sarkar and Zhai2020; Retallack et al. Reference Retallack, Matthews, Master, Khangar and Khan2021; Pandey et al. Reference Pandey, Singh, Sharma, Ahmad and Bhan2023b) stress the plausible Ediacaran age of the Sirbu Shale.
3. Materials and methods
This study was performed on the uppermost succession of litho-units B and C, which is best exposed (about 16 m) in the Dudhiya Nala section, North of Sharda Devi temple on Maihar to Rampur Road (Figure 2(a), (b)). For the geochemical investigation, 48 samples were systematically collected (24º16’32.00” N; 80º43’10.00” E) (Figure 1, 2). Each sample’s surface was discarded, and the remainder part was washed thrice with Milli-Q water and dried at 60°C in the oven. Samples were powdered for the geochemical analysis. Entire preprocessing was performed at the Birbal Sahni Institute of Palaeosciences (BSIP), Lucknow.
Thirty mg powder of each sample was digested in the two-step process for trace element analyses (Xiong et al. Reference Xiong, Li, Algeo, Chang, Yin and Xu2012; Ansari et al. Reference Ansari, Ahmad, Govil, Agrawal and Mathews2020, Reference Ansari, Singh, Sharma and Kumar2022). In the first step, the powdered sample was transferred into a Teflon tube and added with a 5 mL mixture of hydrofluoric and nitric acid in a 2:1 ratio followed by 1 mL perchloric acid. Subsequently, the tube was tightly closed with a cap and heated at 120°C for 7 hours in a Q-block operating system. Later, the Teflon tube was opened to allow the evaporation until it dried completely. In the second step, a 5 mL mixture of hydrofluoric acid and nitric acid in a 1:2 ratio followed by 1 mL of perchloric acid was added into the Teflon tube, then heated and dried as in the first step. After the second step, 2 mL of 5% HNO3 was added, and the clarity of the solution was checked. If any part of the powdered sample was still left, the two-step process was repeated until complete digestion. The digested sample was diluted in 2% HNO3 to a final volume of 50 mL and kept at 4°C before analysis. Similarly, the digested liquid was prepared from United States Geological Survey (USGS) standard rock powders of Cody Shale (SCo-1), Green River Shale (SGR-1b), and blanks. Repeats of some samples were run for quality control. The analytical error was less than 5%.
The δ13C-org and TOC analysis was carried out following the method described by Ansari et al. (Reference Ansari, Pandey, Sharma, Agrawal and Kumar2018). The powdered sample was first treated with 5% HCl to remove traces of carbonates. The treated sample was washed with Milli-Q water and then dried at 60°C in the oven. The dried sample was again crushed to powder, weighted and enclosed in a tin capsule, which was inserted into a prefilled, conditioned reactor of the Elemental Analyser (Flash EA 2000 HT) by the integrated autosampler. For isotopic analysis, the CO2 released from the combustion of the sample in EA was transferred to the Isotope Ratio Mass Spectrometer (IRMS MAT 253) coupled with the Con-Flow IV interface. To check the accuracy of isotopic measurements, international standards: IAEA-CH3 and IAEA-CH6, internal standards: Sulfanilamide and a few repeat samples were repeatedly analyzed at the interval of ten samples. TOC was measured from the peak area of CO2 chromatogram from mass spectrometer (Agrawal et al. Reference Agrawal, Srivastava, Sonam Meena, Rai, Bhushan, Misra and Gupta2015).
For quantitative elemental analyses, a wavelength Dispersive X-Ray Fluorescence (WD-XRF) Spectrometer (Model: PANalytical, axios max, 4 KW) was used. Samples were ground into powder using an agate mortar and pestle (up to around 300 mesh of ASTM standard). The powdered specimens were then moulded into pressed pellets in a ratio of 6:4 (sample: binder) using boric acid as a binder, following the method described by Takahashi (Reference Takahashi2015). The individual samples were examined using the international standards and a Super Q application with an accuracy of ≤5%. All these analyses were performed at the Sophisticated Analytical Instrument Facilities (SAIF) of the BSIP. Repeat analyses showed a precision of ±0.1%. Loss on ignition (LOI), which reflects the volatile content in the samples, was measured by heating the 5 g of the sample at 950°C for 6 hours in a muffle furnace and subtracting the final weight of the sample from 5 g (weight before heating).
3.1. Calculation of enrichment factors for elements
To understand the relative enrichments of trace elements in the bulk samples of Sirbu Shale against the average composition of upper continental crust (UCC) (Rudnick & Gao, Reference Rudnick, Gao and Rudnick2003), the enrichment factor (EF) for trace element is calculated using following Eq. 1.
 $$\rm{{X_{EF}} = {\rm{ }}{\left( {X/Al} \right)_{sample}}/{\left( {X/Al} \right)_{UCC}}}$$
X and EF in Eq.1 represent trace element and enrichment factors, respectively. ‘Al’ represents element aluminium. (X/Al)Sample and (X/Al)UCC denote the ratio in the bulk samples of Sirbu Shale and the ratio for the average composition of UCC. Al in Eq. 1-4 is used as a tracer for calculating the detrital fraction of trace elements. An example of enrichment factor calculation is provided in the Supplementary Material (after supplementary Table 2).
3.2. Calculation of TOCbm and TOCloss
Studies of the Cd content in surface marine sediments and phytoplankton of modern ocean (Rosenthal et al. Reference Rosenthal, Lam, Boyle and Thomson1995; Ho et al. Reference Ho, Quigg, Finkel, Milligan, Wyman, Falkowski and Morel2003; Morel & Malcolm et al. 2005; Böning et al. Reference Böning, Cuypers, Grunwald, Schnetger and Brumsack2005; Twining & Baines, Reference Twining and Baines2013; Bryan et al. Reference Bryan, Dickson, Dowdall, Homoky, Porcelli and Henderson2021) have demonstrated that Cd is strongly correlated with organic content and 1% of TOC generally contributes 0.186 to 0.372 μg of biogenic (non-detrital) Cd in modern marine sediments. This quantitative relation between TOC and non-detrital Cd thus can be used in estimating the possible range of TOC content in marine sediment records. Assuming that the quantitative transfer of non-detrital Cd to sediments in non-euxinic set-up of ancient ocean was also mainly driven by organic matter transport and in the similar ratio as in the modern ocean, we propose an equation (Eq.4) for the tentative estimation of total organic carbon originally exported to the concomitant sediment [i.e., TOC content in sediment before remineralization (TOCbm) by early diagenetic activities] of ancient marine set-up.
 $$\rm{C{d_{non - detrital}} = {\rm{ }}C{d_{sample}}-{\rm{ }}C{d_{detrital}}}$$
 $$\rm{C{d_{detrital}} = {\rm{ }}\left( {C{d_{UCC}}/A{l_{UCC}}} \right)^*A{l_{sample}}}$$
 $$\rm{TO{C_{bm}}\left( \% \right){\rm{ }} = {\rm{ }}\left[ {C{d_{sample}} - {\rm{ }}\left( {C{d_{UCC}}/A{l_{UCC}}} \right)^*A{l_{sample}}} \right]/CF}$$
In Eq. 4, CF is a conversion factor representing the quantitative relation between TOC and non-detrital Cd contributed in modern marine sediments that range from 0.186 to 0.372 (Rosenthal et al. Reference Rosenthal, Lam, Boyle and Thomson1995; Ho et al. Reference Ho, Quigg, Finkel, Milligan, Wyman, Falkowski and Morel2003; Morel & Malcolm et al. 2005; Böning et al. Reference Böning, Cuypers, Grunwald, Schnetger and Brumsack2005; Twining & Baines, Reference Twining and Baines2013; Bryan et al. Reference Bryan, Dickson, Dowdall, Homoky, Porcelli and Henderson2021). TOCbm denotes the estimated gross organic matter export, i.e., TOC before loss through remineralization at the sediment-water interface or during early diagenesis. The remineralization loss of organic carbon (TOCloss) is calculated by subtracting the TOC measured in the bulk sample from TOCbm calculated for the respective sample (see Eq. 5).
 $$\rm{TO{C_{loss}}\left( \% \right){\rm{ }} = {\rm{ }}TO{C_{bm}}-{\rm{ }}TOC{\rm{ }}\left( {bulk} \right)}$$
4. Results
A total of 48 shale samples collected from the Sirbu Shale were analyzed for trace metals, TOC, and bulk organic carbon isotope. However, 46 samples were analyzed for the major oxides and LOI as two samples (BH-29 and BH-35) were completely consumed and were unavailable for these analyses. Data have been provided in Tables 2a and 3, and supplementary Tables 1, 2 and 3. The correlation matrix among the enrichment factors of trace elements, total phosphorus (P) enrichment, Al, TOC, δ¹3C-organic, and LOI are given in Table 2b. The results show that only Cd is significantly enriched in the samples. The calculated enrichment factor using Eq.1 against the UCC values (Rudnick & Gao, Reference Rudnick, Gao and Rudnick2003) for Cd in the litho-unit B (BH-1 to BH-24) varies between 7.1 and 28.5, and in the litho-unit C (BH-25 to BH-48) varies between 4.7 and 8.5 (Figure 3 and Supplementary Table 2). Enrichment of total P in litho-unit B varies between 1.6 and 3.2, and in the litho-unit C varies between 1.4 and 2.2. V and Cr enrichment factors in the sampled stratigraphic section show no significant change and stay consistent < 1 (Figure 3). Enrichment factor for Co and Mo in the litho-unit C and upper part of the litho-unit B does not show major changes and value mostly falls close to one, but the lower part of litho-unit B shows relatively significant enrichment (2–3 times) compared to UCC (Figure 3). Enrichment factor for U in litho-unit C and upper part of litho-unit B demonstrates a value consistently close to two and show a small stable rise up to a value around three in the lower part of litho-unit B (Figure 3). Total organic carbon and δ¹³C-org in the samples range from 0.06 to 0.26 weight% and from −22 to −26 ‰ respectively (Table 2a). The CdEF shows a weak but statistically significant (Pearson coefficient correlation < 0.05) negative correlation with δ¹³C-org and Al (Figure 4(c), (e) and Table 2b) and a statistically significant weak to moderate positive correlation with CoEF, PEF and Mn/Al (Figure 4(d) and Figure 5(a), (b)). The δ¹³C-org shows a weak but statistically significant positive correlation with TOC and LOI (Figure 4(a), (b) and Table 2b).
Table 2a. Trace elements (in ppm), Al, TOC, LOI (loss on ignition) (Weight%) and δ¹³C-org (in ‰) data from the Sirbu Shale samples. BM denotes before remineralization and loss denotes loss during diagenesis of Sirbu Shale

Table 2b. Correlation matrix (R values) among trace elements enrichment factor, Al, Mn/Al, Fe/Al, TOC, δ¹³C-org and LOI of Sirbu Shale samples

Table 3. The range of Th/Co and Th/Cr ratios in Sirbu Shale, felsic rocks, mafic rocks and upper continental crust


Fig. 3. Stratigraphic profile of VEF, CrEF, CoEF, NiEF, MoEF, CdEF, UEF, TOC, δ¹³C-org, TOCbm and TOCloss for Sirbu Shale samples.
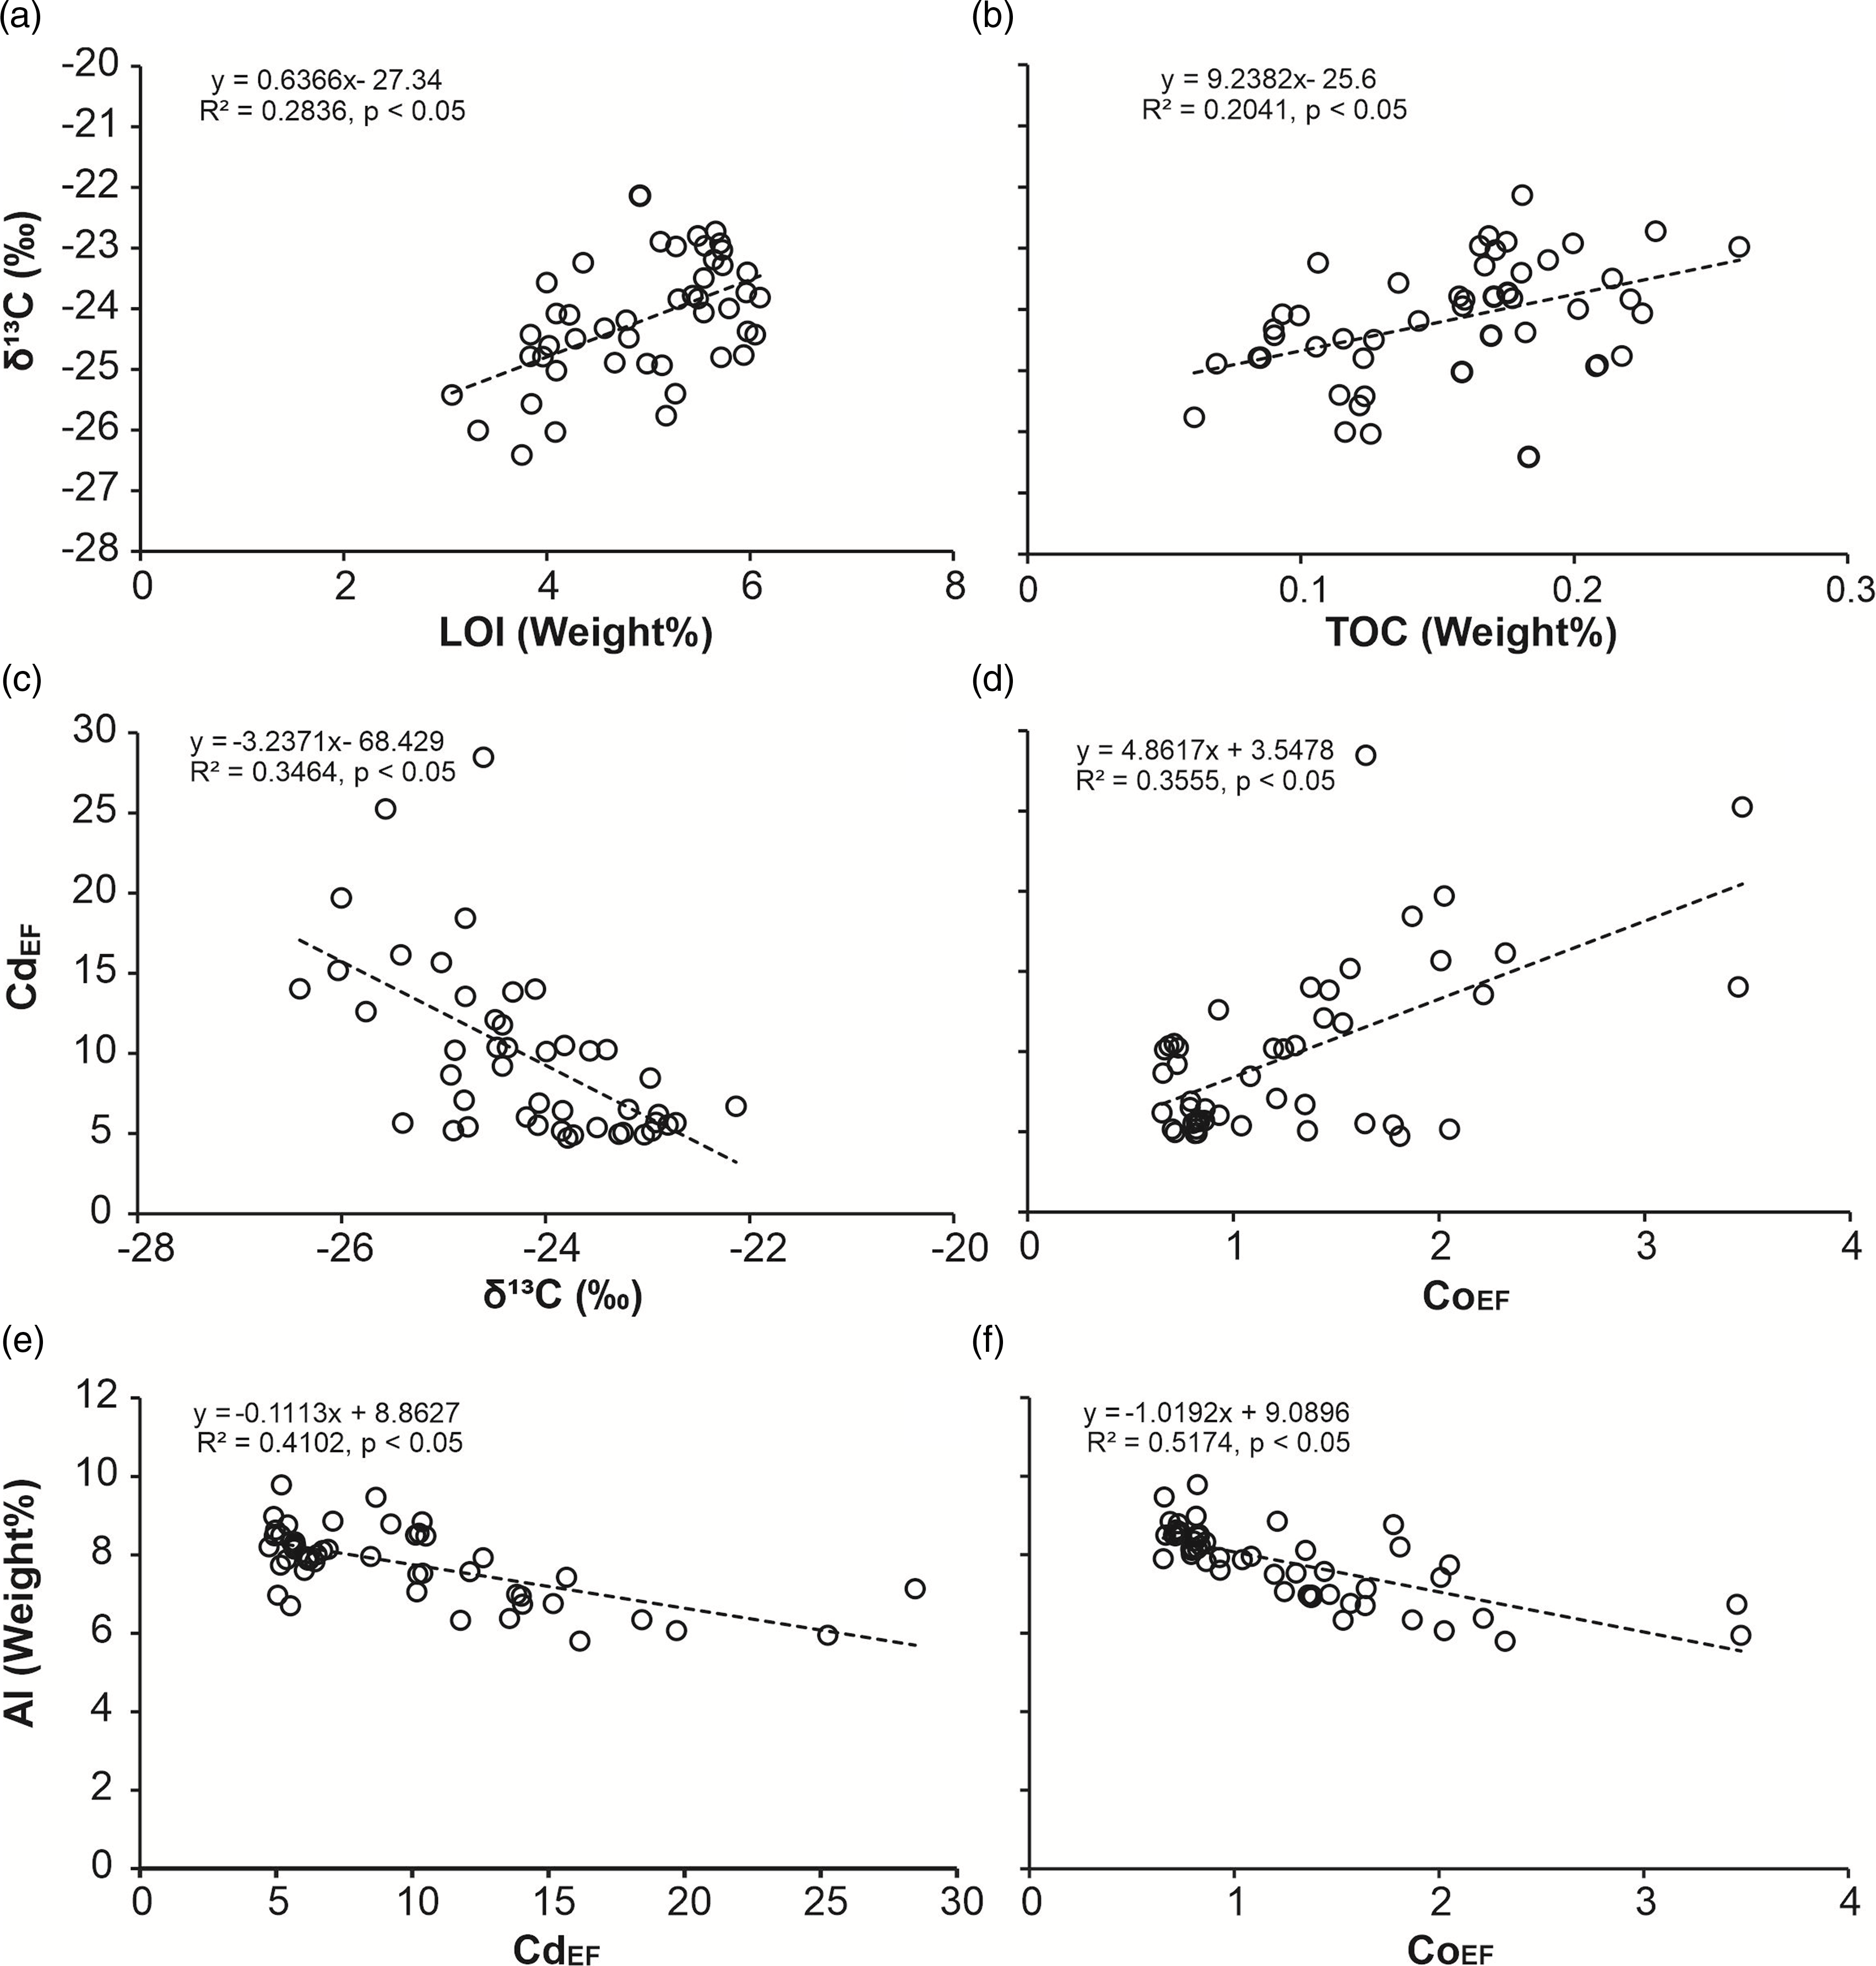
Fig. 4. The cross plots of (a) δ13C versus TOC, (b) δ13C versus LOI, (c) CdEF versus δ13C, (d) CdEF versus CoEF, (e) Al versus CdEF and (f) Al versus CoEF for Sirbu Shale samples.

Fig. 5. The cross plots of (a) PEF versus CdEF, (b) Mn/Al versus CdEF, and (c) Fe/Al versus CdEF for Sirbu Shale samples.
The minimum and maximum range for TOCbm estimated by using Eq.4 are 0.71 to 5.08% (average 1.65%) and 1.43 to 10.16% (average 3.31%), respectively (Figure 3 and Supplementary Table 3). The minimum and maximum range for TOCloss estimated by using Eq.5 are 1.37 to 9.90% (average 3.16%) and 0.65 to 4.82% (average 1.5%), respectively (Supplementary Table 3). Stratigraphic variations in TOCbm shows two distinct regimes: first covers the litho-unit B, in which average TOCbm ranges from 2.33% to 4.66% (Figure 3 and Supplementary Table 3), and second the litho-unit C, in which average TOCbm ranges from 0.98% to 1.96%. The average Cd/Mo ratio in litho-units B and C are 0.97 and 0.55.
5. Discussions
5.1. Diagenetic changes in Cd and δ¹³C-org records
Prior understanding of diagenetic changes in the biogeochemical records of geologically aged sediments and rock samples is essential before those parameters can be used for palaeo-reconstructions. Early diagenetic processes in the sediments can remobilise the trace elements resulting in depletion or authigenic enrichment of the elements, which is commonly associated with aerobic and anaerobic oxidation of organic matter. These changes complicate the use of trace metals and stable isotopes for palaeo-reconstruction. In marine sediments, Cd buildup is frequently observed in the suboxic to sulphidic zones in conjunction with organic matter and sulphides (Rosenthal et al. Reference Rosenthal, Lam, Boyle and Thomson1995). The oxidation of sedimentary sulphides and organic matter at the interface between oxic and anoxic horizons can fluctuate on a millimetre-scale within the top sediment depending on the bottom water oxygen condition. This process can remobilise some proportion of sedimentary Cd into the bottom water (Gendron et al. Reference Gendron, Silverberg, Sundby and Lebel1986; Rosenthal et al. Reference Rosenthal, Lam, Boyle and Thomson1995; van Geen et al. Reference van Geen, McCorkle and Klinkhammer1995). According to Rosenthal et al. (Reference Rosenthal, Lam, Boyle and Thomson1995), Cd in sedimentary pore waters is primarily sourced from early diagenetic oxidation of sedimentary organic matter. It typically moves downward along the concentration gradients established by its removal near the redox boundary. The major removal of Cd from sedimentary pore waters may occur through the formation of insoluble CdS phases (Rosenthal et al. Reference Rosenthal, Lam, Boyle and Thomson1995; Plass et al. Reference Plass, Schlosser, Sommer, Dale, Achterberg and Scholz2020) and to some extent by its adsorption on Fe/Mn oxide particles (McCorkle & Klinkhammer, Reference McCorkle and Klinkhammer1991). According to Plass et al. (Reference Plass, Schlosser, Sommer, Dale, Achterberg and Scholz2020), the solubility of trace metals sulphides (CdS<<FeS/FeS2) is the crucial factor influencing their precipitation and accumulation in marine sediments. For example, CdS solubility in suboxic to anoxic conditions is found very low (Bryan et al. Reference Bryan, Dickson, Dowdall, Homoky, Porcelli and Henderson2021; Chen et al. Reference Chen, Little, Kreissig, Severmann and McManus2021; Janssen et al. Reference Janssen, Conway, John, Christian, Kramer, Pedersen and Cullen2014, Reference Janssen, Abouchami, Galer, Purdon and Cullen2019), but re-dissolution has been observed in highly sulphidic environments through formation of bi-sulphide or poly-sulphide complexes (Gobeil et al. 1987; Plass et al. Reference Plass, Schlosser, Sommer, Dale, Achterberg and Scholz2020; Chen et al. Reference Chen, Little, Kreissig, Severmann and McManus2021). Given the limited post-depositional release of CdS from sediment (due to its lower solubility) in suboxic to anoxic settings (Bryan et al. Reference Bryan, Dickson, Dowdall, Homoky, Porcelli and Henderson2021; Chen et al. Reference Chen, Little, Kreissig, Severmann and McManus2021; Janssen et al. Reference Janssen, Conway, John, Christian, Kramer, Pedersen and Cullen2014, Reference Janssen, Abouchami, Galer, Purdon and Cullen2019), Cd seems more trustworthy among trace elements to be utilized as a proxy for palaeoproductivity and palaeoredox studies for non-euxinic sediments or rock deposits (Viehmann et al. Reference Viehmann, Hohl, Kraemer, Bau, Walde, Galer, Jiang and Meister2019).
According to Morse and Luther III (1999), divalent trace metals such as Cd and Mn can form a sulphide mineral more quickly than iron and non-divalent trace metals (V, Cr, Ni, Co, Mo and U) because of their higher water exchange rates. Hence under the trace sulphide concentration, Cd and Mn are most likely to precipitate in considerable amounts when compared to V, Cr, Ni, Co, Mo and U. Additionally, compared to V, Cr, Ni, Co, Mo and U, the sulphide minerals of Cd and Mn are found more resistant to oxidative remobilization (Simpson et al. Reference Simpson, Apte and Batley1998). Thus, two possibilities could account for the large enrichment of Cd but no enrichment of V, Cr, Ni, Co and Mo in the Sirbu Shale: (1) the Sirbu Shale was deposited in a suboxic environment with trace amounts of sulphide production that were enough to precipitate Cd, Mn and other divalent trace metals but no others; (2) The Sirbu Shale deposition took place under suboxic to an anoxic condition that precipitated a significant amount of divalent (Cd and Mn) as well as non-divalent trace metals (V, Cr, Ni, Co, Mo and U), but during the intermittent oxygenation of sediments, non-divalent sulphides redissolved rapidly into the overlying water column. In contrast, sulfides of divalent trace metals underwent little change. A significant positive correlation of CdEF with Mn/Al (Figure 5(b)) can be considered as evidence for little to no significant remobilization of Cd and Mn. But no correlation between Cd and Fe/Al (Figure 5(c)) suggests a significant remobilization of Fe during diagenetic history.
Additionally, over several million years, the maturation/thermal cracking of the organic matter in the sediment under high pressure and temperature conditions can result in the release of labile organic components in the form of liquids and gases, which can remobilise the trace elements as well (Ardakani et al. Reference Ardakani, Chappaz, Sanei and Mayer2016; Wilde et al. Reference Wilde, Lyons and Quinby-Hunt2004). A recent experimental study by Dickson et al. (Reference Dickson, Idiz, Porcelli and van den Boorn2020), however, demonstrated that this process may lead to a loss of organic matter from the rocks and an increase in organically bound trace elements. A negative correlation of CdEF with TOC and LOI (Table 2b) in this study can be an indication of slight enrichment of Cd during TOC loss through cracking of sedimentary organic matter during rock maturation. Such changes in Cd concentration during the maturation process are minor in comparison to the bulk enrichment of Cd in the shale samples (Dickson et al. Reference Dickson, Idiz, Porcelli and van den Boorn2020) and can be disregarded.
Organic carbon isotope values during early diagenesis in a range of environments can change by ±2.5 ‰ (Freudenthal et al. Reference Freudenthal, Wagner, Wenzhöfer, Zabel and Wefer2001; Lehmann et al. Reference Lehmann, Bernasconi, Barbieri and McKenzie2002). Typically, a decrease in δ¹³C of organic matter has been reported during their degradation because 12C-enriched organic compounds are relatively more stable/refractory than ¹³C-enriched organic compounds (Freudenthal et al. Reference Freudenthal, Wagner, Wenzhöfer, Zabel and Wefer2001). Furthermore, studies have demonstrated that residual sedimentary organic matter of the oxic zone contains a lower proportion of refractory organic matter compared to that of the anoxic zone, which suggests that the carbon isotope effect associated with organic matter remineralization in the anoxic zone would be higher than that occur in the oxic zone (Jochum et al. Reference Jochum, Friedrich, Leythaeuser, Littke and Ropertz1995; Partin et al. Reference Partin, Bekker, Planavsky, Scott, Gill, Li, Podkovyrov, Maslov, Konhauser, Lalonde, Love, Poulton and Lyons2013; Lindsey et al. Reference Lindsey, Rimmer and Anderson2018). This shows that the significant positive correlation of TOC with δ¹³C and LOI (Figures 4(a), (b)) observed in the Sirbu Shale samples can be a result of the isotopic effect associated with the remineralization of sedimentary organic matter.
5.2. Palaeoredox environment and trace metal enrichment
The RSTEs, which are water-soluble in oxidized form and water-insoluble in reduced form, i.e., Cr and V, show no enrichment. It can be explained by either depletion of these trace metals in source rocks, i.e., terrestrial felsic rocks (Morris, Reference Morris1986; Paikaray et al. Reference Paikaray, Banerjee and Mukherji2008; Absar et al. Reference Absar, Raza, Roy, Naqvi and Roy2009; Banerjee & Banerjee, Reference Banerjee and Banerjee2010) or their progressive loss in low salinity water (Morris, Reference Morris1986; O′Connor et al. 2015). The trace elements ratios such as Th/Co and Th/Cr, which are found significantly different for felsic and mafic rocks (Nagarajan et al. Reference Nagarajan, Madhavaraju, Nagendra, Armstrong-Altrin and Moutte2007), suggest a predominant felsic source for the Sirbu Shale (Table 3). The UEF of the Sirbu Shale ranging, between 1.8 and 2.8, is consistent with the modern marine sediments deposited in suboxic conditions or nitrate reduction zone (Algeo & Li, 2020; Kessarkar et al. 2022). Small intermittent enrichment of Co could be associated with its co-precipitation along with Cd in the organic matter or with the trace of sulphides, which is evident from the significant positive correlation between CdEF and CoEF (Figure 4(d)). Furthermore, CdEF and CoEF show a significant negative correlation with detrital tracer element Al (Figure 4(e), (f)), which supports the notion that their large proportion in the sediments was associated with non-detrital deposition (Rosenthal et al. Reference Rosenthal, Lam, Boyle and Thomson1995; Janssen et al. Reference Janssen, Conway, John, Christian, Kramer, Pedersen and Cullen2014; Dickson et al. Reference Dickson, Idiz, Porcelli and van den Boorn2020). The adsorption of Cd and Co on the clay minerals, which tends to increase with a rise in Mn2+ concentration, could also have immobilized them in addition to organic matter and sulphides in a suboxic to the anoxic environment (Groeningen et al. Reference Groeningen, Glück, Christl and Kretzschmar2020). A statistically significant moderate positive correlation among CdEF, CoEF and Mn (Figure 4 and Table 2b) supports the latter possibility.
The sourcing of Cd and Co, as well as Mn, was most likely from the upwelling region in the relatively deeper marine shelf region (Wagner et al. Reference Wagner, Hendy, McKay and Pedersen2013; Sweere et al. Reference Sweere, van den Boorn, Dickson and Reichart2016, Reference Sweere, Dickson, Jenkyns, Porcelli and Henderson2020). The relatively high enrichment level of Cd but no significant enrichment of other trace elements in the Sirbu Shale closely matches with the modern marine surface sediments underlying the suboxic zone of Chile margins (Böning et al. Reference Böning, Cuypers, Grunwald, Schnetger and Brumsack2005), which is one of the most prominent seasonal upwelling zones in the modern ocean. This suggests that the Sirbu Shale was deposited in a setting similar to that in which modern suboxic sediments of the Chilean margin are deposited. In light of this conclusion, the substantial enrichment of Cd in the shale, but the lack of considerable enrichment in other trace elements, can also be utilized as a palaeo-indicator of a suboxic marine environment driven by seasonal upwelling. However, testing this hypothesis will require more such data from black shale deposits and modern anoxic basins.
5.3. Palaeoproductivity
In marine/freshwater basins, during the transit from primary production (photosynthesis) to burial in sediments, organic matter undergoes rapid remineralization, which is mainly controlled by water column oxygen condition, type of organic matter exported (more refractory or more labile) and sedimentation rate (Burdige, Reference Burdige2007). The efficiency of this process is found variable on the spatial scale (Lutz et al. Reference Lutz, Caldeira, Dunbar and Behrenfeld2007) and over geological time (Raven & Falkowski, Reference Raven and Falkowski1999). It has been found that under oxygenated marine water column conditions, less than 0.5% of organic matter from gross primary production reaches the sediments (Burdige, Reference Burdige2007), therefore not a true representative of primary productivity (Lopes et al. Reference Lopes, Kucera and Mix2015). In the Sirbu Shale, TOC contents remain persistently below 0.26% (Table 2a) with an average value of 0.18%, suggesting that either primary productivity was originally low, or if primary productivity was high, the burial efficiency of photosynthetically derived organic matter was poor due to frequent ventilation of the water column and/or low sedimentation rate. Under these circumstances, Cd released from the remineralization of organic matter moves towards the oxic-anoxic boundary in the subsurface sediment due to a concentration gradient caused by Cd precipitation with sulphide traces in suboxic-anoxic zones. Therefore, Cd can provide a more accurate depiction of the primary production than TOC itself, preserved in ancient sedimentary records. The CdEF in this study shows a weak but statistically significant (Pearson coefficient = 0.000355) correlation (Figure 5(a) and Table 2b) with PEF, demonstrating a small enrichment compared to UCC. Since P is an essential nutrient that controls the oceanic primary productivity and organic matter export to the sediment is one of the most important contributors to sedimentary P content in marine environment, the enrichment of P in marine sedimentary records is also used as a strong proxy for delineating palaeoproductivity (Ruttenberg and Berner, Reference Ruttenberg and Berner1993; Schenau et al. Reference Schenau, Reichart and De Lange2005). However, a large fraction of P from sedimentary organic matter is often released back into the water column during early digenesis remineralization (Ruttenberg and Berner, Reference Ruttenberg and Berner1993; Sulu-Gambari et al. Reference Sulu-Gambari, Hagens, Behrends, Seitaj, Meysman, Middelburg and Slomp2018). The phosphorus content in the Sirbu Shale is found comparative to the sediments of a seasonally hypoxic modern marine basin (Schenau et al. Reference Schenau, Reichart and De Lange2005). Thus, the enrichment of Cd and P and a significant correlation between the two in Sirbu Shale can be considered compelling evidence of high primary productivity in the concomitant depositional environment.
The average minimum and maximum TOCbm (organic matter that made it to the sediment through the water column) calculated using Eq.4, for the Sirbu Shale, are 1.65 and 3.31%, respectively. These average TOCbm values closely overlap the TOC values (1.53 to 3.45%) reported from the modern marine sediments underlying the suboxic waters of Chile margin’s oxygen minimum zone, which are subject to substantial seasonal upwelling and high primary productivity (Böning et al. Reference Böning, Cuypers, Grunwald, Schnetger and Brumsack2005). TOCbm shows an overall stratigraphic decrease in the studied section of the Sirbu Shale (Figure 3). This stratigraphic variation of TOCbm indicates that the litho-unit B was deposited under relatively higher productivity and less ventilated conditions compared to the litho-unit C. The average TOCloss (calculated by subtracting the bulk TOC value of sample from the TOCbm) through remineralization during the deposition of the litho-unit B ranging from 94 to 97% was noticeably higher than during the deposition of the litho-unit C, which has the average TOCloss ranged from 82 to 91% (see Supplementary Table 3). These results indicate that the TOCloss through diagenesis/remineralization during the higher primary productivity was relatively higher and vice-versa. As the sedimentological studies of Sirbu Shale suggest that litho-unit B was deposited in a relatively deeper sea-shelf environment (around storm wave-base) compared to litho-unit C (deposited near fair weather wave-base) (Figure 6; Singh & Chakraborty, Reference Singh and Chakraborty2022), the higher TOCloss in litho-unit B seems to be a result of relatively slower sedimentation rate. According to studies of marine sediments, TOCloss > 80% through remineralization in marine sediments is generally associated with the sediments underlying suboxic to oxic water column (Burdige, Reference Burdige2007). These shifts in the primary productivity might have been driven by changes in nutrient supply through terrestrial discharge and/or through an upwelling-productivity feedback loop over the continental shelf (Pedersen & Calvert, Reference Pedersen and Calvert1990; Wyrtki, Reference Wyrtki1962).

Fig. 6. Schematic diagram of Sirbu Shale palaeodepositional environment and palaeoproductivity. B in the figure denotes the palaeodepositional position of litho-units B and C denotes the palaeodepositional position of litho-unit C in the basin.
5.4 Upwelling and basin restriction
The Cd/Mo ratios in Sirbu Shale are greater than 0.36 (Figure 7), implying that the studied section was most likely deposited in an open marine shelf condition. Furthermore, Figure 7, adapted from Sweere et al. (Reference Sweere, van den Boorn, Dickson and Reichart2016), shows that Cd/Mo ratios of litho-unit B fall in the perennial upwelling zone, and Cd/Mo ratios of litho-unit C fall in the seasonal upwelling zone. Detailed comparison of the Sirbu Shale Cd/Mo data with the trace metal data from oxygen-depleted basins (Sweere et al. Reference Sweere, van den Boorn, Dickson and Reichart2016 and reference therein) reveals more similarity with the sediment core records of the Arabian Sea (average Cd/Mo = 0.14) (Van der Weijden et al. Reference van der Weijden, Reichart and van Os2006) and the Gulf of California (average Cd/Mo ratio = 0.21) (Brumsack, Reference Brumsack1989), which are known for seasonal upwelling condition. Sedimentary Cd/Mo ratios in hydrographically restricted basins are generally found close to that in seawater composition (average Cd/Mo ∼ 0.0057, Sarmiento et al. Reference Sarmiento, Gruber, Brzezinski and Dunne2004) but an increase in the influence (frequency) of upwelling leads to a Cd/Mo ratio closer to the phytoplankton composition (average Cd/Mo ∼ 7.9, Ho et al. Reference Ho, Quigg, Finkel, Milligan, Wyman, Falkowski and Morel2003). Therefore, the accumulations of Cd-rich phytoplankton reaching the sediments in upwelling-induced high productivity settings are likely to contribute a strong Cd enrichment (Sweere et al. Reference Sweere, van den Boorn, Dickson and Reichart2016, Reference Sweere, Dickson, Jenkyns, Porcelli and Henderson2020).

Fig. 7. Mo versus Cd plot for Sirbu Shale samples with regression lines forced through the origin, representing Cd/Mo ratios for marine phytoplankton, perennial upwelling, seasonal upwelling, and weakly restricted conditions. This figure is adapted from Sweere et al. (Reference Sweere, van den Boorn, Dickson and Reichart2016).
Given the above interpretation, we must admit that basin morphology, redox structure (i.e., coverage of anoxic and euxinic sea floor) and terrestrial influx in the Precambrian basins might be substantially different from the modern anoxic basins. For example, studies have demonstrated that trace metal drawdown in the Proterozoic ocean was perhaps greater than today due to larger coverage of anoxic and euxinic sea seafloor, which would have varied over the geological time scale (Reinhard et al. Reference Reinhard, Planavsky, Robbins, Partin, Gill, Lalonde, Bekker, Konhauser and Lyons2013, Reference Reinhard, Planavsky, Olson, Lyons and Erwin2016). Therefore, we are sceptical about to what extent such a trace metal ratio model based on modern anoxic basin studies can accurately interpret the Precambrian oceanic environment. It remains a question that must be debated and addressed in future studies.
6. Conclusion
In the post-NOE, Precambrian Ocean productivity varied from moderate to high depending upon the varying intensity of nutrient supply through upwelling in deeper marine shelf regions. However, TOC from the rock records does not reflect these variations in productivity because of high TOCloss through remineralization in the water column as well as in the surface sediment during early diagenesis resulting in a very low TOC content in the sedimentary rock record, which on stratigraphic scale appears almost invariable. This study demonstrated that authigenic Cd enrichment in sedimentary rocks can be used with fair confidence to estimate total organic matter exported to the seafloor during deposition. However, more such studies are recommended to strengthen this finding. The following are the key findings of this study:
This study demonstrated that the Sirbu Shale was deposited in a hydrographically restricted open marine shelf environment, which experienced strong upwelling and led to high primary productivity.
The findings imply that the deposition of the Sirbu Shale occurred in the close vicinity of a major marine oxygen minimum zone.
During the deposition of litho-unit B of Sirbu Shale, the average TOC exported to the sediments ranged from 2.3 to 4.6%, and 93 to 96% of it was lost through remineralization during diagenesis. Whereas during the deposition of litho-unit C of Sirbu Shale, average TOC exported to the sediments varied from 1 to 2%, and 81 to 91% of it was lost through remineralization during diagenesis.
Supplementary material
The supplementary material for this article can be found at https://doi.org/10.1017/S0016756823000614
Acknowledgement
We are thankful to the Director of BSIP for throughout support. Lab work was performed by Dr. Shailesh Agarwal, Archana Sonkar, Ishwar Rahi and Sandeep Kohri. The help of Yogesh Kumar in data visualization/artwork is very much appreciated. We are grateful to the two anonymous reviewers for their comments and suggestions, which were immensely helpful in improving the MS.
Funding Statement
This work was funded by BSIP under Project 1 (2021-2025). The BSIP contribution number for this MS is BSIP/RDCC/Publication no. 84/2020-21.


 Open access