


1. Background
Natural disasters, such as earthquakes, hurricanes, and other extreme weather events, have a devastating effect on societies. The frequency of such disasters is increasing worldwide, with loss of life and economic damage also increasing (Man et al., Reference Man, Lack, Wyatt and Murray2018). To enhance disaster preparedness, the UN member states adopted the Sendai Framework for Disaster Risk Reduction in 2015, which prioritizes access to health care services following natural disasters. Specifically, improving resilience against natural disasters is a priority and for this goal, it was recommended that the resilience of the national health system be enhanced by guaranteeing access to basic health care services in the post-disaster phase (United Nations, 2015).
On March 11, 2011, the Great East Japan Earthquake (GEJE) and resulting massive tidal waves hit the approximately 400 km-long Pacific sides of the Japanese archipelago, including the Iwate, Miyagi, and Fukushima prefectures. The result was devastating damage to residences and entire communities, as well as the nuclear accident at the Fukushima Daiichi Nuclear Power Plant. According to the Fire and Disaster Management Agency (FDMA) in Japan (2013), the GEJE was a magnitude 9.0 earthquake, the largest on record in Japan and the fourth largest anywhere in the world since 1900. As of March 1, 2019, it led to 19,689 deaths, 2,563 missing persons, and 6,233 injuries, and caused damage to more than 1.2 million buildings (FDMA, 2019). This disaster and its outcomes provide a localized natural experiment on health care and outcomes, which we exploit in this study. Further, by exploiting the Japanese health insurance schemes that have varying copayment requirements, we examine how the generosity of health insurance influences the health of those afflicted by the GEJE.
1.1 The Japanese health insurance scheme
Health insurance coverage is an important determinant of access to health care. Over the past decade, numerous medical and economic studies have shown the effects of coverage on health care use and outcomes (Sommers et al., Reference Sommers, Gawande and Baicker2017). This research suggests that expanded coverage significantly increases access to care and use of both preventative and curative care, yielding significant positive benefits to health. We investigate whether expanded health insurance coverage might also increase access to care and improve the health of individuals in areas affected by natural disasters. Specifically, we use a triple differences (DDD) model to examine the effects of health insurance coverage on health care use and outcomes following the GEJE. To assess how copayment affects health care use, we exploit a discontinuous decrease in the copayment rate for medical care at the age of 70 years in the Japanese public health insurance system.
The Japanese public health insurance scheme is a backbone of the social security system for the elderly, together with public pension and long-term care insurance.Footnote 1 The universal coverage in public pension and health insurance is a main characteristic of the Japanese social security system, and both schemes adopted the social insurance system, financed by social insurance premiums and supplemented by tax revenue in the form of subsidies. Since the 1990s, measures against the declining birthrate in addition to the aging society have surfaced as an important policy issue, and pension and health insurance system reforms have been implemented. Concerns regarding fiscal burden have been continuously raised with various proposals on policy reforms (National Institute of Population and Social Security Research, 2019). However, such fiscal burdens often do not fully account for its beneficial health effects. We examine health effects of such institutional provision and provide additional insights to evaluating governmental old-age support programs. As previously noted, the copayment rate varies across age under the Japanese public health insurance scheme that provides standard medical treatment under the uniform medical fee schedule. We exploit this policy variation in copayment rates. Specifically, the copayment rate in 2011, when the GEJE occurred, was 30% for those aged 7–69 years, 20% for those aged 6 and under, and 10% for those ages 70 or above.
1.2 Effects of the Great East Japan Earthquake
Previous studies have examined the effects of the 2011 GEJE on labor markets (Higuchi et al., Reference Higuchi, Inui, Hosoi, Takabe and Kawakami2012), risk preference (Naoi et al., Reference Naoi, Seko and Ishino2012; Jiang et al., Reference Jiang, Asai and Moridaira2013; Hanaoka et al., Reference Hanaoka, Shigeoka and Watanabe2018), macroeconomic outcomes (Ando and Kimura, Reference Ando and Kimura2012; Hosoe, Reference Hosoe2014), and psychological happiness, and well-being (Yamamura et al., Reference Yamamura, Tsutsui, Yamane, Yamane and Powdthavee2015; Sone et al., Reference Sone, Nakaya, Sugawara, Tomata, Watanabe and Tsuji2016; Sugano, Reference Sugano2016; Okuyama and Inaba, Reference Okuyama and Inaba2017). Several studies have also examined the health effects of the disaster (Nishigori et al., Reference Nishigori, Sugawara, Obara, Nishigori, Sato, Sugiyama, Okamura and Yaegashi2014; Yonekura et al., Reference Yonekura, Takeda, Shetty and Yamaguchi2014; Tomata et al., Reference Tomata, Suzuki, Kawado, Yamada, Murakami, Naka, Shibata, Ojima, Hashimoto and Tsuji2015; Tsuboya et al., Reference Tsuboya, Aida, Hikichi, Subramanian, Kondo, Osaka and Kawachi2016, Reference Tsuboya, Aida, Hikichi, Subramanian, Kondo, Osaka and Kawachi2017; Murakami et al., Reference Murakami, Sugawara, Tomata, Sugiyama, Kaiho, Tanji and Tsuji2017).
Most of these studies focused on examining the health of those in disaster-afflicted areas. For example, Yonekura et al. (Reference Yonekura, Takeda, Shetty and Yamaguchi2014) examined salivary cortisol levels of 63 GEJE victims and found that 22% could be classified as having ‘high depression.’ Nishigori et al. (Reference Nishigori, Sugawara, Obara, Nishigori, Sato, Sugiyama, Okamura and Yaegashi2014) also reported 21% of postnatal women recruited from 26 hospitals and clinics in the coastal area of the Miyagi prefecture had depression, which was much higher than the previously reported prevalence rate of 13.9%. Using data from the Japan Gerontological Evaluation Study, Tsuboya et al. (Reference Tsuboya, Aida, Hikichi, Subramanian, Kondo, Osaka and Kawachi2016, Reference Tsuboya, Aida, Hikichi, Subramanian, Kondo, Osaka and Kawachi2017) found that house loss and disruption of access to medicine after the disaster were associated with increased depressive symptoms and reduced ability to perform instrumental activities of daily living among those living in the affected area in Miyagi prefecture. Using 2011 and 2013 health check-up records in Miyagi prefecture, Murakami et al. (Reference Murakami, Sugawara, Tomata, Sugiyama, Kaiho, Tanji and Tsuji2017) found that disaster victims who had moved to temporary or rental housing had the highest risk of negative health effects resulting from alcohol consumption. These studies did not control for the common effect of the GEJE and unobserved heterogeneity across regions, potentially leading to overestimation. An exception is Tomata et al. (Reference Tomata, Suzuki, Kawado, Yamada, Murakami, Naka, Shibata, Ojima, Hashimoto and Tsuji2015), who used monthly municipal insurer-aggregate panel data from January 2011 to January 2014 and found that disabilities were more prevalent in disaster areas than elsewhere. However, the authors did not control for heterogeneity among individuals.
We use data from a comprehensive panel survey, the Japanese Study for Aging and Retirement (JSTAR), to examine the effect of the catastrophic natural disaster on afflicted individuals' health and their demand for medical and long-term care and then investigate the protective health effects of health insurance against disaster. Using the JSTAR has great advantages for this purpose. First, since the survey region includes Sendai, which is near the GEJE epicenter (Figure 1), and other areas not affected by the earthquake, we can estimate the average treatment effect of the GEJE by using a difference-in-differences (DD) model. Second, rich data from the JSTAR enables a comprehensive study of the health effects of GEJE.
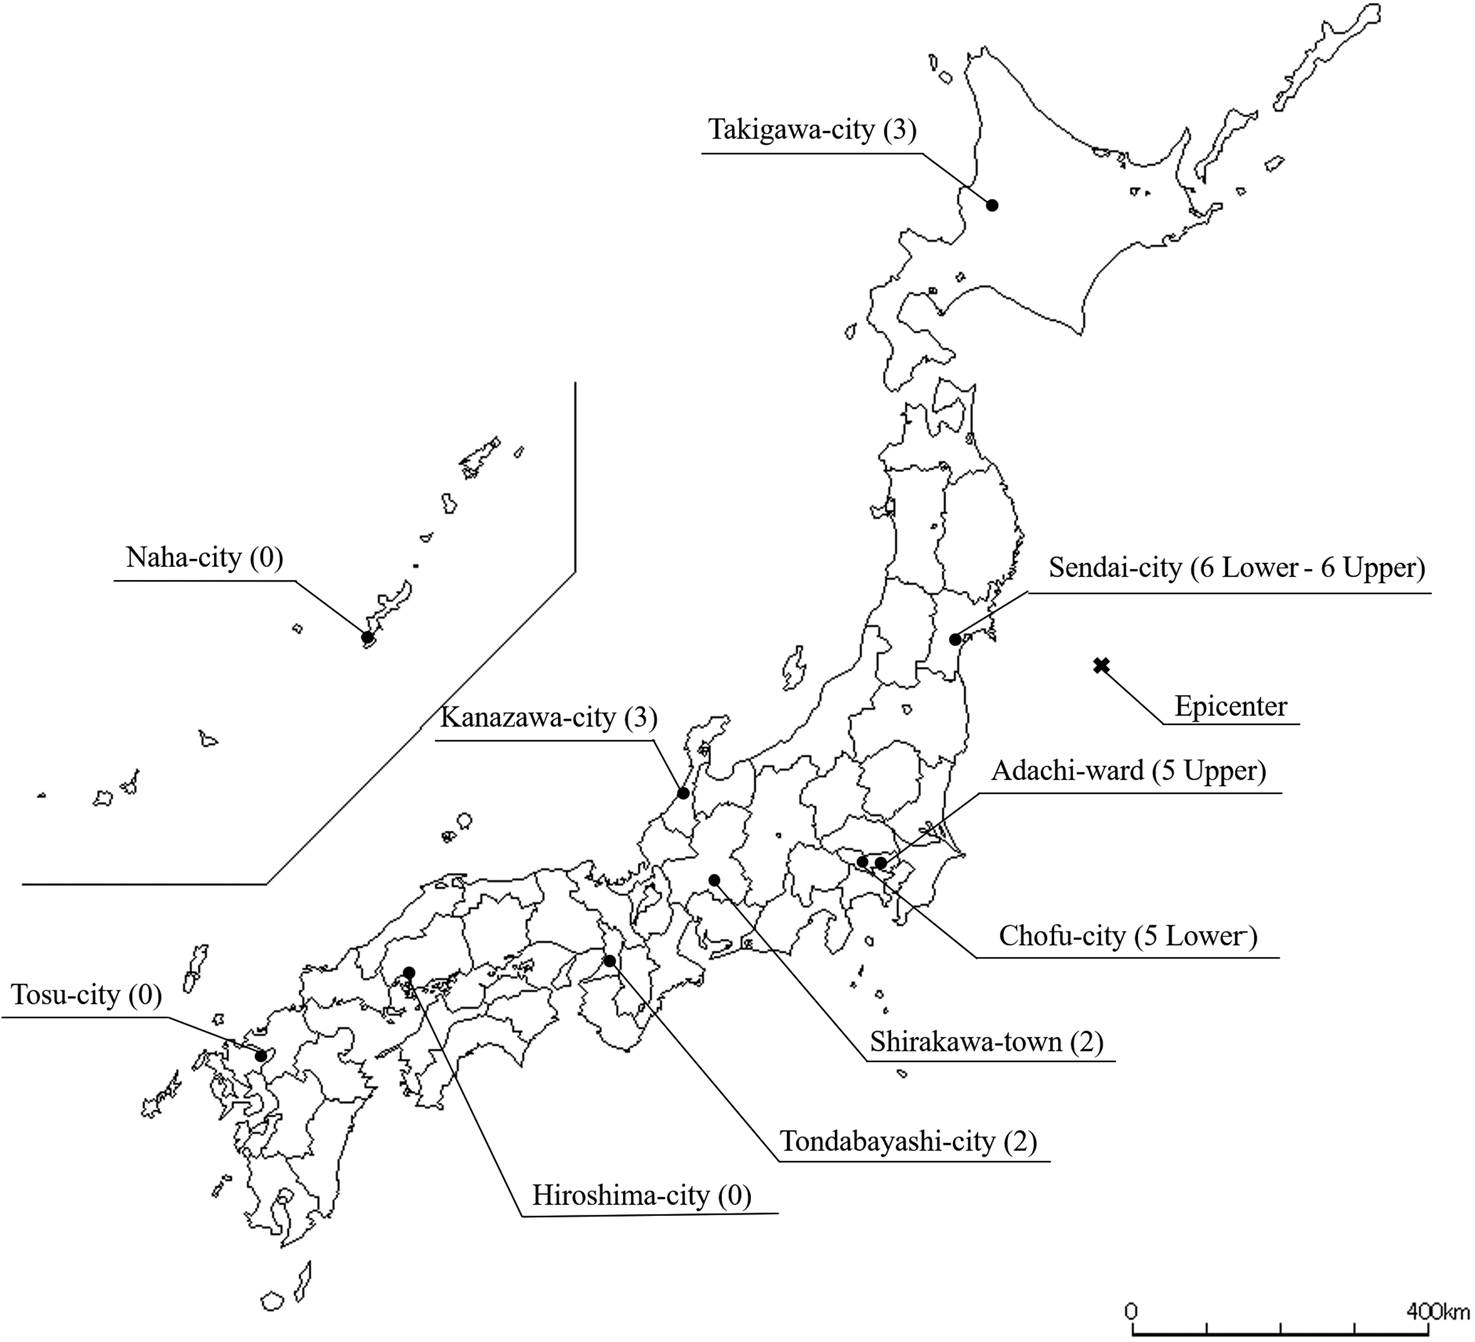
Figure 1. The JSTAR study regions and their maximum seismic intensity scales of the GEJE.
Notes: Maximum seismic intensity scales (see Appendix 1) of the GEJE are in parentheses.
We find that the disaster had a large negative impact on individuals' health. However, we also find that use of medical and long-term formal care after the earthquake helped limit this negative impact. Moreover, we find that a discontinuous decline in the copayment rate for medical care at age 70 in the public health insurance system had a protective impact on health and that the reduction in copayment did not increase health care utilization among those who were affected by the GEJE, suggesting a substitution effect.
The rest of this paper is organized as follows. Section 2 provides a discussion of our data and measures. In Section 3, we present our estimation strategy and present the estimation results of the DD effect of the 2011 GEJE on health. Our empirical results on the effect of health insurance policies for the elderly affected by the GEJE are reported in Section 4. Finally, concluding remarks are provided in Section 5.
2. Data and measures
We use data from the JSTAR, a panel survey of the middle-aged and elderly population of Japan, conducted by the Research Institute of Economy, Trade, and Industry (RIETI), Hitotsubashi University, and the University of Tokyo every two years since 2007. The JSTAR is one of the Health and Retirement Study international network of studies. It collects information on the health and socioeconomic characteristics of respondents and their family members through a self-completion questionnaire and a computer-assisted personal interview.Footnote 2
In 2007, the JSTAR sampled five municipalities: Adachi-Ku (N = 868), Kanazawa (N = 1,011), Sendai (N = 908), Shirakawa (N = 570), and Takigawa (N = 806). In 2009, it added two further municipalities: Naha City (N = 922) and Tosu City (N = 645), and in 2011 it added three more: Chofu (N = 567), Hiroshima (N =1,100), and Tonbayashi (N = 517), bringing the total number of municipalities in the sample to ten. Its respondents are persons aged 50–75 years randomly selected from the Basic Resident Register. The JSTAR's sampling strategy allows analysts to compare the economic activities of individuals with similar circumstances. The average baseline response rates for all municipalities is 61.3% (ranging from 45.9% to 87.8%), and the average retention rate in the follow-up waves is 86.1% (ranging from 69.4% to 96.4%).
Figure 1 shows the JSTAR study regions and their maximum seismic intensity scales (Shin-do in Japanese) during the GEJE.Footnote 3 The seismic intensity scale describes the scale of ground motion at a particular location. The maximum scale of the GEJE was 7.0 in Kurihara—about 60 km north of Sendai. In Sendai, where the earthquake completely destroyed >30,000 houses and partially destroyed >100,000, the scale ranged from a high-6 to a low-6, decreasing with distance from the epicenter (see Appendix 1 for more details). There were 913 deaths, 30 missing, and 276 serious injuries in Sendai, but all the other JSTAR municipalities, with the exception of Adachi, were not affected by the GEJE (FDMA, 2011, 2014). Even in Adachi, human and property damages were very modest, involving no deaths and mostly minor injuries and partial damage (see Table 1 for human and property damages from the GEJE).Footnote 4 Given that GEJE was a localized natural disaster, we can consider Sendai residents to be the ‘treatment’ group of the natural experiment while the control group is comprised of residents of other municipalities.
Table 1. Health and property damage by the Great East Japan Earthquake
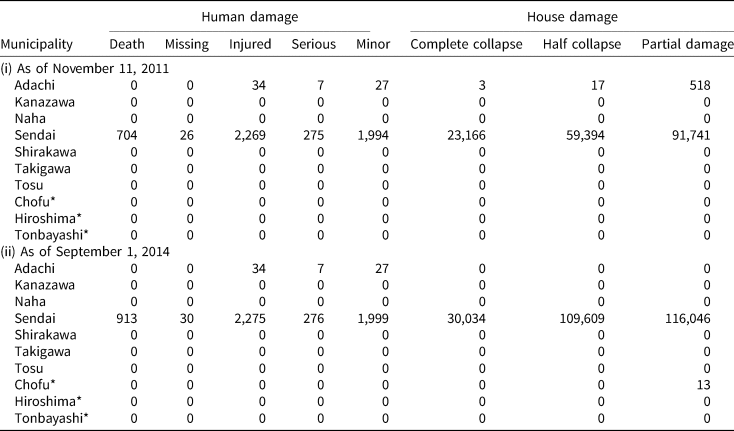
Note: * = the municipality that is not included in our sample.
Source: Fire and Disaster Management Agency, White Report on Fire Service 2011 and 2014.
We use three waves of the JSTAR for seven municipalities: Adachi, Kanazawa, Shirakawa, Sendai, Takigawa, Tosu, and Naha, for which we have data both before and after the GEJE. Table 2 presents the study sample characteristics at the baseline and Table 3 presents the variable definitions. We do not observe any significant sociodemographic differences between the treatment and control groups in terms of age, gender composition, marital status, income, and real estate ownership at the baseline prior to the GEJE. However, Sendai residents were slightly more educated with greater wealth than the control group.
Table 2. Sample characteristics: treatment versus control groups at the baseline (2007)
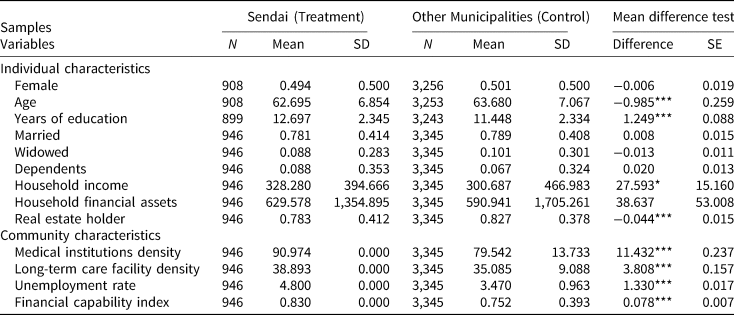
Note: This table shows summary statistics for the three waves of the JSTAR (2007–2011) by groups and years.
***, **, and * represent statistical significance at the 1%, 5%, and 10% levels, respectively.
Table 3. Variable definitions
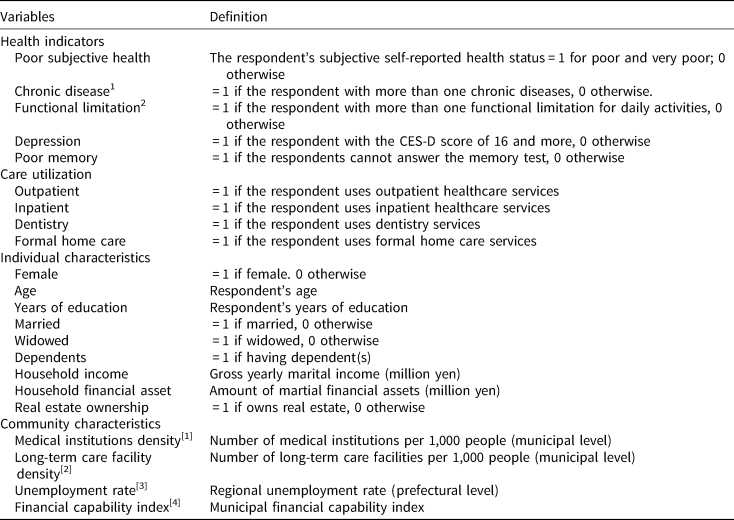
Notes: (i) Chronic diseases include heart disease, high blood pressure, cerebral stroke, diabetes, chronic lung disease, and joint disorders. (ii). Functional limitations include: (1) Walk 100 m, (2) Sit in a chair for two hours continuously, (3) Get up from a chair after sitting continuously for a long time, (4) Climb several flights of stairs without using the handrail, (5) Climb up one flight of stairs without using the handrail, (6) Squat or kneel, (7) Raise your hands above your shoulders, (8) Push or pull a large object such as a living-room chair or sofa, (9) Lift and carry an object weighing 5 kg or more, such as a bag of rice, and (10) Pick up a small object such as a one-yen coin from a desktop with your fingers.
Sources: [1] Survey of Medical Institutions, the Ministry of Health, Labour, and Welfare.
[2] Survey of Institutions and Establishments for Long-term Care, the Ministry of Health, Labour, and Welfare.
[3] Labour Force Survey, the Ministry of Internal Affairs and Communications.
[4] Annual Statistical Report on Local Government Finance, the Ministry of Internal Affairs and Communications.
Table 2 also reports macro-level characteristics, such as medical institution density, nursing care facility density, unemployment rate, and financial capability index, which would also affect health and care utilization. The density of medical institutions is the number of institutions per 100,000 residents, and that of nursing care facilities is the number of facilities per 1,000 individuals aged 65 years or older. The density variables capture accessibility to medical and long-term formal care services that can improve health. The density of medical and long-term care facilities was higher in Sendai than in the other municipalities. We use the unemployment rate as a proxy for economic conditions. Previous research finds that business fluctuations affect population health and medical care utilization in several developed countries (Ruhm, Reference Ruhm2000, Reference Ruhm2003, Reference Ruhm2005; Gerdtham and Ruhm, Reference Gerdtham and Ruhm2006; Haaland and Telle, Reference Haaland and Telle2015). The financial capability index, which is defined as the three-year average of the ratio of standard financial revenue to standard financial need,Footnote 5 indicates the condition of local government finances. Local governments with fiscal hardship may reduce their budget for public medical institutions or not actively carry out health-promotion measures, which would adversely affect health in the area. Sendai had slightly higher unemployment rate and greater financial capacity compared to other municipalities.
Following the 2007 baseline wave, two waves of JSTAR were fielded in 2009 and 2011. The 2011 wave was fielded about six months after the GEJE. Figures 2 and 3 present the longitudinal changes in health and health care utilization of the treatment and control groups, respectively. Taking advantage of rich JSTAR data, we examine a comprehensive set of health indicators, including subject health, chronic disease, limitations in functional health, depression, and memory. All health indicators are binary, suggesting poor subjective health, having a chronic disease, functional limitation, depression, and memory problems.
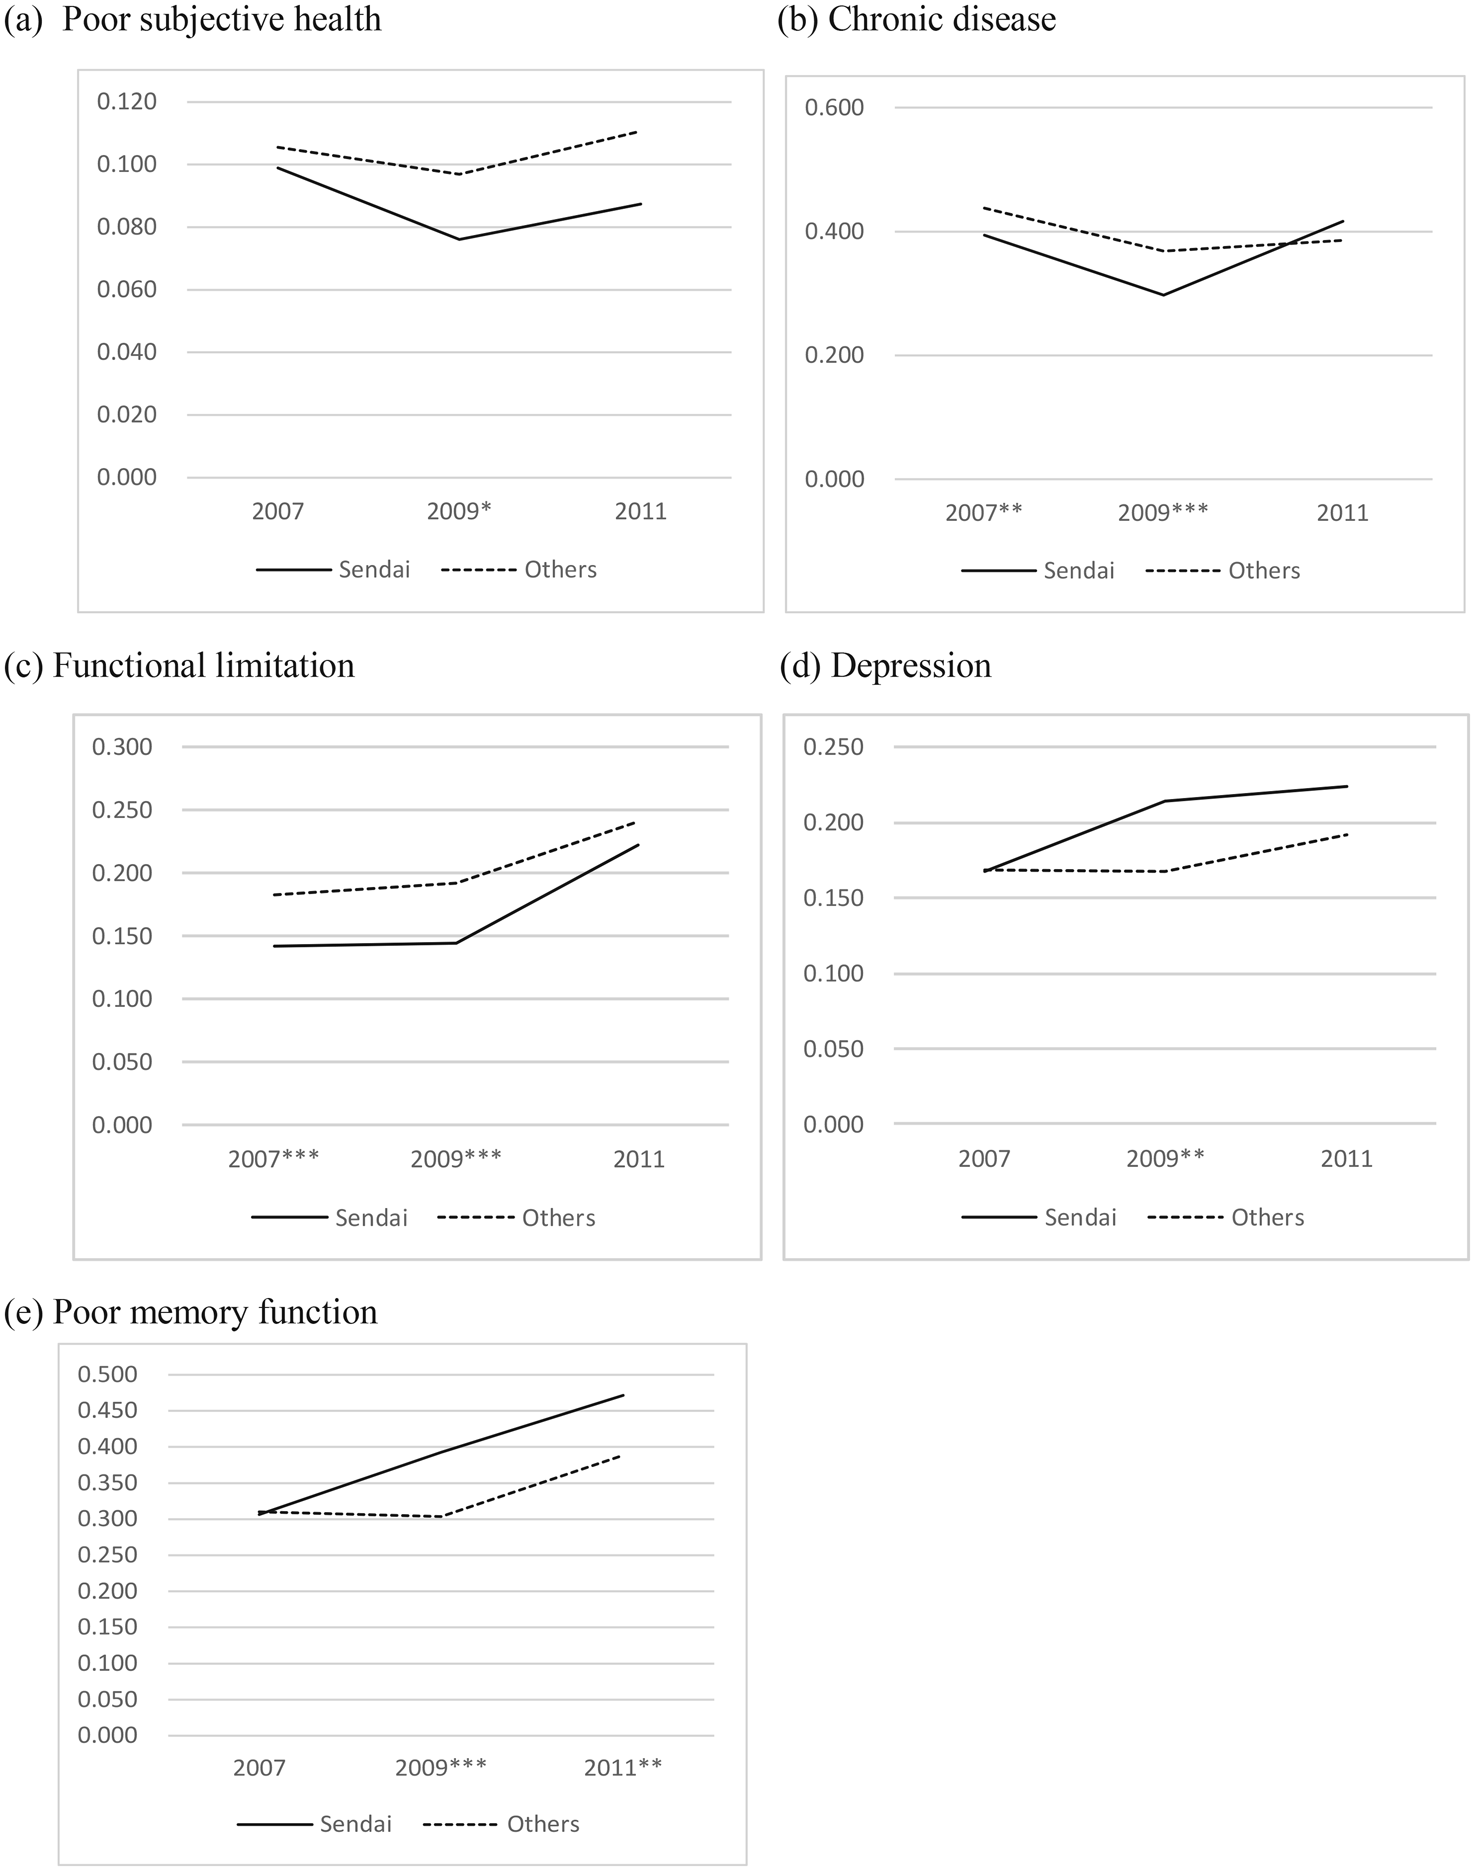
Figure 2. Health Indicators by Groups.
Notes: ***, **, and * represent statistical significance in the mean differences by year at the 1%, 5%, and 10% levels, respectively.
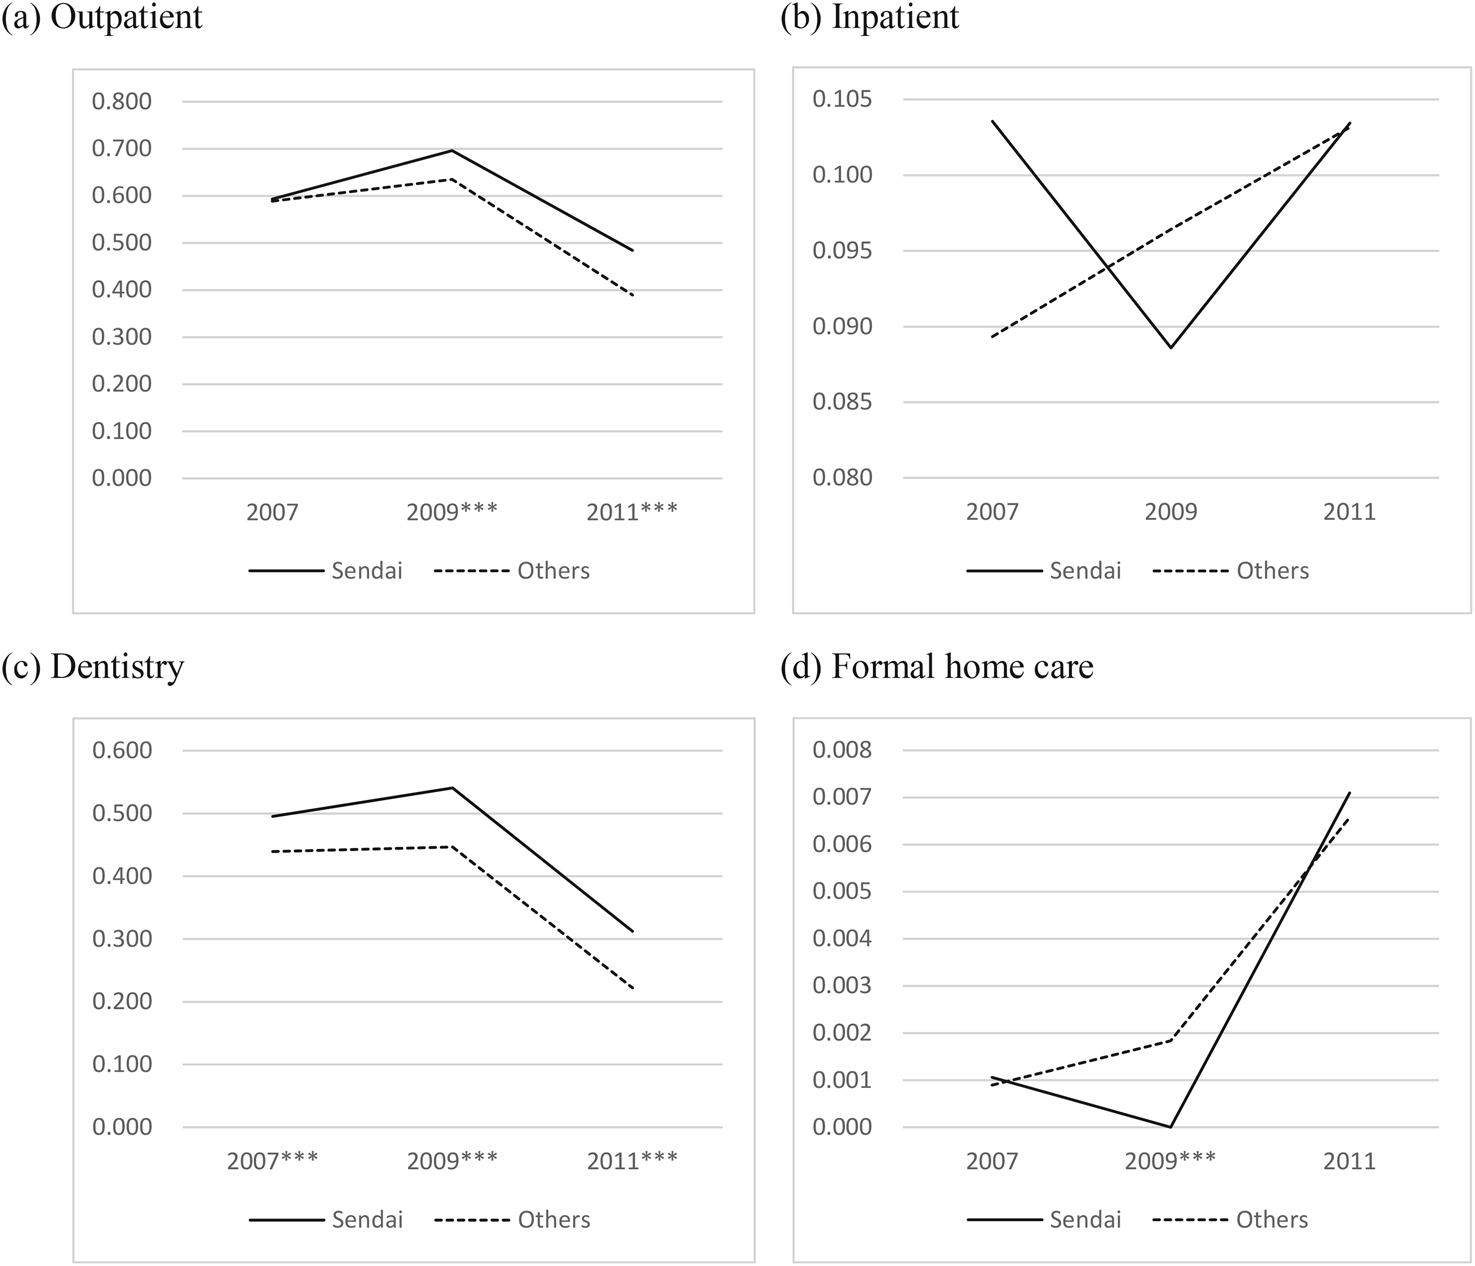
Figure 3. Health care utilization by Groups.
Notes: ***, **, and * represent statistical significance in the mean differences by year at the 1%, 5%, and 10% levels, respectively.
As shown in Figure 2, subjective health improves from 2007 to 2009 but worsens in 2011, with Sendai residents reporting better health than those in the control group. Chronic disease conditions slightly improved from 2007 to 2009, but in 2011 the proportion of Sendai respondents with chronic diseases sharply increased and slightly exceeded that of the control group. Functional limitation became significantly worse after the GEJE in 2011 for both treatment and control groups, but more so for the treatment group. The proportions of respondents with depression and poor memory function were at about the same level for both groups in 2007 but worsened more for those in Sendai between 2009 and 2011. We also examined the aggregate data to compare the health indicators of the afflicted and the non-afflicted areas and found that all health indicators in the afflicted area were worse than in the other areas (see Figure A1 in Appendix 2).
Figure 3 presents the changes in health care utilization before and after the GEJE by treatment and control group. Utilization of outpatient and dentistry for Sendai is greater than the controls, and both decreased in 2011. Formal home care utilization in Sendai sharply increased in 2011. Although inpatient utilization in the other areas gradually increased during the period, it decreased in 2009 and increased in 2011 for Sendai.
3. Difference-in-differences estimation on health
3.1 Estimation strategy
Because the GEJE disaster is a localized natural disaster, we use a DD approach to examine its effects on health. Previous studies estimated the effect of the GEJE disaster as the average change in the health and medical care utilization in the afflicted area. Specifically, their estimates can be written as E[Y i1 − Y i0|Treat i = 1], where Yit is health status or medical care use of individual i at period t, and Treat is an indicator variable equal to one for the afflicted area and zero elsewhere. This difference includes the effect of both the GEJE disaster and other common macroeconomic conditions, including those discussed in Section 1. To identify the true effect of the GEJE disaster, we use the average difference in the non-afflicted area as the counterfactual, which is denoted asE[Y i1 − Y i0|Treat i = 0]. Because this difference only includes national common shocks around the GEJE disaster, we can identify the average treatment effect of the GEJE disaster alone by taking the DD: DD = E[Y i1 − Y i0|Treat i = 1] − E[Y i1 − Y i0|Treat i = 0]. The key assumption for identification in the DD model is that the trends of health in both groups would be similar without treatment. As shown in Figure 2, every health indicator for both groups, except for symptoms of depression and poor memory function, has a similar trend from 2007 to 2009 before diverging from 2009 to 2011.
Our specified DD model is:

Yit is an individual i's health indicators, with higher values representing worse health conditions in year t. Aftert is equal to 1 for the sample in 2011, representing the period after the GEJE, and zero otherwise. Treati is equal to one for a Sendai resident and zero otherwise. α3 is a DD estimator representing the average treatment effect of the GEJE disaster on health and we expect α3 to be positive if it had an adverse effect on health. xit includes individual i's demographic and socioeconomic status, including gender, age, marital status, yearly gross household income, amount of household financial assets, as well as indicators of having family dependents and owning real estate (housing or land). zit refers to community characteristics which include prefectural or municipal level (see Table 2) macro characteristics, such as medical institution density, nursing care facility density, unemployment rate, and financial capability index, which would also affect health and care utilization. c is an individual fixed effect and u is an error term. We take the first-difference (FD) to eliminate individual effect c and time-invariant variables of x (Wooldridge, Reference Wooldridge2010) and estimate equation (2) using ordinary least squares (OLSs).

In this model, the OLS estimator of α1 represents the year effect and α3 represents the average ‘treatment’ effect of the GEJE disaster on health. In addition, we estimate clustered robust standard errors that allow correlated residuals within municipalities to accommodate any serial correlation (Bertrand et al., Reference Bertrand, Duflo and Mullainathan2004).
It is important to note that sample attrition could be an issue, especially in the third wave of the JSTAR, given the devastating effects of the GEJE on the Tohoku district. We examine this potential sample attrition (see Appendix 3 for further details) but do not find a significant effect. Indeed, our probit estimation result suggests that Sendai respondents had a higher participation rate than those in other regions. Nevertheless, to control for any adverse attrition bias, we employ the inverse weighting modelFootnote 6 (Robins et al., Reference Robins, Rotnitzky and Zhao1995; Wooldridge, Reference Wooldridge2002, Reference Wooldridge2007).
3.2 Empirical results
Table 4 shows the average treatment and time effects of the GEJE disaster (DD estimator) on health indicators. The disaster had significantly adverse effects on all health indicators. Its largest effects were on memory function, indicating that the GEJE increases the probability of having poor memory function by 15.2%. It has also significantly adverse impacts on the probabilities of having difficulties in functional health by 7.2%. We also observe modest, but significant adverse effects on chronic disease (2.8%) and depression (4.5%), but no significant effect on subjective health. However, it should be noted that the number of observations for each outcome varies due to missingness, which may potentially lead to underestimation of the impact on some indicators. As shown in Table 4, missingness is most often observed in the questions assessing depression and memory, and as those with depression and poor memory are more likely to refuse to provide an answer (Fisher et al., Reference Fisher, Hassan, Faul, Rodgers and Weir2017), our results are more likely to underestimate the effects.
Table 4. Effects of the GEJE on health
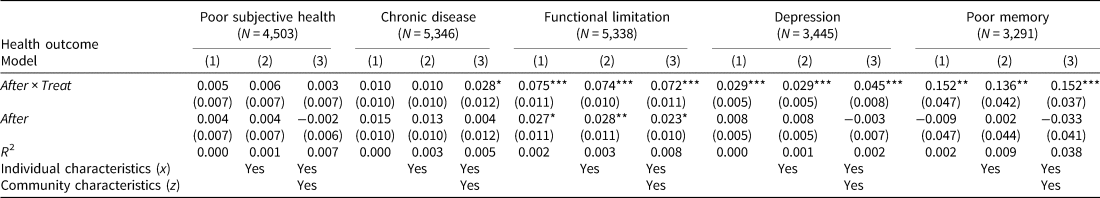
Note: This table reports FD estimates of the effects of the GEJE and years on health outcomes.
***, **, and * represent statistical significance at the 1%, 5%, and 10% levels, respectively. Clustering robust standard errors allowing for correlated residuals within municipalities are in parentheses.
4. Triple differences estimation
Health insurance coverage is an important determinant of access to health care, which in turn may have influenced the effects of the GEJE on health outcomes. One particular idiosyncratic feature of the Japanese public health insurance system offers an opportunity to examine how health insurance coverage may affect those affected by natural disasters. At the age of 70 years, an individual's copayment rate for medical care drops from 30% to 10%. Shigeoka (Reference Shigeoka2014) and Fukushima et al. (Reference Fukushima, Mizuoka, Yamamoto and Iizuka2016) use the regression discontinuity design and find that this reduction increases medical care use by the elderly. However, this copayment reduction can also lead to substitution effects. For example, those aged 70 and older may not only increase the use of medical care (income effect) but also of other goods and services using the savings in copayment (substitution effect). Previous studies have focused exclusively only on the income effect of the copayment while we investigate both the income and substitution effects.
Since the DD estimators in Table 4 include both the direct effect of the GEJE disaster on health and the indirect effect of an increase in care utilization due to income and substitution effects driven by health insurance, the adverse health effect of the GEJE may have been underestimated. Separating these effects can deepen our understanding of how the use of medical and long-term care service helps to improve the health of the afflicted elderly and the role of health insurance after a natural disaster. Specifically, we use a DDDs model to identify these direct and indirect effects.
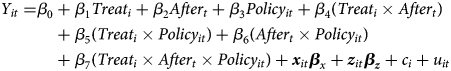
Policyit is a policy dummy variable that equals one if individual i is 70 years or older at year t. β4 is the DD estimator that represents the direct effect of the GEJE disaster on health and is expected to be positive as with equation (1). The coefficients β3 and β6 represent the overall policy effect in control municipalities before and after the disaster, respectively. The coefficients β5 and β7 represent the overall policy effect in Sendai before and after the GEJE disaster, respectively. That is, β7 is the DDD estimator that captures the policy effect after the earthquake in Sendai, which can be interpreted as the indirect effect that is due to the income and/or substitution effect of the discontinuous copayment reduction at age 70. Specifically, if β7 is negatively estimated, it indicates that the reduction in copayment reduces health deterioration caused by the GEJE disaster. We then specify the following FD equation
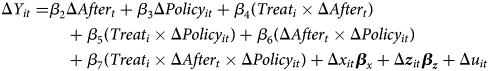
However, there is a potential concern that Policy may substantively capture the age effect on health because this binary variable of policy is an indicator of being 70 years of age and over. To address this concern, we further control the non-linear age effect by adding continuous variables of age and its squares in equation (4):
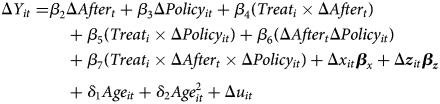
We also estimate the following equation (6) to examine the specific effects of the disaster and how health insurance policies affect the utilization of medical and long-term care services.
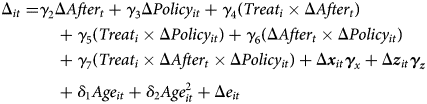
C is a dummy variable that becomes equal to 1 when individual i uses outpatient, inpatient, dentistry, or formal home care. The DD estimator, γ 4, represents the effect of the GEJE disaster on medical and long-term care utilization. If the policy variables, γ 3, γ 5, γ 6, and γ 7 were to have significant positive effects on medical care utilization, they would confirm the income effects identified by Shigeoka (Reference Shigeoka2014) and Fukushima et al. (Reference Fukushima, Mizuoka, Yamamoto and Iizuka2016). Conversely, a substitution effect would exist if the policy variables were to have a significant positive effect on long-term care utilization. The DDD estimator, γ 7, represents the effect of inhibitive effect of health deterioration due to the GEJE disaster. e is an error term.
Moreover, as shown in Table 1, the municipality of Adachi was also affected by the earthquake. Although its human and property damages were very modest, it may influence the estimation results. In Appendix 4, we use the sample without including Adachi to estimate the equations and find that the estimates are very similar to those of the full sample.
In addition, we conduct a placebo experiment by redefining policy variable as the age of 65 to 69 years. Those in this age group are also insured by public long-term care insurance but have higher copayment rates under the Japanese elderly health system. In this placebo experiment, the effect of Policy (being in the age group of 65 to 69 years) in this estimation would be insignificant. Indeed, the results indicate that the coefficients of this placebo Policy variable are insignificant (see Appendix 5 for the estimated results for the placebo experiment).
4.1 Effects on care utilization
Table 5 reports the effects of the GEJE disaster on medical and formal home care utilization. The results of the DD estimators indicate that the GEJE significantly increases inpatient and formal home care utilization by 2.7% and 0.6%, respectively, reflecting a greater need for these services. On the other hand, its effect on outpatient utilization is insignificant, and the utilization of dentistry is negatively influenced by the GEJE by 5.1%. We surmise this was because consumers were no longer able to visit afflicted medical facilities or because most medical staff were treating hospitalized patients and providing greater levels of inpatient care.
Table 5. Effects of the reduction in copayment on care utilization by the DDD model
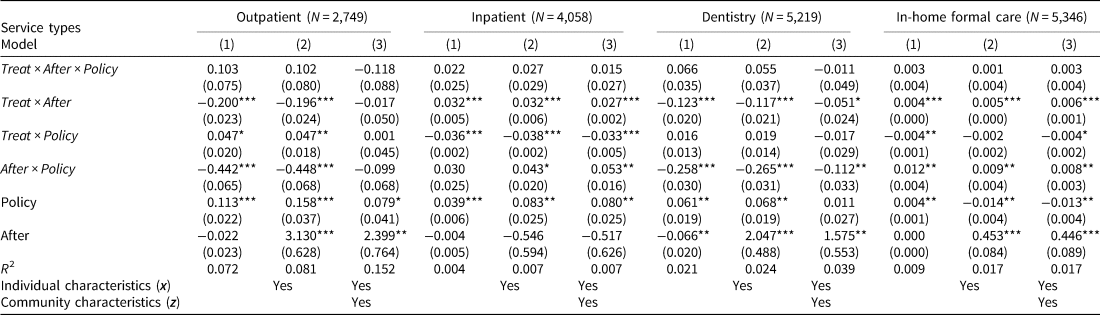
Note: This table reports FD estimates of the effect of the GEJE, the health insurance system, and years on care utilization.
***, **, and * represent statistical significance at the 1%, 5%, and 10% levels, respectively. Clustering robust standard errors allowing for correlated residuals within municipalities are in parentheses.
As a key parameter of interest, DDD estimators are found to be insignificant, indicating that there was no policy effect on health care utilization in afflicted areas. That is, the reduction in copayment did not increase health care utilization among those who were affected by the disaster, suggesting no income effect. These results contradict those of previous studies (Shigeoka, Reference Shigeoka2014; Fukushima, et al., Reference Fukushima, Mizuoka, Yamamoto and Iizuka2016), which may be due to the difference in sample characteristics and potential omitted variable bias. For example, Shigeoka (Reference Shigeoka2014) examined repeated cross-sectional data and estimated the policy effects without accounting for individual heterogeneities over time. Fukushima et al. (Reference Fukushima, Mizuoka, Yamamoto and Iizuka2016) used a sample that represented relatively healthy populations who have worked until the age of 70 years.
4.2. Effects on health
Table 6 shows the effects on health. The DD estimators are significant and positive for all health indicators. These results indicate that the GEJE disaster had a negative impact on individuals' health. Its effect size is especially large on memory, with the probability of poor memory increased by 40%, consistent with what was observed in the descriptive time trend analysis in Figure 2. The adverse effects of the GEJE are also observed in other health domains, but more modestly. Specifically, it significantly increases the probabilities of having limitations in functional health, showing depressive symptoms, having a chronic disease, and reporting poor subjective health by 7.8%, 3.6%, 2.9%, and 2.1%, respectively. The size of the impact, except for symptoms of depression, is larger than those presented in Table 4. This indicates that the DD estimators in Table 4 are underestimates because they include both the negative direct and indirect effects of the GEJE.
Table 6. Effects of the Reduction on Copayment on Health by the DDD model
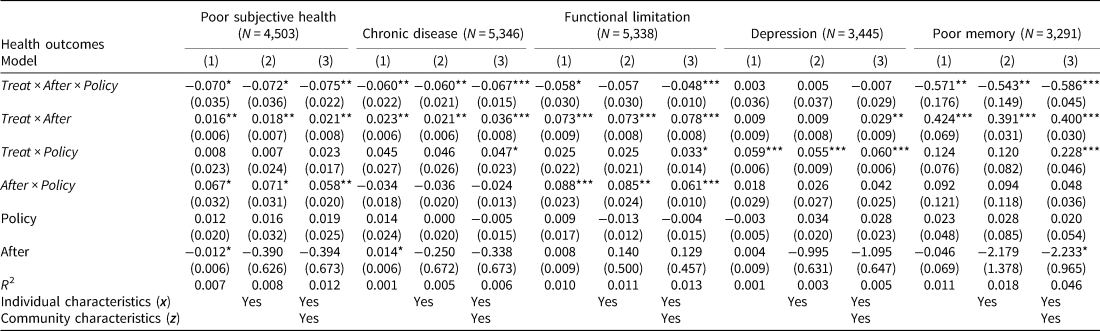
Note: This table reports FD estimates of the effect of the GEJE, the health insurance system, and years on health outcomes. ***, **, and * represent statistical significance at the 1%, 5%, and 10% levels, respectively. Clustering robust standard errors allowing for correlated residuals within municipalities are in parentheses.
The effects of the DDD estimators are significantly negative, except for symptoms of depression. These results indicate that copayment reduction in public health insurance reduced health deterioration caused by the GEJE with the exception of depression. Again, the largest effect is observed for memory, comprising most of the harmful effects of the GEJE. We observe modest effects of the copayment reduction on other health domains, including self-reported health, chronic diseases, and functional limitations, ranging from about 4.8 to 7.5 percentage points.
5. Conclusion
We investigated the protective effects of health insurance against disaster by exploiting the 2011 GEJE disaster and the Japanese public health insurance scheme. We find that the disaster had a severely negative impact on various health conditions among afflicted individuals and that the reduction of copayments showed protective health effects. Specifically, we find that a discontinuous decline in the copayment rate for medical care at age 70 had protective effects against the GEJE on subjective health, chronic diseases, functional health, and cognition, but insignificant effects on depression. These results imply that for those afflicted by unforeseen catastrophic disasters, subsidies in the form of reduced copayment rates are effective in improving health. Further, we found that the copayment reduction did not lead to an increase in health care utilization against the disaster, suggesting the protective effects of policy is mainly through a substitution effect. However, it is important to note that policy itself has a positive effect on health care utilization. These findings suggest that the copayment reduction is effective in promoting health care utilization, but at the time of disasters, resources generated from the copayment reduction are channeled to other needs, suggesting the importance of income support for older adults at the time of disaster.
Our work has some limitations. First, the current JSTAR datasets do not have actual medical and long-term care service records for respondents. Research for health policy can benefit from more detailed information, such as claims data. Second, the generalizability of our findings is confined to the ten municipalities involved in JSTAR. To the best of our knowledge, there is no nationally representative panel data with a sufficiently large sample in the disaster area for analysis of health and health care utilization before and after the GEJE. Third, we used an indicator of being 70 years of age and over as the policy indicator for the reduction in copayment rate. Although our investigation controlling for age and including age square controls for potential non-linearity of age effects, and our placebo experiment using different age groups yielded supportive evidence for the robustness of our findings, it is difficult to rule out other potential non-linearity in the age-health correlation. Fourth, we lack information on temporary relief in the afflicted area. In Miyagi prefecture, which includes Sendai, the central and prefectural governments temporarily covered all copayments of medical expenditures for patients with GEJE disaster-victim certificates, which were provided to those with property damage. Because the JSTAR does not have information on the damages each individual suffered, it is unclear how this policy affects our results. Further analyses using other, nationally representative data would help confirm our findings.
Acknowledgments
We appreciate the editor and the two anonymous referees for useful comments and suggestions and benefited from thoughtful discussion among the seminar participants of the Japan-Singapore Academic Forum on Aging organized by Hitotsubashi University and Singapore Management University and the annual conference of the Korean Association of Public Finance. We also thank the JSTAR team of the Research Institute of Economy, Trade, and Industry in Japan for their support. The authors assume responsibility for any errors. This study was supported by research grants from the Japan Society for Promotion of Science (No.26780180 and No.18K01665) and the National Institute on Aging (2R01 AG030153).
Supplementary material
The supplementary material for this article can be found at https://doi.org/10.1017/S1474747221000214.


 Open access