


1 Introduction
This article reports an acoustic study of the liquids /l/ and /ɹ/ in English, with a focus on variation between ethnically ‘British Asian’ and ‘British Anglo’ speakers of English. Previous research suggests that second-generation British Asian speakers may produce ‘clearer’ /l/s than monolingual Anglo speakers from the same geographical region (Heselwood & McChrystal Reference Heselwood and McChrystal2000, Stuart-Smith, Timmins & Alam Reference Stuart-Smith, Timmins, Alam, Gregersen, Parrott and Quist2011). This study aims to tests this hypothesis, analyse data on /ɹ/ from the same group of speakers, and examine whether sociophonetic variation interacts with positional and phonological differences in liquids. The analysis reports spectral data on /l/ and /ɹ/ in four positional contexts (word-initial, word-medial trochaic, word-medial iambic, word-final), including time-varying formant data on vocalic–liquid intervals. In doing so, this article contributes to work on the acoustics of liquid consonants in British English (Carter Reference Carter, Local, Ogden and Temple2003, Carter & Local Reference Carter and Local2007), as well as further documenting the social correlates of phonetic variation (Foulkes & Docherty Reference Foulkes and Docherty2006, Foulkes, Scobbie & Watt Reference Foulkes, Scobbie, Watt, Hardcastle, Laver and Gibbon2010).
1.1 Variation in British English liquids
English has two liquid phonemes: an oral lateral approximant /l/ and an oral rhotic approximant /ɹ/. Laterals and rhotics require the coordinated timing of multiple lingual and labial articulations (Alwan, Narayanan & Haker Reference Alwan, Narayanan and Haker1997, Narayanan, Alwan & Haker Reference Narayanan, Alwan and Haker1997, Campbell et al. Reference Campbell, Gick, Wilson and Vatikiotis-Bateson2010) and the term ‘liquids’ is commonly used to group these consonants because they tend to pattern together distributionally. For example, the approximants /l ɹ j w/ occur as onset consonants in English and do not occur in initial position of word-initial clusters, but the liquids are the only approximants that occur in word-final clusters before non-syllabic nasals (Carter & Local Reference Carter and Local2007: 183). However, even within the categories ‘lateral’ and ‘rhotic’ there is extensive heterogeneity, meaning that such groupings must be treated with caution if we wish to uncover more specific details about their production (Ladefoged & Maddieson Reference Ladefoged and Maddieson1996: 212, 244; Lawson et al. Reference Lawson, Stuart-Smith, Scobbie, Yaeger-Dror, Maclagan, Di Paolo and Yaeger-Dror2011: 73).
Positional variants of the oral lateral approximant in English are well documented, most commonly discussed in terms of ‘clear/light’ and ‘dark’ allophones (e.g. Sproat & Fujimura Reference Sproat and Fujimura1993). Clearness and darkness usually refer to varying degrees of tongue body retraction and the timing relationship between the coronal and dorsal constrictions involved in lateral production. Descriptions of Southern British English varieties often state that clear /l/ occurs in syllable-onsets and that dark or velarised /l/ occurs in syllable-rimes (Wells Reference Wells1982: 370). However, many Northern British English varieties have darker /l/s in all positions (e.g. Leeds) and some have clearer /l/s in all positions (e.g. Newcastle; Carter & Local Reference Carter and Local2007). Clear and dark rhotics also occur in English (Kelly & Local Reference Kelly and Local1986), but the use of the ‘clear/dark’ terminology to describe rhotic sounds is comparatively rare in the literature (Carter Reference Carter, Local, Ogden and Temple2003: 241).
The primary acoustic correlates of clearness and darkness in liquids are the F1 and F2 frequencies. Generally speaking, clear liquids have high F2 and low F1, while dark liquids have low F2 and high F1 (Lehiste Reference Lehiste1964, Ladefoged & Maddieson Reference Ladefoged and Maddieson1996, Local & Simpson Reference Local and Simpson1999, Tunley Reference Tunley1999, Carter Reference Carter2002, Carter & Local Reference Carter and Local2007, Recasens Reference Recasens2012). Consequently, some studies have taken F2−F1 as a measure of clearness/darkness, with higher values suggesting clearer realisations (Lehiste Reference Lehiste1964, Sproat & Fujimura Reference Sproat and Fujimura1993, Carter Reference Carter2002, Nance Reference Nance2014). Stevens (Reference Stevens1998: 543) reports that F3 is related to the size of the back cavity in lateral production, with higher values indicating a smaller back cavity. Lip rounding and protrusion can also raise F3, but this effect may be more pronounced in the case of clearer laterals (Recasens & Espinosa Reference Recasens and Espinosa2005: 11).
Many sociophonetic studies of British English liquids have focused on rhoticity in postvocalic contexts, especially in Scottish English (Stuart-Smith Reference Stuart-Smith2007, Lawson et al. Reference Lawson, Stuart-Smith, Scobbie, Yaeger-Dror, Maclagan, Di Paolo and Yaeger-Dror2011), as well as on labiodental rhotics (Foulkes & Docherty Reference Foulkes and Docherty2000), and vocalised laterals (Stuart-Smith, Timmins & Tweedie Reference Stuart-Smith, Timmins and Tweedie2006). Considerably fewer acoustic studies have examined British English rhotics in syllable-initial contexts, but one such example is Carter & Local (Reference Carter and Local2007), who examine F2 differences in the Newcastle and Leeds English liquid systems. They find that previous descriptions regarding the two varieties are generally accurate, with Newcastle speakers producing clearer /l/s than Leeds speakers, which supports claims of dialectal variation in British English liquids. They also confirm Kelly & Local's (Reference Kelly and Local1986, Reference Kelly and Local1989) observation of a polarity effect in liquid systems, whereby varieties with clearer /l/s are more likely to have darker /ɹ/s in the same positions, and varieties with darker /l/s are more likely to have clearer /ɹ/s. McDougall & Jones (Reference McDougall and Jones2011) report a similar polarity effect for Australian English liquids. These results suggest that attending to /l/–/ɹ/ relationships may be an important factor in characterising liquid realisations by speakers of different varieties. I discuss further sociophonetic work on liquids in British Asian English in Section 1.2.
1.2 British Asian English and Sheffield English
‘British Asian English’ is a term commonly used to describe a variety of British English spoken by second-generation immigrants from the Indian subcontinent (e.g. Lambert, Alam & Stuart-Smith Reference Lambert, Alam and Stuart-Smith2007, Kirkham Reference Kirkham2011, Sharma & Sankaran Reference Sharma and Sankaran2011; see also Heselwood & McChrystal Reference Heselwood and McChrystal2000, Wormald Reference Wormald2015 for the use of the term ‘Panjabi-English’). Most speakers of British Asian English have their family origins in what are now modern-day India and Pakistan. However, the broadness of this term obscures a wide range of geographical and linguistic backgrounds, so it is worth clarifying that the British Asian speakers in the present study are all second-generation native speakers of British English, whose families come from the Mirpur District of Pakistan and all of whom identify as Muslim. My use of the term ‘Anglo’ refers to speakers who identify as ethnically ‘White British’ in terms of the UK's 2011 Census categories. The terms ‘Asian’ and ‘Anglo’ are necessarily broad, but are adopted here for comparability with other studies (e.g. Lambert et al. Reference Lambert, Alam and Stuart-Smith2007, Cheshire et al. Reference Cheshire, Kerswill, Fox and Torgersen2011, Sharma & Sankaran Reference Sharma and Sankaran2011, Stuart-Smith et al. Reference Stuart-Smith, Timmins, Alam, Gregersen, Parrott and Quist2011). See Kirkham (Reference Kirkham2015) for a more detailed discussion of the nature of identity and ethnicity in a multiethnic community in Sheffield.
British Asian English is often characterised by a number of salient phonetic features, including the use of retracted or retroflex realisations of /t/ (Heselwood & McChrystal Reference Heselwood and McChrystal2000, Alam Reference Alam2007, Kirkham Reference Kirkham2011, Sharma & Sankaran Reference Sharma and Sankaran2011, Alam & Stuart-Smith Reference Alam and Stuart-Smith2011), clearer allophones of /l/ (Heselwood & McChrystal Reference Heselwood and McChrystal2000, Stuart-Smith et al. Reference Stuart-Smith, Timmins, Alam, Gregersen, Parrott and Quist2011), and more monophthongal realisations of the face and goat vowels (Stuart-Smith et al. Reference Stuart-Smith, Timmins, Alam, Gregersen, Parrott and Quist2011, Wormald Reference Wormald2015). These features are typically hypothesised to originate in cross-language influence from Panjabi or Urdu, which are languages spoken by many British Asians. Panjabi and Urdu are the third and fourth most widely spoken L1s in the UK according to the 2011 Census (after English and Polish), but it is possible that the varieties of Panjabi and Urdu spoken in the United Kingdom differ from those spoken in countries where they are a majority language (Heselwood & McChrystal Reference Heselwood and McChrystal1999; see also McCarthy, Evans & Mahon Reference McCarthy, Evans and Mahon2013). This situation is further complicated by the fact that some second-generation British Asians may not be regular or proficient users of Panjabi, but have instead acquired British Asian English as a contact variety of English within predominantly British Asian communities (see Cheshire et al. Reference Cheshire, Kerswill, Fox and Torgersen2011 for research on contact varieties in the UK). Therefore, British Asian English is here considered to be a pan-regional contact variety that has received phonetic input from, at least, monolingual native varieties of a range of Indo-Aryan languages, varieties of these languages spoken outside their traditional heartlands, and varieties of British English.
In terms of research on liquids, laterals in Pakistani L2 English are described as clear (Mahboob & Ahmar Reference Mahboob, Ahmar, Schneider, Burridge, Kortmann, Mesthrie and Upton2004) and Wells (Reference Wells1982: 625) claims that varieties of Indian English also have clear /l/ in all positions. Similar findings are reported for second-generation British Asian speakers. Heselwood & McChrystal (Reference Heselwood and McChrystal2000) find that English–Panjabi bilinguals in Bradford produce /l/ in words such as candle as audibly clear in the majority of cases, and a group of phonetically trained listeners also identified these realisations of /l/ as a salient feature of the variety. Stuart-Smith et al. (Reference Stuart-Smith, Timmins, Alam, Gregersen, Parrott and Quist2011) report an acoustic analysis of syllable-initial /l/ in Glasgow and find that second-generation Asian speakers produce /l/ with higher F2 than Anglo speakers, which is suggestive of clearer realisations. However, the F2 values for the Asian speakers are still very low compared to clear /l/s in other varieties, suggesting that Glasgow Asian /l/ is still audibly ‘dark’, but not as dark as the /l/s of the Anglo speakers. This raises the possibility that ethnic variation in Glasgow may be more accurately conceptualised in terms of degree of lateral darkness, thus foregrounding the importance of accounting for the phonetic makeup of minority and majority communities in studies of ethnic variation. In terms of work on /ɹ/, Hirson & Sohail (Reference Hirson and Sohail2007) report that speakers who identify as ‘Asian’ rather than ‘British Asian’ were more likely to be rhotic in their study of London Asian speakers. Heselwood & McChrystal (Reference Heselwood and McChrystal2000: 47) also report occasional rhoticity amongst Bradford Asians. However, rhoticity is not extensively reported in other studies and is likely to be more common amongst older British Asians. To my knowledge, no previous research explicitly focuses on clearness/darkness in /ɹ/ in British Asian English, so there are no straightforward predictions in the literature regarding /ɹ/ realisation in this variety.
While the term ‘British Asian English’ suggests some common features, there is also likely to be regional variation (Stuart-Smith et al. Reference Stuart-Smith, Timmins, Alam, Gregersen, Parrott and Quist2011, Wormald Reference Wormald2015). Therefore, it is important to situate British Asian English in terms of the geographical context relevant to each study. The variety of British Asian English discussed here is located in Sheffield, hence the name ‘Sheffield Asian English’. As such, it is worth considering predictions about monolingual Anglo varieties of Sheffield English. Sheffield Anglo English is generally considered to have dark /l/s, similar to those described for Leeds by Carter & Local (Reference Carter and Local2007). However, in their auditory description of Sheffield Anglo English, Stoddart, Upton & Widdowson (Reference Stoddart, Upton, Widdowson, Foulkes and Docherty1999: 76) claim that ‘[l]aterals are normally clear, but dark [ɫ] is found occasionally in final position’. This claim contrasts with more recent acoustic evidence from a study of present-day Sheffield English (Kirkham Reference Kirkham2013). So, while I hypothesise that Sheffield Anglo English /l/ is ‘dark’, the present study aims to provide further data on the acoustic status of /l/ in this variety. Given that Sheffield Anglo English is predicted to have dark /l/ and varieties of British Asian English are predicted to have clear /l/, it is expected that there will be substantial differences between Anglo and Asian speakers in /l/ realisation.
1.3 Hypotheses
The hypotheses (Hs) tested in this study are:
-
H1: Asian speakers will produce /l/ with higher F2−F1 values than Anglo speakers.
-
H2: Asian speakers will distinguish final and non-final /l/ in F2−F1, whereas Anglo speakers will not distinguish final and non-final /l/ in F2−F1.
-
H3: Asian speakers will produce /l/ with higher F2−F1 values than /ɹ/, and Anglo speakers will produce /ɹ/ with higher F2−F1 values than /l/.
-
H4: Asian speakers will produce /l/ and /ɹ/ in word-medial trochaic contexts (e.g. belly, berry) with much higher F2−F1 values than Anglo speakers over the entire trajectory of the liquid–V2 interval (but not during V1 of the V1–liquid–V2 interval).
H2 is grounded in Recasens & Espinosa's (Reference Recasens and Espinosa2005) finding that clear /l/ dialects of Catalan show positional differences between final and non-final contexts, but dark /l/ dialects do not (although see Carter & Local Reference Carter and Local2007 for positional differences in a dark /l/ variety of English). H4 is grounded in previous work that finds substantial differences in the happy vowel between Anglo and Asian speakers of Sheffield English (Kirkham Reference Kirkham2015). Time-varying differences across the vocalic–liquid interval are therefore expected to be much larger in magnitude in this context due to expected differences in the resonance of the liquid, the quality of the vowel, and the coarticulatory relationship between the two.
2 Method
2.1 Subjects and materials
Speech data were collected from four Anglo and four Asian speakers of Sheffield English, aged between thirteen and fourteen years old, with two female and two male speakers in each ethnic group. All of the Asian speakers self-identified as ethnically Pakistani (second generation) and all had their family origins in the Mirpur District of Pakistan. All speakers were students at the same secondary school in Sheffield and all had been born in Sheffield and lived there since birth. Only speakers who came from neighbourhoods that were significantly more socioeconomically deprived than the average for Sheffield were selected to take part in the experiment, which was determined based on the basis of local area statistics for each speaker's home address. The Anglo speakers are monolingual native British English speakers and the Asian speakers are native British English speakers and have some knowledge of Panjabi (Mirpuri). None of the Asian speakers reported using Panjabi to any considerable degree at home, but had awareness of the language due to exposure in the home. Attempts to elicit Panjabi words via a lexical translation task were largely unsuccessful.
The stimuli for this study are drawn from a larger corpus of 267 words that aimed to capture a range of sounds, including coronal stops (Kirkham Reference Kirkham2011), vowels, and liquids. The liquids part of the word list comprised the twenty words used in Carter & Local's (Reference Carter and Local2007) study (see also Kelly & Local Reference Kelly and Local1986, West Reference West2000). All liquid words were embedded in the carrier phrase ‘It uttered ____’ for comparability with previous research (Carter & Local Reference Carter and Local2007, see West Reference West2000 for a similar carrier phrase). All words were minimal pairs for /l/ and /ɹ/ in either a front vowel or back vowel context, except for word-final tokens, for which only /l/ words were elicited. Stimuli were presented one at a time on a computer screen in a randomised order. Each token was repeated three times by eight speakers, resulting in 480 tokens overall. The word list is provided in Table 1.
Table 1 Words used for eliciting liquid consonants in different vowel contexts and positional contexts.

As shown in Table 1, data were collected on liquids in four contexts: word-initial, word-medial trochaic (post-accentual), word-medial iambic (pre-accentual), and word-final (also utterance-final). Words with word-final rhotics were not included because Sheffield English is a non-rhotic variety and there is no evidence of rhoticity in the adolescent Sheffield Asian community in a larger corpus of spontaneous speech (Kirkham Reference Kirkham2013).
2.2 Data collection and processing
Data collection was carried out in a quiet room at a school. Audio was recorded using a Beyerdynamic Opus 55 headset microphone through a Rolls LiveMix pre-amplifier and Behringer UCA-202 audio interface onto a laptop computer. The microphone was positioned 3 cm from the speaker's mouth at approximately 30° off-axis. Audio signals were recorded as 44.1 kHz WAV files with 16-bit quantisation. These signals were high-pass filtered at 70 Hz to reduce any low frequency rumble and low-pass filtered at 11 kHz. The data were labelled in Praat for two intervals: (i) liquid steady state, and (ii) the entire vocalic and liquid interval. The idea of a steady state for liquids is an approximation, but, consistent with previous research, it was possible to identify a relatively stable region of F2 between the transition into and out of the liquid (Carter & Local Reference Carter and Local2007: 187; Nance Reference Nance2014: 7). Accordingly, the onset and offset of the liquid steady state were defined as the onset and offset of an approximately steady region of F2 as visible on the spectrogram. The entire vocalic and liquid interval included the vowel–liquid–vowel portion for medial liquids and the liquid–vowel or vowel–liquid portion for initial and final liquids. Vowel onsets/offsets were defined as the onset/offset of F2 on the spectrogram. An example of the labelling of the liquid steady state for a clear /l/ and a dark /l/ in the word belly is shown in Figure 1. These tokens show demonstrably different acoustic characteristics, particularly in terms of the F2 frequency, and are distinctly audible as very clear (left token) and very dark (right token).

Figure 1 Example acoustic representations of the word belly (left: Asian male speaker's production; right: Anglo male speaker's production). Vertical lines represent the onset and offset of the labelled liquid steady state.
The data were converted to an Emu file format for signal processing and subsequent analysis (Harrington Reference Harrington2010). Formant estimation of F1, F2 and F3 was carried out in Emu using Linear Predictive Coding with a prediction order of 19 and no pre-emphasis. A 35 ms Blackman window with a 5 ms window shift was used to obtain estimates across the entire signal file. The accuracy of formant estimation was judged by overlaying the obtained formant tracks on wide-band spectrograms and formant tracks were hand-corrected where necessary using Emu's formant correction tool. Corrections were made when the estimated formant values were visibly divergent from the formants that could be observed on the spectrogram. Estimates for F1, F2 and F3 were then automatically extracted at the midpoint of the labelled steady state for each liquid token and transformed to the Bark scale using the formula in Traunmüller (Reference Traunmüller1990).
The measurement used to quantify clearness and darkness is F2 minus F1 (F2−F1). This has previously been used to quantify variation in liquid quality (Lehiste Reference Lehiste1964, Sproat & Fujimura Reference Sproat and Fujimura1993, Carter Reference Carter2002, Nance Reference Nance2014) and has the advantage of capturing the relationship between F1 and F2 that characterises clearness/darkness (low F1 and high F2 for clearer liquids; high F1 and low F2 for darker liquids). This measurement also has the advantage of providing a degree of vocal tract normalisation because it quantifies the relationship between formants, which ought to better facilitate comparison between speakers with different vocal tract lengths (e.g. Syrdal & Gopal Reference Syrdal and Gopal1986). The analysis focuses exclusively on the F2−F1 Bark measurements, but, in order to facilitate comparisons with other studies, the group means and standard deviations for F1, F2 and F3 in Hertz are presented in the appendix.
2.3 Statistical analysis
Two types of analysis were carried out based on the two kinds of data described in Section 2.2. For the liquid midpoint analysis, linear mixed-effects regression models were fitted to the F2−F1 values. As the main focus is on variation between ethnic groups, separate models are reported for /l/ and /ɹ/ in Sections 3.1 and 3.3, but models comparing /l/ and /ɹ/ are reported in Section 3.5. In each case, the outcome variable is F2−F1 in Bark and the predictor variables are ethnicity (Anglo vs. Asian), gender (female vs. male), position (initial vs. medial trochaic vs. medial iambic vs. final), and interactions between ethnicity, gender, and position. Baseline variables for the regression models are Anglo (ethnicity), female (gender) and initial (position). Speaker and lexical item are included as random intercepts in order to appropriately model speaker-level and word-level variation (see Baayen Reference Baayen2008: 241–242). In all cases, p-values were calculated using the Satterthwaite approximation via the lmerTest package in R.
For the time-varying formant analysis, a Smoothing Spline Analysis of Variance (SS-ANOVA) model was fitted to the formant frequency data (see Gu Reference Gu2013 for a mathematical overview and Davidson Reference Davidson2006 for a non-technical introduction for linguists). Davidson (Reference Davidson2006) uses SS-ANOVA for quantifying differences in tongue shape in ultrasound tongue imaging data and recent studies have extended this method to analysing time-varying formant frequency data in laterals (Simonet, Rohena-Madrazo & Paz Reference Simonet, Rohena-Madrazo, Paz, Colantoni and Steele2008, Nance Reference Nance2014). SS-ANOVA is a form of non-parametric regression that fits piecewise polynomials between individual data points (or ‘knots’) in order to fit a smooth curve to a data series (Gu Reference Gu2013: 34–40). A smoothing parameter constrains the model to arrive at an appropriate amount of smoothness, which is determined automatically using the generalised cross validation method (Craven & Wahba Reference Craven and Wahba1979, Gu Reference Gu2013). The SS-ANOVA then compares the model terms in order to assess whether the fitted curves are significantly different from each other. 95% Bayesian confidence intervals can be constructed around the fitted curves and plotted in order to visually observe the specific time points at which particular curves differ. The SS-ANOVA has advantages over other methods, such as fitting polynomials to entire formant trajectories, because it does not make any prior assumptions about the shape of the trajectory (Davidson Reference Davidson2006: 410).
For the SS-ANOVA, F2−F1 values were extracted at eleven proportional points across the duration of the liquid–vowel (initial tokens), vowel–liquid–vowel (medial tokens) or vowel–liquid (final tokens) interval. SS-ANOVA models were then fitted to the F2−F1 data across these intervals using the gss package in R (Gu Reference Gu2014). The F2−F1 measurement was chosen for comparability with the single time-point analysis. Graphical representations of the SS-ANOVA model fits were checked against spectrograms in order to ensure that time normalisation and the fitting procedure had not significantly distorted typical patterns of formant movement. These plots were also visually checked against separate SS-ANOVA models of F1 and F2 to ensure that the F2−F1 measurement accurately represents the relationship between formants over time. The graphical representation of the SS-ANOVA model fit is reported here, which represents the distance between F2 and F1 over time, rather than the movement of a single formant over time. The plots show mean trajectories and 95% Bayesian confidence intervals for each group over proportional time, and two groups can be considered significantly different from each other at the points where their confidence intervals do not overlap. No attempts are made to indicate segmental boundaries between the liquid and its surrounding vowels; instead, the analysis focuses on overall F2−F1 trajectories across the liquid–vocalic interval.
3 Results
3.1 Laterals: Midpoint formant analysis
Figure 2 shows boxplots of F2−F1 values for /l/ in word-initial, word-medial trochaic, word-medial iambic and word-final position, grouped by ethnicity and gender.

Figure 2 F2−F1 values (Bark) for /l/ across four positions grouped by ethnicity and gender (m = male speakers; f = female speakers). N = 288.
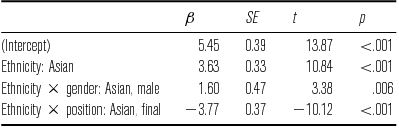
The F2−F1 regression model for /l/ is reported in Table 2. The model shows significant effects of ethnicity, ethnicity × gender, and ethnicity × position. Asian speakers produce higher F2−F1 values overall and this difference is largest in initial and medial contexts, with almost zero overlap between the distributions for Anglo and Asian speakers in non-final contexts (see Figure 2). The interaction between ethnicity and gender shows that Asian males produce slightly higher F2−F1 values than female speakers. The table in the appendix suggests that this is not just a matter of Asian males generally having lower F1 values as they also produce higher F2 values than Asian females across every position. This is surprising in light of previous research that shows higher F2 frequencies for females (Whiteside Reference Whiteside2001, Simpson Reference Simpson2002), but this result may be suggestive of a gender-related sociophonetic difference in this community, with Asian males producing slightly clearer realisations of /l/ than Asian females.
Table 2 Final linear mixed-effects regression model for F2−F1 in /l/ (Bark values). The model intercept represents Anglo females producing /l/ in word-initial position. Random intercepts are speaker and word.
An interaction between ethnicity and position shows that Asian speakers produce much lower F2−F1 values in word-final position compared to initial tokens. This is strong evidence that Asian speakers show positional differences between non-final and final tokens, whereas the Anglo speakers show no positional differences. There are no significant differences between any of the groups in word-final /l/. An auditory analysis found that seven out of eight speakers produced every token of final /l/ with at least some audible laterality. One Asian female speaker produced /l/ without audible laterality in 5/12 word-final tokens, which sound lightly vocalised. Otherwise, all final /l/s were audibly lateral and dark.
Overall, Asian speakers produce initial and medial /l/s with higher F2−F1 values than Anglo speakers, which suggests that Asian speakers produce much clearer /l/s in non-final position. There are no positional differences for the Anglo speakers, with very low F2−F1 values across contexts, whereas the Asian speakers produce much lower F2−F1 values in word-final contexts compared to initial and medial contexts. This suggests that Anglo speakers produce darker /l/s in all positions, whereas Asian speakers produce clearer /l/s in initial and medial position and darker /l/s in final position.
3.2 Lateral and vocalic intervals: Time-varying formant analysis
Section 3.1 shows large differences between ethnic groups in terms of F2−F1 at the midpoint of the lateral steady state, but liquids also vary in their formant trajectories across the liquid, as well as in the adjacent vowels (Olive, Greenwood & Coleman Reference Olive, Greenwood and Coleman1993: 204–215). Figure 3 shows the time-varying F2−F1 values for the four different contexts, which takes the form of a graphical representation of the SS-ANOVA output on the F2−F1 data.

Figure 3 SS-ANOVA model fits for F2−F1 values in /l/ across the liquid-vowel interval (initial tokens), vowel-liquid-vowel interval (medial tokens) or vowel-liquid interval (final tokens), grouped by ethnicity and gender. N = 288. Lines represent mean values and shaded areas represent 95% Bayesian confidence intervals. Asian speakers are shown in solid lines and Anglo speakers are shown in dashed lines. Female speakers are shown in the lighter shade and male speakers are shown in the darker shade.
The top left panel in Figure 3 shows the word-initial tokens, for which the greatest differences between Anglo and Asian speakers occur during the first 30% of the /l/–vowel interval, with no differences during the final 40%. This is highly suggestive of large ethnic differences across the lateral, but not the following vowel, which supports the claim that Asian speakers produce clearer initial /l/s than Anglo speakers. The top right panel shows the word-medial trochaic tokens, which shows the greatest differences of the three positions. There is some overlap in the first 12.5% of this interval, which is likely to represent the onset of the vowel preceding /l/, which was either /ɛ/ or /a/. There is then considerable divergence between Anglo and Asian speakers in F2−F1 values between 25–100%, which represents the /l i/ sequence in belly/Bally. The mid-part of this is likely to represent the lateral phase, which reflects the statistical analysis of midpoint values. However, the latter phase of this interval also shows striking differences between Anglo and Asian speakers, suggesting variation in the realisation of the vowel at the end of belly/Bally, which is sometimes referred to as the happy vowel (Wells Reference Wells1982, Harrington Reference Harrington2006). Kirkham (Reference Kirkham2015) also finds sociophonetic differences in Sheffield English /l/ + happy vowel sequences in a larger corpus of spontaneous speech, with two groups of Pakistani, Somali and middle-class Anglo speakers producing an acoustically higher and fronter vowel in this context when compared with two groups of predominantly White & Black Caribbean and working-class Anglo speakers.
The bottom left panel displays the word-medial iambic tokens, which show smaller differences between the ethnic groups than the word-medial trochaic tokens. The largest differences occur around the 20–50% time-point, with Asian speakers producing higher F2−F1 values. This point is likely to represent the lateral phase and is, therefore, reflective of the /l/ steady state results. Finally, the bottom right panel shows the word-final tokens, for which there is considerable overlap between all groups, indicating no significant differences across the entire vowel–/l/ interval. Observation of separate F1 and F2 trajectories confirms that the groups do not differ in either F1 or F2 in final position. These results therefore reflect the lack of significant differences between groups in the word-final /l/ steady state analysis.
3.3 Rhotics: Midpoint formant analysis
Figure 4 shows boxplots of F2−F1 values for /ɹ/ in word-initial, word-medial trochaic and word-medial iambic positions, grouped by ethnicity and gender.

Figure 4 F2−F1 values (Bark) for /ɹ/ across three positions grouped by ethnicity and gender (m = male; f = female). N = 192.
The F2−F1 regression model for /ɹ/ is reported in Table 3. The model shows significant effects for ethnicity and a three-way interaction between ethnicity × gender × position. Overall, Asian speakers produce higher F2−F1 values than Anglo speakers, but it is notable that this effect is considerably smaller than that seen for /l/. For example, the regression estimate for Asian speakers is 3.63 Bark for /l/ and 1.27 Bark for /ɹ/, but this underrepresents the magnitude of the difference as the /l/ estimate also includes word-final tokens, which will result in a lower overall value. Figure 4 shows that this effect of ethnicity in /ɹ/ is strongest for word-medial trochaic contexts, as there is quite a lot of overlap between the Anglo and Asian distributions for initial and medial iambic contexts. There is also is a significant interaction between ethnicity, gender and position, with Asian males producing higher F2−F1 values than Asian females in word-medial trochaic contexts.
Table 3 Final linear mixed-effects regression model for F2−F1 in /ɹ/ (Bark values). The model intercept represents Anglo females producing /ɹ/ in word-initial position. Random intercepts are speaker and word.
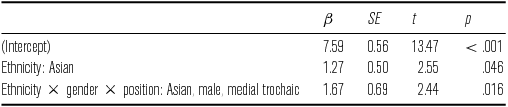
Other than the three-way interaction discussed above, there are no significant effects of position, suggesting that none of the groups show initial/medial positional differences in F2−F1 for /ɹ/. Figure 4 shows that the difference between groups only really holds for word-medial trochaic tokens. This contrasts with the very strong group differences in /l/, which were present across all non-final positions.
3.4 Rhotic and vocalic intervals: Time-varying formant analysis
Section 3.3 shows some differences in terms of the formant values at the midpoint of the rhotic steady state, but, for comparability with the lateral results, I also report a time-varying analysis of formant trajectories for the rhotic. Figure 5 shows the time-varying F2−F1 values for the three different contexts, which takes the form of a graphical representation of the SS-ANOVA output on the F2−F1 data.

Figure 5 SS-ANOVA model fits for F2−F1 values in /ɹ/ across the liquid–vowel interval (initial tokens) or vowel–liquid–vowel interval (medial tokens), grouped by ethnicity and gender. N = 192. Lines represent mean values and shaded areas represent 95% Bayesian confidence intervals. Asian speakers are shown in solid lines and Anglo speakers are shown in dashed lines. Female speakers are shown in the lighter shade and male speakers are shown in the darker shade.
The top left panel displays the word-initial tokens, which show relatively few differences between ethnic groups, as indicated by the high degree of overlap. A similar result is shown for the medial iambic tokens (bottom left), which show no differences between the speakers (there are also no differences in F1 or F2 when observed independently). The major difference is in the word-medial trochaic tokens, which show very similar results to /l/. There are few differences in the first 25%, but increasing differences across the 25–100% interval, which represents variation in the rhotic phase and the following vowel. The trend is in the same direction as the /l/ data, with Asian speakers producing higher F2−F1 values during /ɹ/ and the vowel, which is suggestive of ethnic differences in both /ɹ/ and the happy vowel.
3.5 Lateral–rhotic contrasts
Sections 3.1–3.4 focused on comparing how different ethnic groups produce /l/ and /ɹ/ separately, but some of the research reviewed in Section 1.1 also suggests that /l/ and /ɹ/ may exhibit system-related patterning. For instance, Kelly & Local (Reference Kelly and Local1986) and Carter & Local (Reference Carter and Local2007) report a tendency for rhotics to be relatively darker in varieties with clearer laterals, and relatively clearer in varieties with darker laterals, which they term a ‘polarity effect’. Accordingly, I consider the acoustic differences between /l/ and /ɹ/ within each group. Separate mixed-effects models were fitted to the F2−F1 data for each ethnicity/gender pair with liquid (lateral vs. rhotic), position (initial vs. medial trochaic vs. medial iambic) and an interaction between liquid and position as predictor variables, and word as a random intercept. Regression models were also fitted to the F2 data for comparability with Carter & Local (Reference Carter and Local2007), but the direction and significance of the effects for F2 were the same as those for F2−F1 (although the /l/–/ɹ/ differences were slightly larger for the Asian speakers in the F2 data). Accordingly, only F2−F1 values are reported here for consistency with the analyses in Sections 3.1–3.4. Figure 6 shows the F2−F1 data for /l/ and /ɹ/ for individual speakers in each positional context.

Figure 6 F2−F1 values for /l/ and /ɹ/ in word-initial, word-medial trochaic and word-medial iambic position for individual speakers in each ethnic group (m = male; f = female). N = 348.
Overall, the Asian females show no significant F2−F1 differences between /l/ and /ɹ/ in any context. This may be due to variation between these two speakers, however, because Figure 6 shows that Asian f01 (female 01) has slightly higher F2−F1 values for /l/ in both medial contexts, but not necessarily in initial contexts. However, Asian f02 shows very few differences between any contexts and her /ɹ/s even have slightly higher F2−F1 values than her /l/s in medial iambic position. The other ethnicity/gender pairs do show significant differences across all contexts. Asian males produce /ɹ/ with significantly lower F2−F1 than /l/ (β = –2.55, SE = 0.78, p = .008), Anglo females produce /ɹ/ with significantly higher F2−F1 than /l/ (β = 2.14, SE = 0.59, p = .005), and Anglo males produce /ɹ/ with significantly higher F2−F1 than /l/ (β = 1.92, SE = 0.53, p = .005). There are no significant interactions between liquid and position in any of the models, but Figure 6 suggests that the /l/–/ɹ/ difference is largest in word-medial trochaic position for all speakers. The /l/–/ɹ/ contrast is very strong for all Anglo speakers, with very little overlap between the distributions. The two Asian males also show robust distinctions, but generally with smaller differences than the Anglo speakers. Overall, the general trend that emerges is a polarity effect in liquids, with Anglo males and females producing /l/ with lower F2−F1 values than /ɹ/, and Asian males producing /l/ with higher F2−F1 values than /ɹ/.
4 Discussion
The results are discussed in terms of the four hypotheses proposed in Section 1.3. Hypothesis 1 predicted that the Asian speakers in the study would produce /l/ with higher F2−F1 values than the Anglo speakers. This is confirmed by these data, in which there are consistent F2−F1 differences across all non-final contexts. This supports previous research showing that British Asian speakers produce laterals with clearer resonance than their ethnically Anglo peers from the same geographical region (Heselwood & McChrystal Reference Heselwood and McChrystal2000). Stuart-Smith et al. (Reference Stuart-Smith, Timmins, Alam, Gregersen, Parrott and Quist2011) report Glasgow Asian /l/s to be clearer than Glasgow Anglo /l/s, but claim that Glasgow Asian /l/ can still be considered ‘dark’. This is not the case in Sheffield, where the Asian /l/s are audibly very clear and the Anglo /l/s are audibly dark, which is suggestive of a larger ethnic difference in Sheffield than in Glasgow. This highlights the importance of defining liquid resonance in relation to the scope of acoustic sociophonetic variation in the wider community under study.
Hypothesis 2 predicted that Asian speakers would distinguish final and non-final /l/s in terms of F2−F1, but that the Anglo speakers would not. This prediction is confirmed by the data, as the Asian speakers show a demonstrable difference between final and non-final contexts, whereas the Anglo speakers show no positional differences. The fact that the dark /l/ variety (Sheffield Anglo English) does not show positional differences differs from Carter & Local's (Reference Carter and Local2007) Leeds data, in which all /l/s are dark but final /l/s are darker than initial /l/s. Instead, these data follow the trend in Recasens & Espinosa's (Reference Recasens and Espinosa2005) study of two Catalan dialects, with positional variants for clear /l/ varieties and no positional variants for dark /l/ varieties.
Hypothesis 3 predicted that there would be a polarity effect in liquids, with Asian speakers producing higher F2−F1 values for /l/ than /ɹ/, and Anglo speakers producing higher F2−F1 values for /ɹ/ than /l/. Figure 6 showed that this pattern is robust for all of the Anglo speakers, but only for three out of four Asian speakers. It is worth reflecting on whether this represents a true polarity effect, or just an effect of the groups differing from each other in /l/ but not in /ɹ/. The latter scenario could apply to initial and medial iambic tokens, where there are few differences between Anglo and Asian speakers in /ɹ/ and large differences in /l/. However, the word-medial trochaic tokens show almost no overlap between Anglo and Asian speakers in terms of the entire acoustic range of liquid productions. In this context, the relatively ‘dark’ Asian /ɹ/s are still clearer than the relatively ‘clear’ Anglo /ɹ/s, at least on the basis of F2−F1 values. This suggests that Asian and Anglo speakers may also vary in the relationship between elements of their liquid systems.
Carter & Local (Reference Carter and Local2007) found that the dark /l/ variety (Leeds) maintains the /l/–/ɹ/ distinction in all non-final contexts, whereas the clear /l/ variety (Newcastle) only maintains this distinction in initial and medial iambic contexts. However, the majority of Sheffield English speakers in the present study also produce the /l/–/ɹ/ distinction in word-medial trochaic contexts. Carter & Local hypothesise that labiodental realisations of /ɹ/ could be a potential explanation for the lack of /l/–/ɹ/ distinction in F2 in Newcastle English, given that labiodental realisations are more likely to have raised F2 (Carter & Local Reference Carter and Local2007: 197–198; see also Foulkes & Docherty Reference Foulkes and Docherty2000). It is difficult to reliably comment upon labiodental realisations in the present data without articulatory evidence, but an auditory analysis suggests that 28/96 of the Anglo /ɹ/s are audibly labialised, compared with 15/96 of the Asian /ɹ/s. Labialised realisations occur in initial contexts most frequently (37/43) and appear to be used by both groups of speakers. However, there could be more subtle articulatory characteristics of the Asian speakers’ /ɹ/s that may also play a role. For example, a greater proportion of the Asian females’ tokens sound slightly retroflex and sometimes have a slightly devoiced or fricated onset. This does not appear to be reflected in a strong acoustic difference, such as lower F3 (Fant Reference Fant1960: 26; see Appendix), but the acoustic correlates of retroflex rhotics are not straightforward (Ladefoged & Maddieson Reference Ladefoged and Maddieson1996: 244). In summary, labiodental or retroflex realisations of /ɹ/ may not explain these data in a straightforward way, but an ongoing ultrasound study of a similar community may provide further insights into /ɹ/ realisation in British Asian English (for preliminary data see Kirkham & Wormald Reference Kirkham and Wormald2015).
Finally, hypothesis 4 predicted that Asian and Anglo speakers would show the greatest time-varying differences in word-medial trochaic position, due to predicted variation in both the liquid and the happy vowel. This was the case for both /l/ and /ɹ/, which is clearly suggestive of sociophonetic variation in both the liquid consonant and the happy vowel. Kirkham (Reference Kirkham2015) shows that social differences in the happy vowel extend beyond preceding liquid contexts for a larger group of female speakers from the same school. However, despite the fact that both sounds vary independently of each other, it is also expected that coarticulation does play a role in increasing the magnitude of this variation, with higher and fronter vowel realisations being more likely when preceded by a clearer liquid.
One explanation for the origin of the very clear /l/s in British Asian English is the role of heritage language influence. Panjabi is described as having clear laterals (Heselwood & McChrystal Reference Heselwood and McChrystal2000: 57, Mahboob & Ahmar Reference Mahboob, Ahmar, Schneider, Burridge, Kortmann, Mesthrie and Upton2004) and cross-language phonetic influence is more likely when there is a greater degree of phonetic similarity between the relevant sounds in the two languages (Best Reference Best, Judith, Goodman and Nusbaum1994, Flege Reference Flege and Strange1995). However, not all British Asian speakers are actively bilingual and some experience severe ‘first language attrition’ (e.g. de Leeuw Reference De Leeuw2009) during adolescence. Instead, it is possible that the Asian speakers acquired British Asian English (a contact variety) as their native variety of English, because this is what they would hear most frequently in their local communities. The clearer laterals in British Asian English may result from cross-language influence from Panjabi, originally in second-language speakers of English. Over time these realisations have become part of the phonetic repertoire of British Asian English, which is then acquired as a native language variety by second-generation speakers.
An additional explanation for the variation reported in this study is the role of socioindexical factors. The speakers in this sample comprised a peer group from the same school who experienced regular contact with each other, meaning that they would have been regularly exposed to the kinds of variation reported here. Sociolinguistic research on adolescents suggests that groups in close contact may use phonetic variation in order to index social distinctions amongst the peer group (Eckert Reference Eckert2000, Kirkham & Moore Reference Kirkham, Moore, Chambers and Schilling2013). Indeed, an individual's peer group is sometimes a better predictor of variation than ethnicity (Kirkham Reference Kirkham2015) and the very notion of ethnic identity itself is particularly complex and variable (Mendoza-Denton Reference Mendoza-Denton2008, Benor Reference Benor2010). For example, in their study of female British Asian adolescents, Alam & Stuart-Smith (Reference Alam and Stuart-Smith2011) find sociophonetic differences within the same ethnic group, with an individual's orientation towards particular cultural values (i.e. traditional Pakistani values or contemporary western values) patterning with the spectral properties of their /t/ productions. While it is relatively easy to identify heritage language influence as a possible origin for the phonetic differences reported in this study, socioindexical factors may explain why particular speakers use these variants and why other speakers may be more variable (Eckert Reference Eckert2012).
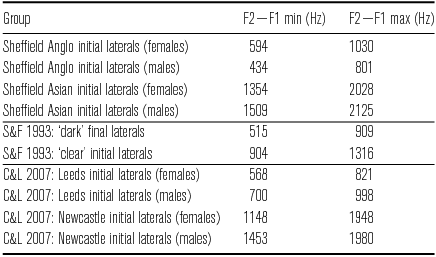
Finally, this study also aimed to address variation in accounts regarding the clearness/darkness of Sheffield Anglo English /l/, which have variably claimed that the variety has primarily clear (Stoddart et al. Reference Stoddart, Upton, Widdowson, Foulkes and Docherty1999) or primarily dark (Kirkham Reference Kirkham2013) laterals in initial position. In order to facilitate comparisons with previous work, Table 2 lists F2−F1 ranges for word-initial laterals in the present study, as well as ‘clear’ word-initial and ‘dark’ word-final laterals from Sproat & Fujimura (Reference Sproat and Fujimura1993), and word-initial laterals for two varieties from Carter & Local (Reference Carter and Local2007). All measurements are from /l/ in high front vowel contexts.
The F2−F1 range for the Sheffield Anglo data is broadly comparable to Carter & Local's (Reference Carter and Local2007) Leeds ‘dark’ /l/ data, while the range for the Sheffield Asian data is also somewhat comparable to the ranges for Carter & Local's Newcastle ‘clear’ /l/ data. The Sheffield Anglo speakers produce initial laterals within a F2−F1 range of 434–1030 Hz and most of these values are within the range for Sproat & Fujimura's ‘dark’ word-final laterals (only one of the Anglo speakers produces an initial token with a F2−F1 value above 900 Hz and, if this speaker is excluded, then the F2−F1 range is 434–893 Hz). Therefore, these data contrast with Stoddart et al.’s (Reference Stoddart, Upton, Widdowson, Foulkes and Docherty1999: 76) claim that Sheffield Anglo English has clear laterals in initial position and instead supports the proposal that Sheffield Anglo English laterals are dark. It is not obvious whether this represents generational change or transcriber perceptions, especially given the small number of speakers in this study (but see Kirkham Reference Kirkham2013, Reference Kirkham2015 for similar findings for medial-trochaic /l/ in larger sample of forty-three speakers). An analysis of /l/ in the word lip in the Survey of Sheffield Usage word list data yields F2−F1 values of 879 Hz (male, born 1910s), 1152 Hz (female, born 1910s), 423 Hz (male, born 1960s), 1133 Hz (female, born 1960s).Footnote 1 It is difficult to make robust claims about such a small data set, but, with the exception of the male speaker born in the 1960s, the three other speakers show higher F2−F1 values than the corresponding Sheffield Anglo speakers in Table 4, with the female speakers in particular being closer to the lower end of the Newcastle clear /l/ range. This suggests that /l/ may have been variably perceptible as clear or dark in previous generations of Sheffield Anglo English, which Wells (Reference Wells1982: 371) describes as typical for some northern accents. However, both the current data and the findings in Kirkham (Reference Kirkham2013, Reference Kirkham2015) suggest that /l/ is likely to be dark in present-day Sheffield Anglo English and has, therefore, potentially become darker over successive generations.
Table 4 F2−F1 range (minimum and maximum values) for word-initial laterals in high front vowel contexts in the present study and for the data reported in Sproat & Fujimura (Reference Sproat and Fujimura1993) and Carter & Local (Reference Carter and Local2007). All values are rounded to the nearest integer.
5 Conclusion
This study provides evidence for a sociophonetic distinction in liquids between ethnic groups in a dialect of British English. Sheffield Asian speakers generally produce clearer /l/s than Sheffield Anglo speakers, which supports previous claims about laterals in varieties of British Asian English. The results also show that these predictions largely hold across three non-final positional contexts, but that there are no significant differences between groups in word-final /l/. The results for the rhotic consonant are more complex and future research into labiodental and retroflex realisations of /ɹ/ is necessary in order to further unpack the patterns reported here. The data also suggest a potential polarity effect in liquids, which supports previous findings on British and Australian English (Kelly & Local Reference Kelly and Local1986, Reference Kelly and Local1989; Carter Reference Carter2002; Carter & Local Reference Carter and Local2007; McDougall & Jones Reference McDougall and Jones2011). Finally, the results suggest that Sheffield Anglo English /l/ can be considered ‘dark’ in word-initial position, which may indicate darkening of /l/ over successive generations. These results can be explained with reference to the acquisition of a contact variety of English and socioindexical factors in speech production.
Acknowledgements
Thanks to Emma Moore, Claire Nance and Gareth Walker for their comments on previous versions of this article, as well as Adrian Simpson, Amalia Arvaniti and three anonymous reviewers for their constructive feedback and suggestions. This work was supported by an Arts & Humanities Research Council Doctoral Award in Linguistics (grant number AH/I50172X/1).
Appendix. Formant frequency values in Hertz
Table A1 F1, F2, F3 values (in Hertz) for /l/ and /ɹ/ grouped by ethnicity and gender across word positions (f = female; m = male). Mean values with standard deviation values are in brackets.


 Open access