Overweight and obesity in childhood are not the same as overweight and obesity in adulthood. In adults, the BMI cut-offs used to define overweight and obesity are based on fixed values of 25 and 30 kg/m2, respectively, which have been shown to be associated with increased adiposity resulting in adverse health consequences( Reference Must, Spadano and Coakley 1 ). In children, body fatness varies according to age and sex, and therefore overweight and obesity are defined on the basis of age- and sex-specific BMI cut-offs( Reference Cole and Lobstein 2 , Reference Barlow 3 ). The ideal definition of overweight and obesity, however, would be based on body fatness, but this is not practical to measure in clinical settings. Increased fatness and central fat distribution are associated with adverse blood lipid concentrations and blood pressure in children, as in adults( Reference Shear, Freedman and Burke 4 , Reference Freedman, Srinivasan and Harsha 5 ). Although children with very high BMI are likely to have high body fat, children who are overweight may have an excess of lean mass as the cause of their increased weight for height( Reference Freedman and Sherry 6 ). Thus, BMI may not be a reliable measurement of body composition for the purposes of health screening in children.
Further, differences in body composition have been reported in infants and children of different ethnicities. For example, South Asian infants had greater fat mass (FM) and less fat-free mass (FFM) than infants of European ethnicity at 6–12 weeks of age( Reference Stanfield, Wells and Fewtrell 7 ), and this difference, including preservation of body fat, has been shown to persist into childhood( Reference D’Angelo, Yajnik and Kumaran 8 ). A New Zealand study looking at body composition using dual-energy X-ray absorptiometry scanning in 2-year-old children whose mothers had gestational diabetes also showed Indian boys had more central and abdominal fat compared with European boys( Reference Rush, Obolonkin and Battin 9 ).
Size at birth also affects weight gain in infancy, childhood and adulthood( Reference Ong 10 , Reference Simmonds, Llewellyn and Owen 11 ), and heavier birth weight is strongly associated with increased risks of overweight and obesity in adulthood( Reference Schellong, Schulz and Harder 12 , Reference Armitage, Poston and Taylor 13 ). However, size at birth is affected by ethnicity( Reference Moser, Stanfield and Leon 14 , Reference Shiono, Klebanoff and Graubard 15 ) regardless of maternal country of birth and socio-economic status, as shown by the persisting lower birth weight among offspring of South Asian migrants to the UK( Reference Leon and Moser 16 ).
Auckland, the largest city in New Zealand, has a large and ethnically diverse population living in the same geographical region. According to the 2013 census data, 59 % of the population self-identified as European, 23 % as Asian, 15 % as Pacific and 11 % as Māori, with the remainder being made up of people of other smaller ethnic groups( 17 ). The relationship between BMI and body composition in young children of such an ethnically diverse population has not previously been reported.
Aim
The primary aim of our study was to determine the relationship between birth weight, BMI and body composition at 2 years corrected age in New Zealand children of different ethnic groups.
Methods
Participants in this study were born at risk of neonatal hypoglycaemia and were recruited at birth into the pre-hPOD (hypoglycaemia Prevention with Oral Dextrose) trial, a multicentre randomised placebo-controlled trial investigating the efficacy of different doses of 40 % dextrose gel for prevention of hypoglycaemia( Reference Hegarty, Harding and Gamble 18 ). The trial took place at Auckland City Hospital and Waitakere Hospital, Auckland, New Zealand, from August 2013 to November 2014. Babies were eligible for randomisation if they were at risk of hypoglycaemia: infant of diabetic mother, preterm (<37 weeks’ gestation), small (<2·5 kg or <10th centile on customised or population weight charts) or large (>4·5 kg or >90th centile on customised or population weight charts) and fulfilled all of the following: ≥35 weeks’ gestation, birth weight >2·2 kg, <1 h of age, no apparent indication for admission to Neonatal Intensive Care Unit (NICU) at the time of randomisation, unlikely to require NICU admission for any other reason, and mother intending to breastfeed. Babies with a major congenital abnormality, history of formula feed or intravenous fluid administration, already diagnosed with hypoglycaemia or admission to NICU were excluded.
All children were eligible for follow-up at 24±1 months corrected age. As part of a more extensive multidisciplinary assessment, anthropometric measurements were undertaken by trained assessors in the following sequence: weight, height, head circumference and bioelectrical impedance analysis (BIA). Weight was measured using electronic scales to the nearest 0·1 kg, with the child dressed in minimal clothing. Height was measured using a wall-mounted stadiometer to the nearest 0·1 cm with the child in bare feet or socks. Head circumference was measured at the maximal occipitofrontal circumference with a non-stretchable tape to the nearest 0·1 cm( 19 ). Percentile and z scores were calculated from the New Zealand-WHO growth charts( 19 ).
BIA was carried out using an ImpSFB7 body composition analysis device (ImpediMed Ltd), using tetra-polar leads attached to four self-adhesive skin electrodes on the right hand and foot with the child semi-reclining or supine. BIA estimates FFM and FM by measuring the body’s opposition to the flow of a constant alternating current known as impedance (Z). Impedance is due to electrical resistance of tissue fluids (R) and capacitive reactance from cell membrane capacitance (X c)( Reference Brantlov, Ward and Jødal 20 ). FFM is estimated from total body water, which in turn is estimated from resistance parameters. The ImpSFB7 employs bioelectrical impedance spectroscopy, which involves measurement of impedance across 256 logarithmically spaced frequencies in the range 3–1000 kHz. Cole modelling of impedance data and mixture theory is used to calculate FFM, and FM is determined from the difference between total mass and FFM. We used the automated FFM and FM values based on the manufacturer’s proprietary calculations, which account for sex, height and weight. Two measurements were obtained, with a third recorded if variation in percentage FM was >1 %, and mean values were used in analysis. Body fat and fat-free measurements in this age group using ImpediMed devices have shown close relationship with reference methods such as dual-energy X-ray absorptiometry( Reference Rowan, Rush and Obolonkin 21 ).
Body composition percentages and indices were then calculated using the following formulae: FM percentage=(FM/(FM+FFM))×100; fat-free (lean) mass percentage=(FFM/(FM+FFM))×100; fat mass index (FMI) (kg/m2)=FM (kg)/height (m)2 and fat-free mass index (FFMI)= FFM (kg)/height (m)2 ( Reference Wells, Fuller and Dewit 22 ). Ethnicity was self-identified by parents and caregivers at the 2-year assessment and was prioritised, according to New Zealand health sector protocol( Reference Poutasi 23 ).
Statistical analysis
Data were analysed using JMP version 12.1.0 (SAS Institute). Groups were compared using χ 2 tests or ANOVA with Tukey post hoc corrections for multiple comparisons. Linear standard least squares and logistic regression models were used to examine the relationship between variables. For comparison between ethnic groups, birth data were adjusted for risk factors for hypoglycaemia and maternal BMI at the time of booking for antenatal care, and 2-year anthropometry and body composition data were adjusted for the potential mediators: birth size, gestation, risk factors for hypoglycaemia and maternal BMI. Data are presented as number (percentage), mean (standard deviation), median (range) and β coefficient (95 % CI).
Ethics approval
Ethics approval was obtained from the New Zealand Health and Disability Ethics Committee for the pre-hPOD Study (HDEC Ref 13/NTA/8) and for the follow-up study (HDEC Ref 15/STH/97). Written informed consent was obtained from parents or caregivers for the neonatal study and again at follow-up.
Results
A total of 415 infants were recruited into the pre-hPOD study. A convenience sample of first 300 children assessed at 2 years corrected age is included in this report. The baseline characteristics of the children who were assessed are presented in Table 1. Of the 300 children included in the study, 209 completed both auxology and body composition assessments.
Table 1 Baseline characteristics of children and their mothers (n 300) (Mean values and standard deviations; medians and ranges; numbers and percentages)

NZDep, New Zealand Deprivation.
* The NZDep 2013 score which was based on the home address of the participant at the time of the study is a measure of socio-economic status of the population and is derived from 2013 census data. It is measured on a decile scale from 1 to 10, with 1 representing the areas with the least deprived scores and 10 the most deprived scores(Reference Salmond and Crampton24, Reference Atkinson, Salmond and Crampton25).
† Some children had more than one risk factor for hypoglycaemia.
Children of mothers with diabetes in pregnancy as their risk factor for hypoglycaemia made up almost 70 % of the cohort, with the proportion varying from 54 % in European to 92 % in Indian children (Table 2). There was only one Indian and one Chinese child (each 3 %) with preterm as a risk factor, and only three children in each of these groups (8 and 10 %, respectively) with large size at birth as a risk factor for hypoglycaemia. European children were more likely to have small (26 %) or large (21 %) as risk factors, and Maori children were also more likely to have large as a risk factor (23 %).
Table 2 Distribution of risk factors for hypoglycaemia in children from different ethnic groupsFootnote * (Numbers and percentages of babies in each ethnicity)
NZE, New Zealand European.
* Total adds up to >100 % as some children had more than one risk factor for hypoglycaemia.
At birth, compared with European children, Chinese, Indian and other children were lighter, and Indian children had smaller head circumferences, but birth lengths were similar in all ethnic groups (Table 3).
Table 3 Anthropometry and body composition in children from different ethnic groupsFootnote * Footnote † (Mean values and standard deviations)
NZE, New Zealand European.
a,b,c Mean values within a row with unlike superscript letters were significantly different (post hoc Tukey test).
∗ Ethnicity was identified by parent/caregiver at assessment and prioritised according to Ministry of Health guidelinesReference Poutasi 23 ; Pacific includes Samoan, Cook Island Māori, Tongan and Niuean.
† Missing data at 2 years for: height (two Indian), head circumference (three NZE, two Māori and one Indian), fat mass and lean mass (seventeen Indian, sixteen NZE, eighteen Other, eleven Pacific and three Māori).
‡ Birth data adjusted for risk factors for hypoglycaemia and maternal BMI at booking; 2-year data adjusted for birth weight z score, gestation, risk factor for hypoglycaemia and maternal BMI at booking.
Relationship between birth weight and weight at 2 years
For the overall cohort, there was a positive relationship between birth weight z score and 2-year weight z score, although the proportion of the variance explained by birth weight was modest (R 2 0·24, Fig. 1). The relationship was similar between birth weight and both BMI (R 2 0·14) and lean mass (R 2 0·14) at 2 years, but there was little relationship between birth weight and FM at 2 years (R 2 0·05, Fig. 1).
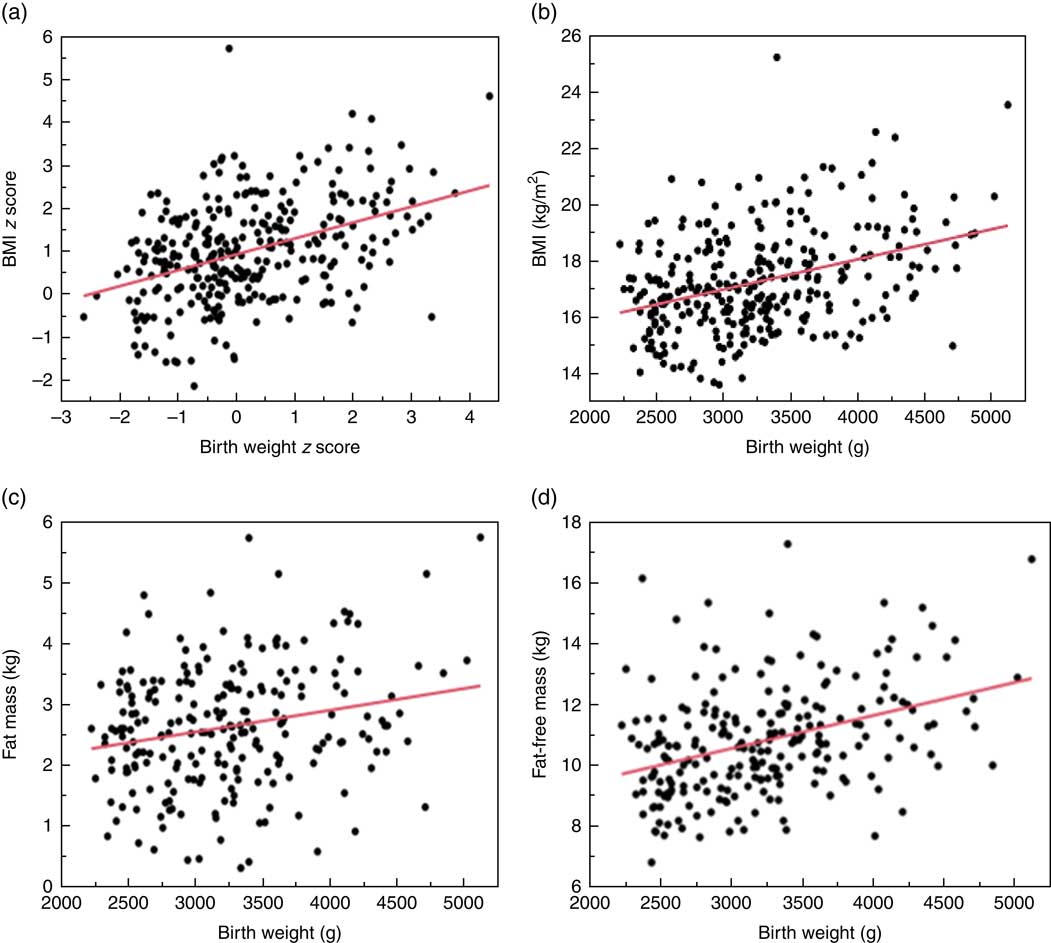
Fig. 1 Relationship between birth weight and body size at 2 years. (a) Relationship between birth weight z score and BMI z score at 2 years. β=0·45 (95 % CI 0·36, 0·54); R 2 0·24; P<0·001. (b) Relationship between birth weight and BMI at 2 years. β=0·0011 (95 % CI 0·0007, 0·0014); R 2 0·14; P<0·001. (c) Relationship between birth weight and fat mass at 2 years. β=0·0004 (95 % CI 0·0002, 0·0006); R 2 0·05; P<0·001. (d) Relationship between birth weight and fat-free mass at 2 years. β=0·0011 (95 % CI 0·0007, 0·0014); R 2 0·14; P<0·001.
Ethnicity, body size and composition at 2 years
At 2 years of age, after adjusting for birth weight z score, gestation, risk factor for hypoglycaemia and maternal BMI at booking, Pacific children were heavier than children of all other ethnic groups except Māori, with greater BMI and BMI z score. However, their FMI and FFMI were similar to those of other children, indicating that their greater weight and BMI was not due to excess adiposity (Table 3). Indian children had lower head circumference z scores than European children and lower BMI z scores but had similar FMI and FFMI.
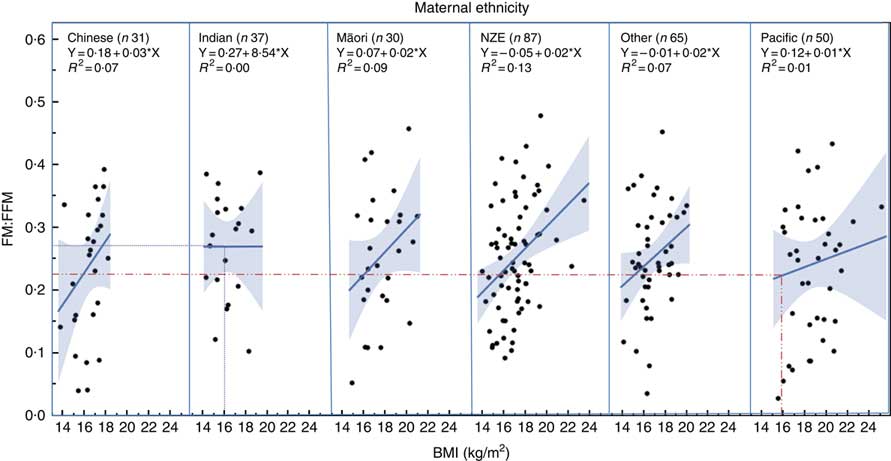
Regression analysis showed that children of different ethnicity had different FM:FFM ratio for any given BMI (Fig. 2), with Pacific children having lower FM:FFM for BMI and Indian children having higher FM:FFM for BMI (P=0·03). For example, for a BMI of 16 kg/m2 (50th centile for boys aged 2 years( 26 )), FM:FFM for Pacific children was 0·22 and that for Indian children was 0·27, a 23 % difference (Fig. 2).
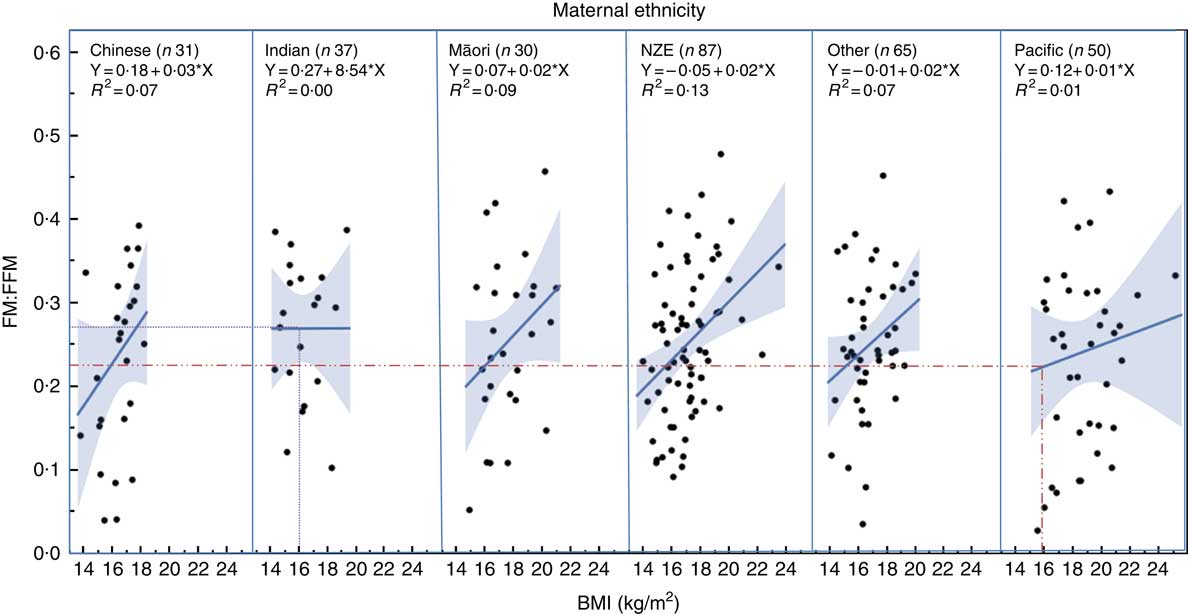
Fig. 2 Relationship between fat mass:fat-free mass (FM:FFM) and BMI in children from different ethnic groups. Lines represent regression line for each ethnicity. Dotted lines indicate the 23 % difference in FM:FFM between Indian and Pacific children for a BMI of 16 kg/m2 (50th centile for boys at age 2 years) (26) . NZE, New Zealand European.
Discussion
There were important differences in body composition as measured by BIA at 2 years corrected age in children of different ethnic groups in this multiethnic cohort of New Zealand children.
At 2 years, Pacific children were already heavier than children in other ethnic groups, with higher BMI and BMI z scores even adjusted for size at birth. The observation that Polynesian children, including Pacific children, are heavier, taller and have a higher BMI has been reported previously( Reference Grant, Ferguson and Toafa 27 – Reference Rush, Paterson and Obolonkin 29 ), including a recent review comparing the height, weight, head circumference and BMI of children from different countries and ethnic backgrounds to WHO Multicentre Growth Reference Study reference ranges( Reference Natale and Rajagopalan 30 ). The majority of Polynesian children included in that review had BMI scores above the 90th centile based on the WHO reference ranges. The recommended WHO BMI cut-off for overweight is >85th centile (z score >1)( 26 ), putting most Pacific children in the overweight or obese categories. The mean BMI z score for Pacific children in our study was 1·81 kg/m2, and 35/50 (70 %) had BMI z score >1, indicating that the majority of Pacific children in our cohort would also be considered overweight or obese, using the WHO criteria. Adiposity, however, was not significantly higher in the Pacific children compared with children of other ethnic groups in our cohort. Rather, Pacific children had similar FM and FFM indices to those of other children in all other ethnic groups and the lowest FM:FFM ratio at median BMI. This indicates that at least in this cohort of children, a high BMI was not a good indicator of increased adiposity across the different ethnic groups. Overweight and obesity by definition imply excessive adiposity; and therefore, in Pacific children, one should use caution when using BMI alone to identify children who are overweight and obese.
At birth, Indian children had lower birth weight and head circumference z scores compared with children in other ethnic groups in this cohort, and at 2 years the smaller head circumference z score persisted even after adjustment for birth size. Indian children have been shown to have different growth patterns compared with other children. For example, a study comparing anthropometry and body composition of children born in Pune, India, to that of children from Southampton, UK, showed that Indian newborns had smaller head circumference compared with European newborns; and over the first 2 years, these differences became even greater, with head circumference z scores decreasing from –1·46 at birth to –2·31 at 2 years( Reference D’Angelo, Yajnik and Kumaran 8 ). Another study showed that change in height, weight, head circumference, mid-arm circumference and growth velocity in affluent Indian children from 1 to 6 years of age were different from American and European reference ranges, indicating that perhaps there is an underlying difference in growth rate in Indian children which is not related to poverty or reduced energy intake( Reference Agarwal and Agarwal 31 ). Our data suggest that this may also apply to Indian children in New Zealand, raising the possibility that using currently accepted international standards may result in overdiagnosis of undernutrition in Indian children and underdiagnosis of overnutrition. The Indian Academy of Paediatrics recommends monitoring of height, weight and head circumference in all children for the first 3 years using locally produced reference charts when screening for under- or overnutrition( Reference Khadilkar, Khadilkar and Choudhury 32 ). Caution should be used when using WHO growth references for assessing nutritional status in Indian children in other settings as well.
Indian children in our study also had low BMI z score compared with children in the other ethnic groups, but similar FM and FFM indices, and had the highest FM:FFM at median BMI. These findings are similar to that of a previous study which investigated body composition in children of mothers with diabetes using a dual-energy X-ray absorptiometry scan and showed that Indian boys aged between 1 and 3 years had significantly less total lean mass adjusted for height compared with New Zealand European boys( Reference Rush, Obolonkin and Battin 9 ). Others have shown similar differences in body composition at birth and in early childhood in Indian children in India and in comparison with European children( Reference Joglekar, Fall and Deshpande 33 – Reference Yajnik, Fall and Coyaji 36 ). This conservation of adipose tissue despite the overall smaller size is in keeping with the ‘thin-fat’ phenotype of Indian infants and children, compared with their European counterparts( Reference D’Angelo, Yajnik and Kumaran 8 ). In view of these differences in adiposity in Indian children and the relationship between adiposity and long-term adverse health outcomes( Reference Wells, Pomeroy and Walimbe 37 ), a lower cut-off for waist circumference and BMI has been suggested to help better identify overweight and obese Indian children( Reference Virani 38 ). Our finding of higher FM:FFM for BMI in Indian children compared with children of other ethnicities in this New Zealand born cohort would support similar recommendations for Indian children in New Zealand.
Limitations of the study
Our study has a number of limitations. This study reports findings from a group of children with risk factors for neonatal hypoglycaemia and therefore may not be generalisable to all children. We had a good mix of different ethnicities in our sample. 2-year-old children are not easy to engage in assessments of body composition; and despite our best efforts, we had missing data on FM and FFM for 69 (23 %) of 300 children. BIA is a portable and relatively easy-to-use device for measurement of FM and FFM in children. However, BIA does not directly measure FM and FFM, relying instead on formulae to derive these values from total body weight and total body water measurements. The constant state of hydration necessary for accurate assessment of body composition was not possible to achieve in 2-year-old children. We attempted to standardise the body composition measurements by following the same sequence and measurement technique, so all children were measured in relatively similar conditions.
Conclusions
BMI is not a good indicator of adiposity in this multi-ethnic cohort of New Zealand 2-year-old children. Pacific children have high BMI with higher proportionate lean mass, and Indian children have low BMI with higher proportionate FM. BMI-based criteria for overweight and obesity should take ethnicity into consideration in an ethnically diverse population.
Acknowledgements
The hPOD Study Team are:
Steering group: Jane E. Harding (Chair), Jane M. Alsweiler (Department of Paediatrics: Child and Youth Health, University of Auckland), Richard Edlin (School of Population Health, University of Auckland), Greg Gamble (Liggins Institute, University of Auckland), Joanne Hegarty (Newborn Services, National Women’s Health, Auckland City Hospital), Christopher J. D. McKinlay (Liggins Institute, University of Auckland), Benjamin Thompson (Optometry and Vision Science, University of Waterloo) and Trecia A. Wouldes (Department of Psychological Medicine, University of Auckland).
Study team: Mariam Buksh, Nataliia Burakevych, Kelly Fredell, Karen Frost, Rashedul Hasan, Safayet Hossin, Anushika Kendaragama, Christopher McKinlay, Grace McKnight, Jenny Rogers, Nina Slabkevich, Heather Stewart, Jason Turuwhenua, Alena Vasilenko, Jess Wilson.
The authors would like to thank all the children and their families who took part in this study.
This study has been funded by the Health Research Council of New Zealand (15-216); Cure Kids (3561); Gravida (SCH-14-14 Hegarty); Lottery Health Research (241266) and philanthropic donations to the University of Auckland Foundation (F-ILG-LRSR). The first author received a Gravida (National Centre for Growth and Development) scholarship.
J. Harding conceived, planned and designed the pre-hPOD dosing study and the 2-year follow-up study and secured funding for the study. J. Harding reviewed and edited the manuscript. M. B. helped plan and conduct the follow-up study, performed the statistical analysis and wrote the first draft of the manuscript. J. Hegarty helped plan and conduct the pre-hPOD study and the follow-up study. R. G. contributed to conducting the follow-up assessments. J. A. and C. M. helped plan, design and conduct the pre-hPOD and the 2-year follow-up studies. All authors contributed to editing of the manuscript and have reviewed and approved the final manuscript for submission.
The authors have no conflict of interest to declare.