


Implications
This paper reviews different alternatives for populations with a small number of proven bulls to invest in improving the reference population. The most straightforward way is to increase the number of animals in the reference either via international collaborations or by including genotyped and non-genotyped cows. There is also potential in combining a reference across breeds, but the advantage depends on the genetic distance between the breeds and requires using more sophisticated Bayesian methods in combination with sequence or dense marker information.
Introduction
A key factor for a successful genomic selection scheme is the ability to accurately predict genomic breeding values (GEBV). This requires a reference population from which marker effects can be estimated precisely. Accordingly, the reliability of the resulting GEBV relies heavily on the number of individuals in the reference population (Goddard, Reference Goddard2009). Small dairy cattle populations are often restricted by small reference populations of progeny tested bulls. These populations, therefore, have low reliabilities of GEBV (Thomasen et al., Reference Thomasen, Willam, Guldbrandtsen, Lund and Sørensen2012). This poses a challenge for their future genetic gain relative to breeds with large reference populations. Thomasen et al. (Reference Van den Berg, Guldbrandtsen, Hoze, Brøndum, Boichard and Lund2014) showed that low reliabilities of genomic prediction is the single most important factor that limits the genetic gain in smaller populations with more intensive use of young bulls without a progeny test. The aim of this paper is to review theory and practical results on strategies and methods to increase the accuracies of GEBV in numerically small dairy populations.
Reliability of GEBVs in relation to genomic relationship
Using a genomic best linear unbiased predictor (GBLUP) model, the reliability of the GEBV of a given individual is a function of the true genomic relationships at causal loci between the individual and each reference individual with a phenotypic record (de Los Campos et al., Reference Lund, De Roos, De Vries, Druet, Ducrocq, Fritz, Guillaume, Guldbrandtsen, Liu, Reents, Schrooten, Seefried and Su2013). In practice we use genome wide markers in linkage disequilibrium (LD) with the causal variants, instead of causal variants themselves. This introduces estimation error and thereby reduces the contribution of the phenotypes to the reliability of GEBV of the test individuals. The extend of the loss of information can be quantified by the correlation between the true causative relationships and the marker-based relationships in the following formula derived according to de Los Campos et al. (Reference Lund, De Roos, De Vries, Druet, Ducrocq, Fritz, Guillaume, Guldbrandtsen, Liu, Reents, Schrooten, Seefried and Su2013):
 $$\tilde{R}_{{i,REF}}^{2} \leq p{\times}R_{{i,REF}}^{2} {\times}\left( {1{\minus}\left( {1{\minus}b_{i} } \right)^{2} } \right)$$
where
 $$\tilde{R}_{{i,REF}}^{2} $$
is the reliability of prediction based on marker data for individual i, given the data in the reference population, p the proportion of genetic variability in individual i that is present in the reference population,
$$\tilde{R}_{{i,REF}}^{2} $$
is the reliability of prediction based on marker data for individual i, given the data in the reference population, p the proportion of genetic variability in individual i that is present in the reference population,
 $$R_{{i,REF}}^{2} $$
the reliability for individual i, given that predictions are based on the genomic relationships at the causative loci, given by
$$R_{{i,REF}}^{2} $$
the reliability for individual i, given that predictions are based on the genomic relationships at the causative loci, given by $g_{{TR,i}} {\times}\left[ {\sigma _{u}^{2} G_{{RR}} {\plus}\sigma _{{\epsilon}}^{2} I} \right]^{{{\minus}1}} {\times}g_{{TR,i}} $
(G
RR
is the genomic relationship matrix among individuals in the reference), which is a weighted sum of squares of genomic relationships between the test individual and individuals in the reference population (g
TR,i
). Consequently, phenotypes from distant relationships will contribute less to the reliability, but as the reference increases this term will approach 1. The last term describes the minimum loss in reliability pertaining to the fact that we use markers rather than causative loci, in which b
i
is the coefficient of regressing marker-based genomic relationships on the true genomic relationships at causal loci.
$g_{{TR,i}} {\times}\left[ {\sigma _{u}^{2} G_{{RR}} {\plus}\sigma _{{\epsilon}}^{2} I} \right]^{{{\minus}1}} {\times}g_{{TR,i}} $
(G
RR
is the genomic relationship matrix among individuals in the reference), which is a weighted sum of squares of genomic relationships between the test individual and individuals in the reference population (g
TR,i
). Consequently, phenotypes from distant relationships will contribute less to the reliability, but as the reference increases this term will approach 1. The last term describes the minimum loss in reliability pertaining to the fact that we use markers rather than causative loci, in which b
i
is the coefficient of regressing marker-based genomic relationships on the true genomic relationships at causal loci.
The b-values are generally found to be close to 1 for high relationships and decreasing as relationships diminish. This means that distantly related individuals, while potentially contributing to the reliability of the test individuals GEBV, may mainly introduce noise in the predictions. On the other hand the b-values can be increased by using models that contributes most of the genomic variance to markers in close LD with the causative variants, because the equivalent genomic relationship matrix is closer to the relationships at causative loci.
We will use this concept to discuss the expectations and results of applying the different strategies to improve the reliabilities of GEBVs. The strategies generally influence one or both of the two main factors influencing the reliability of predictions: (1) improve or increase genomic connections to phenotypic records. (2) Models and strategies to focus genomic predictions on markers closer to the causative variants.
Combining reference data from different populations of the same breed
If populations of the same breed exist in other countries, joining those populations into a common reference population is an efficient way to increase reliabilities of GEBV. Especially when there has been recent exchange of genetic material between the populations, the relationships may be relatively high such that the information of the added populations will improve predictions of a given population substantially. To what extend the accuracies will increase may be estimated using formulas that describe the relationship between the number of individuals in the reference populations and accuracies(Goddard, Reference Goddard2009). Results on joining reference populations of the same breed are shown in Table 1. When combining Holstein Friesian (HF) populations large improvements were realized in North American studies (Schenkel et al., Reference Strandén and Mäntysaari2009; Vanraden et al., Reference Vanraden, Olson, Null, Sargolzaei, Winters and van Kaam2012) and in the EuroGenomics collaboration (Lund et al., Reference Ma, Lund, Nielsen, Aamand and Su2011). As an example of a small HF population, genomic predictions for Chinese HF using a joint reference with Nordic HF increases accuracies substantially (Zhou et al., Reference Zhou, Ding, Zhang, Wang, Lund and Su2013). This could be regarded as more surprising since environmental and management factors are very different between Chinese and Nordic Holstein populations. However, the genetic relationships were relatively high, especially to the bulls. In Denmark the Jersey population is relatively small but it was recently agreed to join it with the US Jersey reference. Su et al. (Reference Thomasen, Guldbrandtsen, Su, Brøndum and Lund2014) found that the gains in reliability ranged from 1.6% points for fertility to 12.5% points for udder conformation. The exception was longevity for which the joint reference population resulted in a loss of 5.5% points in reliability of GEBV. Averaged over all nine traits in the analysis, the reliability of GEBV using the combined reference population was 4.0% points higher than the reliability of GEBV using the Danish reference population alone. Overall, the results show that large gains are realized and the gain depends on the size of the domestic and common reference populations, such that small populations gain relatively more as expected by the formula by Goddard (Reference Goddard2009). For traits that are defined differently in the different countries the reliabilities of GEBV generally increase less or even decrease in some cases (Su et al., Reference Thomasen, Guldbrandtsen, Su, Brøndum and Lund2014). Here it can be advised to use two trait models in the genomic analyses to allow for the fact that correlations between SNP effects in the two countries are <1 and may vary over the genome.
Table 1 Increase in reliabilities (% points) of genomic breeding values when combining reference populations of the same breed

HF=Holstein Friesian; BS=Brown Swiss; JER=Jersey; US=United States; NAC=North American countries; NO=Nordic countries; EGC=Eurogenomics Consortium; CH=China; DE=Germany; AUT=Austria; CZ=Czech Republic; DK=Denmark.
1 Single breed bull+cow reference population (multi-breed bull+cow reference population).
2 Schenkel et al. (Reference Strandén and Mäntysaari2009).
3 Lund et al. (Reference Ma, Lund, Nielsen, Aamand and Su2011).
4 Zhou et al. (Reference Zhou, Ding, Zhang, Wang, Lund and Su2013).
5 Vanraden et al. (Reference Vanraden, Olson, Null, Sargolzaei, Winters and van Kaam2012).
6 Su et al. (Reference Thomasen, Guldbrandtsen, Su, Brøndum and Lund2014).
Combining reference data from different breeds
Combining populations across breeds is not straightforward due to differences in LD structure, weak genetic links between breeds or breed-specific effects arising from non-additive genetic effects. Table 2 shows the results from studies where different dairy breeds have been combined into a joint reference population. Results show that the effect of multi-breed reference populations on the reliability of genomic prediction is highly affected by the genetic distance between breeds (Figure 1).
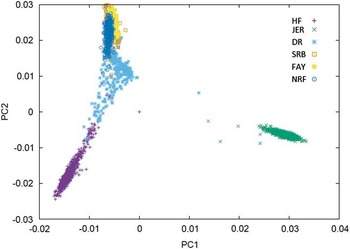
Figure 1 Plot of the first v. second principal component of the genomic relationship for HF=Nordic Holstein, JER=Danish Jersey, DR=Danish Red, FAY=Finish Ayrshire, SRB=Swedish Red and NRF=Norwegian Red, based on data of the 50 K chip.
Table 2 Increase in reliabilities (% points) of milk production traits with multi-breed reference populations
HF=Holstein Friesian; JER=Jersey; DFS=Danish, Finnish and Swedish Red; NRF=Norwegian Red; DR=Danish Red; SRB=Swedish Red; FAY=Finnish Ayrshire (red); GBLUP=genomic best linear unbiased predictor.
In the Nordic countries results were obtained using 54 k genotype data, whereas single v. multi-breed references were tested for both 800 k genotype data and a subset of the 800 k genotypes annotated as transcribed markers on Australian data.
1 Bayesian 4-distribution mixture model.
2 Zhou et al. (Reference Zhou, Heringstad, Su, Guldbrandtsen, Meuwissen, Svendsen, Grove, Nielsen and Lund2014a).
3 Zhou et al. (Reference Zhou, Lund, Wang and Su2014b).
One category of results are from joining breeds that are admixed in the sense that bulls to some degree have been used across the breeds. This is particularly clear for the Nordic red breeds: Danish Red (DR), Swedish Red (SRB), Finnish Ayrshire (FAY) and Norwegian Red (NRF). In these breeds, principle components analysis clearly shows the consequence of a high exchange of genetic material between SRB and FAY (Figure 1) as well as the use of SRB bulls in DR. As a consequence SRB and FAY largely overlap in a plot of the first and second principal components, and there is a smaller overlap between DR and SRB, but no overlap between DR and FAY. A similar situation is present in NRF, which has frequent exchange of genetic material with SRB. These structures are clearly favorable for an increase in reliabilities of GEBVs when going from a single breed reference to a joint reference. Generally, the increases are substantial, but smaller than combining populations of the same breed. For FAY and SRB large increases in reliabilities were observed when their reference populations were combined, while the added effect on the reliability for these two breeds by including DR as well was negligible. Vice versa DR had the smallest increase in reliability when using a multi-breed reference of DR, SRB and FAY (Brøndum et al., Reference Brøndum, Su, Janss, Sahana, Guldbrandtsen, Boichard and Lund2011). Similarly, the accuracies for GEBVs in NRF increased substantially when Danish, Swedish and Finnish Red animals were added to the reference (Heringstad et al., Reference Heringstad, Su, Solberg, Guldbrandtsen, Svendsen and Lund2011; Zhou et al., Reference Zhou, Heringstad, Su, Guldbrandtsen, Meuwissen, Svendsen, Grove, Nielsen and Lund2014a).
Another group of studies attempt to join populations of more distantly related breeds. One study combined the three French populations of Holstein, Normande and Montbéliard (Karoui et al., Reference Karoui, Carabaño, Díaz and Legarra2012). This study found a slight increase in reliabilities for production traits of the breed with the smallest population. However, no increase was found for fertility, for which the genetic correlation between the trait-performances measured in different breeds was low. Zhou et al. (Reference Zhou, Lund, Wang and Su2014b) investigated genomic prediction across the Nordic HF and DSF Red populations, and reported that the joint reference population slightly increased the reliability in DSF Red, but the improvements were negligible in HF. Among the three sub-populations of DSF Red, accuracies increased more for DR than for SRB and FAY, because of closer genetic relationships between DR and Nordic HF. Gaspa et al. (Reference Gaspa, Jorjani, Dimauro, Cellesi, Ajmone-Marsan, Stella and Macciotta2015) compared different combinations of multi breed reference populations with HF, Brown Swiss and Simmental. They observed improved predictions in Brown Swiss and Simmental when using a multi-breed reference. The method based on principal components and a multi-breed reference even gave an increase in accuracy of 10% for protein yield in Brown Swiss, but on average the use of principal components was not better than using SNP genotypes, and in some cases the use of a multi-breed reference gave results similar to single breed analyses or even negative compared to those.
A number of studies (Hayes et al., Reference Hayes, Bowman, Chamberlain, Verbyla and Goddard2009; Pryce et al., Reference Schenkel, Sargolzaei, Kistemaker, Jansen, Sullivan, Van Doormaal, Vanraden and Wiggans2011; Erbe et al., Reference Erbe, Hayes, Matukumalli, Goswami, Bowman, Reich, Mason and Goddard2012; Olson et al., Reference Pryce, Gredler, Bolormaa, Bowman, Egger-Danner, Fuerst, Emmerling, Sölkner, Goddard and Hayes2012) report on the effect of combining HF with Jersey. Here the relationships across breeds are weak although probably relatively higher for the Australian HF and Jersey, since the Australian Jersey is upgraded to Australian HF by systematic crossing with Jersey (Pryce et al., Reference Schenkel, Sargolzaei, Kistemaker, Jansen, Sullivan, Van Doormaal, Vanraden and Wiggans2011). Generally, no improvements are observed in the accuracies of GEBV for HF when Jersey animals are added to the reference population, and for Jersey animal results are similar or worse when using 54 k data and GBLUP methods (Hayes et al., Reference Hayes, Bowman, Chamberlain, Verbyla and Goddard2009; Erbe et al., Reference Erbe, Hayes, Matukumalli, Goswami, Bowman, Reich, Mason and Goddard2012). However, by using sophisticated Bayesian variable selection models or marker selection strategies, that put more focus on genomic markers in strong LD with causative variants, it is possible to utilize information across distantly related breeds to increase the reliability of genomic prediction. In Erbe et al. (Reference Erbe, Hayes, Matukumalli, Goswami, Bowman, Reich, Mason and Goddard2012) a subset of markers on the Bovine HD chip in or within a distance of 1 Kb to transcribed genomic regions was used to calculate GEBV. Genomic models were trained in a reference population of Jersey bulls, HF bulls or a combination. Results showed large increases for the prediction reliability in the Jersey in the multi-breed scenario using both GBLUP and BayesR (Table 2). This suggests that when using transcribed markers the relationship modeled with the G matrix is closer to the true functional relationship than when using 54 k or HD markers.
The further development of multi-breed genomic prediction models, offers not only increases in the reliability of GEBVs for breeds with small populations, but will also give a slower decay of the reliability over generations within larger breeds because predictions focus on markers closer to the causative variants.
Include genotyped and non-genotyped animals by single step method
One approach to utilize more phenotypes and thereby improve genomic predictions is to use the phenotypic information from non-genotyped animals. This can be achieved by using a single-step model that integrate genotyped and non-genotyped individuals (Aguilar et al., Reference Aguilar, Misztal, Johnson, Legarra, Tsuruta and Lawlor2010; Christensen and Lund, Reference Cooper, Wiggans and VanRaden2010). Weller et al., (Reference Weller, Ron, Glick, Shirak, Zeron and Ezra2012) used an alternative model that also uses cow phenotypes. In a cattle population, some progeny-tested bulls have phenotypic information but are not genotyped due to various reasons (e.g. no DNA sample available). It has been reported that including these bulls can increase prediction reliability by 1.3% point in Nordic Red (Su et al., Reference Su, Nielsen, Wiggans, Aamand, Guldbrandtsen and Lund2012) and 1.6% point in Nordic Holstein (Gao et al., Reference Gao, Christensen, Madsen, Nielsen, Zhang, Lund and Su2012).
Another approach to efficiently use phenotypic data is to use cow phenotypes directly instead of including them in phenotypes of bulls. Makgahlela et al. (Reference Olson, Vanraden and Tooker2014) predicted GEBV using single-step models with 2 816 745 ungenotyped cows and 4106 genotyped bulls (806 bulls born after 2005 were used as validation bulls) in the data. The daughters of validation bulls and cows born after 2005 were removed in the analysis. This approach increased the reliability 3% to 7% point for yield traits, compared with their prediction using GBLUP with only bulls in the reference data. The GBLUP results were obtained from Makgahlela et al. (Reference Makgahlela, Strandén, Nielsen, Sillanpää and Mäntysaari2013) where the same bull data set was used. This improvement can be explained by the genomic relationship between the individual expressing the phenotypic trait and the test individual being used more accurately.
Single-step prediction with Danish Jersey cow data has been investigated in a study by Ma et al. (Reference Makgahlela, Strandén, Nielsen, Sillanpää and Mäntysaari2015). The data contained 611 695 cows with deregressed proofs (DRP) calculated from EBV for protein. The DRP for all cows were calculated using Mix99 (Lidauer and Strandén, Reference Lidauer and Strandén1999; Strandén and Mäntysaari, Reference Su, Ma, Nielsen, Aamand, Wiggans, Guldbrandtsen and Lund2010). After tracing the pedigree to as many generations as possible for the cows with EBV and bulls with genotypes, the pedigree used for single-step prediction included 819 988 individuals. Proven bulls born after 1 January 2005 (225 animals) were used as test animals for validating the prediction reliability. Cows which are daughters of the test bulls were excluded from the reference population. After filtering, the number of cows with DRP used in the single-step approach was 577 405. The results showed that compared with the GBLUP model with 1030 bulls born before 1 January 2005 as reference population, the prediction reliability using single-step approach was increased from 0.30 to 0.36.
Genotyping cows for the reference population
The direct use of female phenotypes can be further improved by genotyping cows and adding them to the reference population. Some small populations, like the Danish Jersey or Australian Jersey have genotyped a number of cows with the aim to enlarge the reference population. In this scenario the number of phenotypes contributing to the reliability of test individuals’ GEBVs does not increase since in most cases the phenotypes of cows are already included in the aggregate phenotype of their sire. However, the b-value in formula 1 increases since the genomic relationship changes from the relationship with the bull to the relationship with the cow expressing the phenotype, which is closer to the relationship at causative loci to these cows. In Danish Jersey preliminary results showed that by genotyping 2713 cows and adding these to the 1030 bulls in the reference population, the mean reliabilities of GEBV were increased by 5 percentage units (Table 3), which accounts for a high increase in the reliability attributed to genomic information (Ma et al., Reference Makgahlela, Strandén, Nielsen, Sillanpää and Mäntysaari2015). The substantial increase in reliabilities could be higher than that obtained when testing young selection candidates in practice. This is because part of the cows added to the reference was half sibs of the test bulls. When these cows were not included the increased reliability dropped to 2% averaged over the traits.
Table 3 Validation reliabilities (%) of genomic predictions when adding cow genotypes to the Danish Jersey reference population, based on validation bulls (Ma et al., Reference Makgahlela, Strandén, Nielsen, Sillanpää and Mäntysaari2015)
Based on the updated data of Danish Jersey, Su et al. (Reference Su, Madsen, Nielsen, Mäntysaari, Aamand, Christensen and Lund2015) assessed genomic predictions using reference population with or without cows. The bull reference populations comprised about 1250 Danish bulls, and the bull-cow reference population comprised about 1250 bulls and about 4800 cows. The validation data consisted of about 3000 Danish cows from 87 young half-sib families. The results showed that compared with genomic predictions using the bull reference population, the bull-cow reference population increased the reliabilities of GEBV by >11% points for the three production traits and by 5.7% for udder conformation, but no improvement for mastitis and body conformation (Table 4). Averaged over the six traits, the increase of reliabilities was 8.2% points.
Table 4 Validation reliabilities (%) of genomic predictions using bull reference population and bull-cow reference population, based on validation cows (Su et al., Reference Su, Madsen, Nielsen, Mäntysaari, Aamand, Christensen and Lund2015)
A gain in reliability of genomic prediction by adding cows in reference population was also reported by Calus et al. (Reference Carlborg, Kerje, Schütz, Jacobsson, Jensen and Andersson2013) who investigated reliability of genomic prediction using 1609 cows and 296 bulls as reference animals, and found that the combined bull and cow reference population resulted in a prediction reliability higher than using cow reference population alone, and much higher than using bull reference population alone. In addition, Cooper et al. (Reference Daetwyler, Capitan, Pausch, Stothard, van Binsbergen, Brøndum, Liao, Djari, Rodriguez, Grohs, Esquerré, Bouchez, Rossignol, Klopp, Rocha, Fritz, Eggen, Bowman, Coote, Chamberlain, Anderson, VanTassell, Hulsegge, Goddard, Guldbrandtsen, Lund, Veerkamp, Boichard, Fries and Hayes2015) reported that adding 30 852 cows to the bull reference population (21 833 bulls) increased reliability by 0.4% points for validation bulls and 4.4% points for validation cows.
Models and strategies to focus in on causative variants
It is clear from the results that with increased genetic distance between the populations, a joint reference population gives a smaller increase in reliability of GEBV. This is partly because the LD between markers and quantitative trait loci (QTL) within populations does not persist across populations. However, conditional on the same causative variants segregating and having a similar effect in the combined populations, it should be possible to estimate the effects across populations and thereby increase the reliability. To achieve this in distantly related breeds at least two technical requirements must be fulfilled. First, the marker density used has to be sufficient to achieve consistent LD between causative variants and markers across breeds. Second, genomic prediction models must allocate more genomic variance to markers in strong LD with the causative variants.
Bayesian variable selection models
Bayesian variable selection models allocate more genomic variance to markers having a high association to phenotypes compared with GBLUP, which assumes equal variance at each marker. This may be a more efficient use of LD between QTL and markers and results in a more constant LD between QTL and prediction markers over generations. Accordingly the superiority of Bayesian models over GBLUP, is larger when the relationship between test and reference animals is weak (Gao et al., Reference Gao, Christensen, Madsen, Nielsen, Zhang, Lund and Su2012; Habier et al., Reference Habier, Fernando and Garrick2013). This indicates that Bayesian variable selection models have the potential to utilize information across distantly related breeds and improve multi-breed evaluations. By allowing different variances for different markers, the advantage of Bayesian approaches may be more profound when using high density markers or sequence markers, since an increase in LD between markers and causal variants comes with an increase in the number of noise markers. As presented in Table 2, the gain by using a multi-breed reference population is larger when using a Bayesian variable selection model than using a GBLUP model (Erbe et al., Reference Erbe, Hayes, Matukumalli, Goswami, Bowman, Reich, Mason and Goddard2012). It has also been shown by Kemper et al. (Reference Kemper, Reich, Bowman, vander Jagt, Chamberlain, Mason, Hayes and Goddard2015), that when using a multi-breed reference of Australian Holstein and Jersey to predict GEBV for Australian Red, a Bayesian variable selection model resulted on average in 7% higher accuracy then when using a GBLUP model.
The LD phase, causal variants and their effects may be different between breeds, so the covariance for each SNP between breeds can be different. Therefore, sophisticated Bayesian models are needed that allow for varying SNP-covariances between breeds such that information from shared causal variants is utilized across the involved breeds while noise is minimized. Models that allow for varying SNP-covariances have already been developed for multi-trait genomic prediction and tested in simulated data (Hayashi and Iwata, Reference Hayashi and Iwata2013). For dairy cattle Chen et al. (Reference Christensen and Lund2014) developed a Bayesian 2-mixture multi-breed model, where varying SNP-covariances are not explicitly modeled, but information from all breeds was taken into account when determining whether or not a marker has an effect, while the actual SNP effects are sampled independently for each breed. This allows for differences in both magnitude and direction of the SNP effects. The method was tested on true and simulated Canadian Holstein (n=2258) and Ayrshire (n=458) data. In the simulated scenarios the multi-breed model gave increases in accuracy of up to 16 percentage points for the small breed compared to the single breed model, and the multi-breed model always performed better than the single breed model, while a simple pooling of data in some cases led to a lower accuracy. Gains were highest when only few QTL affected the trait. For true data the benefit of the multi-trait model was smaller with increases in accuracy between 0 and 7 percentage points. Again the advantage was mainly found for protein and fat percentage, where few very large QTL exist. Here, the simple pooling, however, always gave a decrease in the accuracy. For the Holsteins the multi-breed model gave similar accuracies to the single-breed model, while a pooling of data in some cases decreased the accuracy. Higher gains in true data for highly correlated traits might be achieved by using models that more explicitly models the covariance (Chen et al., Reference Christensen and Lund2014). However, this needs to be combined with potentially different covariances over the genome and allowing for non-zero effects in one breed but not the other. A model that partly allow for this was developed in Hay and Rekaya (Reference Hay and Rekaya2015), but it has the drawback that it does not allow for private variation in one of the breeds.
Using sequence data
Currently, cost-effective whole genome sequencing (WGS) data are becoming available. Therefore, marker density will no longer be a limiting factor as all SNP (including causative variants) of sequenced individuals in principle can be imputed in all genotyped individuals. The 1000 bulls genome project (Daetwyler et al., Reference De Los Campos, Vazquez, Fernando, Klimentidis and Sorensen2014) provides a panel of sequenced bulls that can be used as a reference to impute WGS variants in all genotyped individuals.
Iheshiulor et al. (Reference Iheshiulor, Wooliams, Yu, Wellmann and Meuwissen2014) show in a simulation study, that using sequence information in combination with a mixture model can increase reliabilities in multi-breed predictions. Similarly Van den Berg et al. (Reference Brøndum, Rius-Vilarrasa, Strandén, Su, Guldbrandtsen, Fikse and Lund2014) used simulations based on real sequence data to show the potential of combining five distantly related breeds HF, Normande, Montbéliarde, Jersey and DR. The study attempted to assess how close markers need to be to the causal variants for efficient use in genomic predictions. Sequence data from 122 HF, 27 Jersey, 28 Montbéliarde, 23 Normande and 45 DR bulls was used to quantify the loss in prediction reliabilities that results from using different sets of genomic markers rather than the true causal variants (de Los Campos et al., Reference Lund, De Roos, De Vries, Druet, Ducrocq, Fritz, Guillaume, Guldbrandtsen, Liu, Reents, Schrooten, Seefried and Su2013), when reference animals are from another breed. Two genomic relationship matrices were constructed; the first using simulated causative mutations, and the second using prediction markers. Causative mutations were randomly selected from all variants segregating in at least one breed on chromosome 1. As prediction markers, polymorphisms in two 1 Kb intervals on both sides of each causative mutation were used, varying the distance between causative mutations and intervals with prediction markers from one base to 100 Kb. Subsequently, b-values were computed by regressing genomic relationships at prediction markers on genomic relationships at the causative mutations. Figure 2 shows the reduction in across breed b-values with increasing distance between causative mutations and prediction markers. When prediction markers close to the causative mutations were used, b-values showed great potential for across breed prediction. However, when the distance between prediction markers and causative mutations increased, the b-values dropped, showing the importance of using only markers very close to the causative mutations.
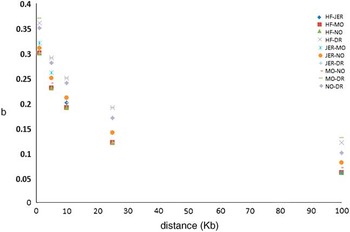
Figure 2 Regression of marker-based genomic relationships on genomic relationship at 100 simulated causative mutations on chromosome 1 across five breeds. HF=Holstein; JER=Jersey; MO=Montbéliarde; NO=Normande; DR=Danish Red.
With the availability of WGS data the requirement of using markers in strong LD with causative variants can be achieved by sequencing a subset of individuals and imputing all SNP to all genotyped individuals. This generates >20 million SNPs to be handled in genomic predictions, which is a technical challenge for Bayesian variable selection models in large populations. Another limitation in this approach is, that the reliability of imputation for rare variants is very poor (Daetwyler et al., Reference De Los Campos, Vazquez, Fernando, Klimentidis and Sorensen2014). If the complex traits in the breeding goal are regulated by rare variants the imputed sequence will provide limited extra information. To overcome this limitation a substantially larger number of individuals could be sequenced. Alternative sequencing strategies have been suggested to achieve a cost-effective approach. If many causative variants are rare, sequencing many more animals may be required. This could call for alternative cost-effective sequencing strategies to complement the current medium coverage sequences available. Alternative strategies could be sequencing a large numbers of individuals with low coverage (Li et al., Reference Li, Sidore, Kang, Boehnke and Abecasis2011), exome sequencing, or genotyping by sequencing approaches.
Another alternative is to use sequence information indirectly in two steps. This can be achieved by retrieving the potentially most efficient markers for across breed predictions from mining the sequence data and adding these SNP to genotyping chips that are used to screen a large number of individuals. These SNP could be selected as those SNP from sequence-based GWAS studies that show the highest association to the most important traits or that explain genetic covariance across breeds. An alternative approach is to select SNP that are most likely to be functional when assessing the annotation information. This approach of genotyping directly for potentially important SNP, has the big advantage that sequence variants which are inaccurately imputed in all genotyped individuals, can be genotyped accurately for phenotyped individuals. Consequently, the associations may increase further to reach their full potential to improve genomic predictions.
The validity of this approach has been demonstrated within breed by Brøndum et al. (Reference Calus, de Haas and Veerkamp2015). Here, 1623 QTL markers were selected based on GWAS results on WGS data within Nordic Holstein, Jersey and Red with the aim of including them on a custom low density chip. Markers were mainly selected based on their genome wide significance for the 16 traits included in the Nordic total merit index, but functional annotation of significant markers was also taken into account. When including these QTL markers along the routinely used 50 k genotype data in genomic prediction, in Nordic Holstein, Nordic Red and an independent data set of French Holsteins, gains in reliability of up to 5% were found for production traits and minor gains of 1% to 2% were found for fertility and mastitis.
Using information across breeds will only be efficient for the fraction of the genetic variance caused by causative variants that segregate in both breeds. It is unclear how large the shared variance across breeds is. Generally, QTL studies are not consistent in finding the same regions across different breeds. This is likely due to a lack of power to identify QTL in smaller populations but also indicates that part of the genetic variance is likely to be private to specific breeds. With continuously more detailed genetic information from genotyping and sequencing, it would be useful to perform a powerful analysis to assess to which extend genetic variance is private within breeds or shared among breeds. Another reason for the lack of consistency across breeds could be epistatic interactions among genes. In this case the effect of a particular QTN depends on the frequency of genes it interacts with (e.g. Carlborg et al., Reference Chen, Li, Miller and Schenkel2003; Huang et al., Reference Huang, Richards, Carbone, Zhu, Anholt, Ayroles, Duncan, Jordan, Lawrence, Magwire, Warner, Blankenburg, Han, Javaid, Jayaseelan, Jhangiani, Muzny, Ongeri, Perales, Wu, Zhang, Zou, Stone, Gibbs and Mackay2012). As these could have very different frequencies among breeds it results in breed-specific effects. A third reason for breed-specific traits could be dominant gene actions of variants with different allele frequencies among breeds. It would be useful to study if the lack of shared genetic variance among breeds is caused by such epistatic interactions. This could probably most efficiently be carried out in large data sets of genotyped and phenotyped individuals, where markers in LD with potentially interacting QTL can be observed for the same individuals as the phenotypes. Such large data sets are presently becoming available in dairy cattle. Accommodating for gene-background interactions can remain a bottleneck in across breed prediction and may not be trivial. Including marker by breed interactions in multi-breed models will essentially disconnect the marker effects between breeds, and therefore fall back to a within-breed analysis. Thus, relatively sophisticated models should be developed, for instance, to separate markers in those that are consistent between breeds and those that are not consistent between breeds or to allow marker effects to be partitioned into shared and breed-specific components.
Conclusion
For breeds with a small number of proven bulls to include in a reference for genomic prediction, the most straightforward way to increase the reliability is to increase the number of animals in the reference either via international collaborations or by genotyping a large number of cows, and using their phenotypes directly rather than summarized in the bull EBVs. Gains can also be found by using cow phenotypes without genotypes in a single-step BLUP model. There is also potential for increasing the reliability by using information from different but numerically larger breeds, but the advantage decreases with the genetic distance. Some of this disadvantage might, however, be alleviated by using more sophisticated Bayesian methods in combination with sequence or dense marker information.
Acknowledgment
This work was supported by a grant 12-132452 (GenSAP: Genomic Selection in Animals and Plants) from the Danish strategic research council.


