


1. Introduction
Alzheimer’s disease (AD) is a neurodegenerative disease characterized by the accumulation of amyloid plaques and neurofibrillary tangles in neuron cells and which is manifested by the gradual development of dementia symptoms, including profound impairment of cognitive abilities (Rahman et al., Reference Rahman, Islam, Zaman, Shahjaman, Karim, Huq, Quinn, Holsinger and Moni2020). The pathobiology of the AD is complex with genetic and epigenetic events are involved in the disease pathogenesis (Stoccoro & Coppede, Reference Stoccoro and Coppede2018). While the hallmarks of the disease include the accumulation of amyloid plaques and neurofibrillary tangles in the brain (Dunckley et al., Reference Dunckley, Beach, Ramsey, Grover, Mastroeni, Walker, LaFleur, Coon, Brown, Caselli, Kukull, Higdon, McKeel, Morris, Hulette, Schmechel, Reiman, Rogers and Stephan2006), how these are related to AD development and, indeed, what are the key underlying mechanisms of AD is uncertain. A number of gene expression profiling studies have been performed comparing neuronal tissues of AD and control patients, including microarray gene expression analysis and array or sequencing-based analyses of bisulfite converted DNA to detect differences in gene methylation levels (Chouliaras et al., Reference Chouliaras, Mastroeni, Delvaux, Grover, Kenis, Hof, Steinbusch, Coleman, Rutten and van den Hove2013; Coppieters et al., Reference Coppieters, Dieriks, Lill, Faull, Curtis and Dragunow2014). The latter identifies and quantifies a key (though not the sole) epigenetic control of gene expression since a methylated gene promoter generally has blocked transcription. However, a combined approach to integrate gene expression and gene methylation data could uncover epigenetic signatures in AD.
Epigenetic mechanisms, including DNA methylation and histone modifications, play a crucial role in the development of the AD (Sanchez-Mut & Graff, Reference Sanchez-Mut and Graff2015). Therefore, identification of methylated-differentially expressed genes (MDEGs) and discovering pathways may be useful for the clarification of how these and other mechanisms associated with AD may be controlled. Earlier studies have identified gene signatures in AD (Rahman et al., Reference Rahman, Islam, Zaman, Shahjaman, Karim, Huq, Quinn, Holsinger and Moni2020; Semick et al., Reference Semick, Bharadwaj, Collado-Torres, Tao, Shin, Deep-Soboslay, Weiss, Weinberger, Hyde, Kleinman, Jaffe and Mattay2019). These studies provided gene signatures focused on either gene expression or methylation profiling. To provide an in-depth understanding of the biological mechanisms of AD, a conjoint analysis of gene expression and gene methylation analysis is considered.
1.1 Objective
In this study, we performed bioinformatic analysis of gene expression (mRNAs) and DNA methylation data from AD-affected neural tissues to identify differentially expressed genes (DEGs) and differentially methylated genes (DMGs), respectively. We aimed to identify overlapping methylated differentially expressed genes (MDEGs) to provide novel insights in AD pathogenesis. Our workflow of the analysis is summarized in Fig. 1.
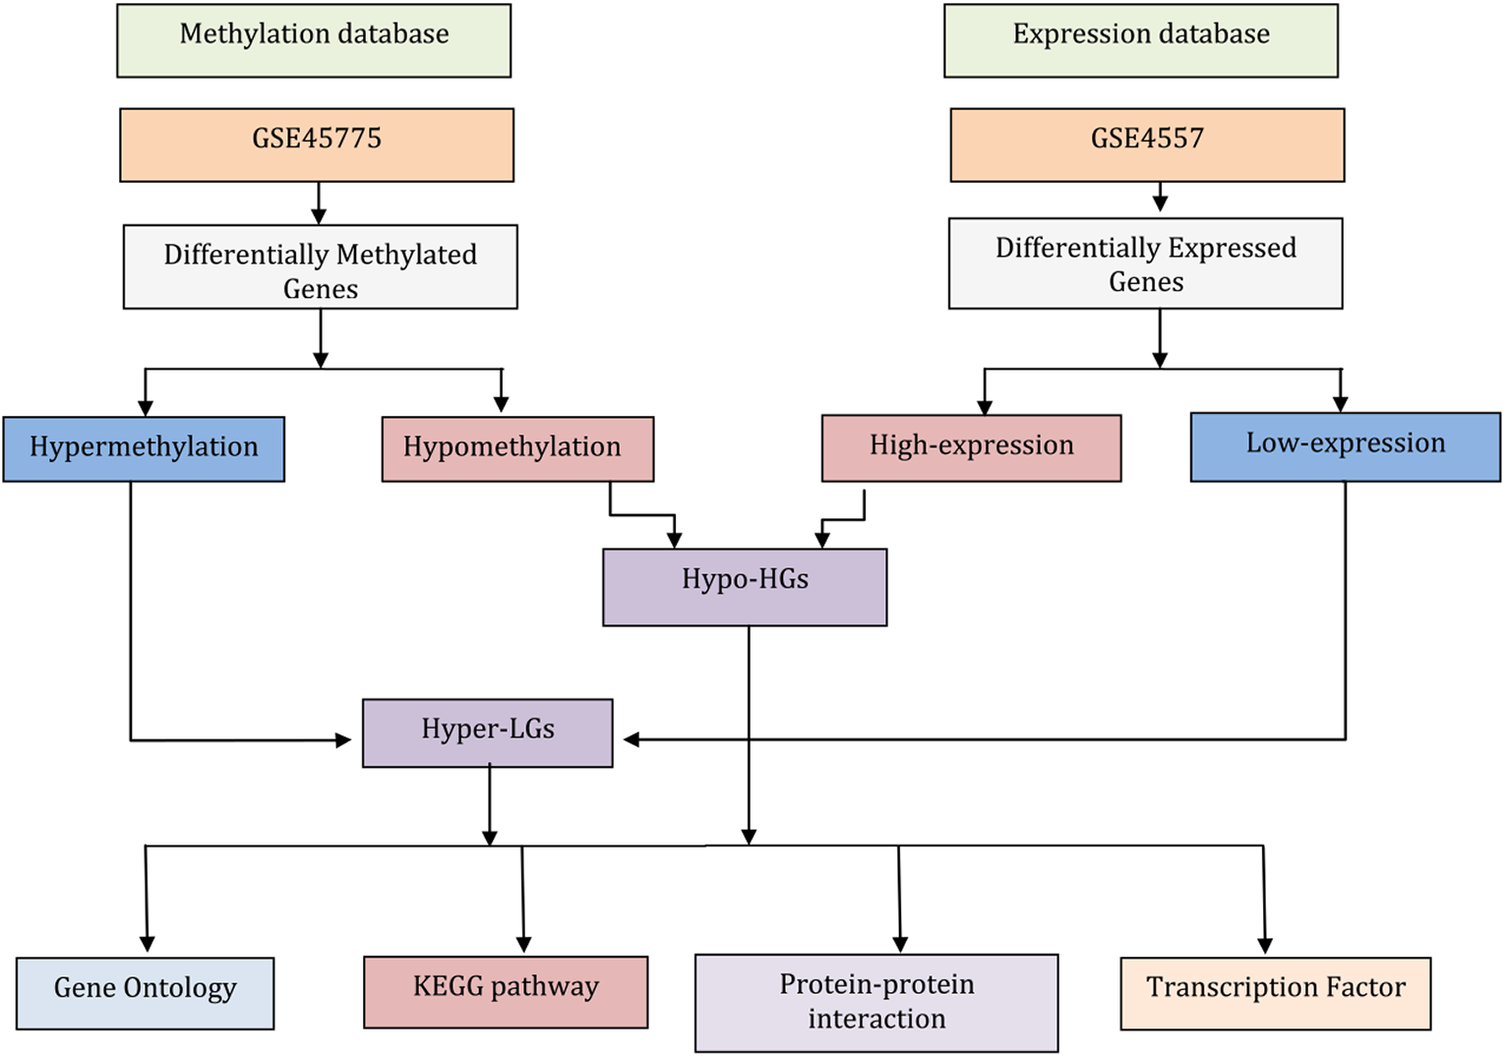
Figure 1. Flowchart describing the data analysis processes in this work. The gene expression data for neurons from post-mortem brain tissue from Alzheimer’s disease (AD) patients and matched controls were used to identify differentially expressed genes (DEGs). Similarly, genome-wide DNA methylation data of AD compared matched controls were subjected to identify differentially methylated genes (DMGs). Comparing highly expressed genes with hypomethylation genes (i.e., genes that have high expression levels because of a lack of suppression by methylation) identified the genes termed here Hypo-HGs. Similarly, low-expression genes with hypermethylation (suggesting low expression levels due to suppression methylation) identified the genes termed here Hyper-LGs. Then, we annotated Hypo-HGs and Hyper-LGs using Gene Ontology (GO) and KEGG pathway to identify GO and pathway. The protein-protein interaction (PPI) networks of the Hypo-HGs and Hyper-LGs were also investigated to identify hub genes for these networks. Gene-transcription (TF) factor analysis was also performed to detect potential key regulators of the activities of these genes.
2. Methods
2.1 Acquisition of transcriptomic and DNA methylation datasets
We utilized mRNA gene expression profiling data (GSE4757) and DNA methylation profiling data (GSE45775) from studies of AD and control samples of brain tissue. These datasets were obtained from the NCBI-GEO database. The GSE4757 mRNA profiling datasets contained 20 samples that consisted of 10 AD tissue samples and 10 non-AD control tissue samples. Samples were obtained from the same patient and the same brain region. Selected neurons containing neurofibrillary tangles and normal neurons from the entorhinal cortex of 10 mid-stage AD cases via laser capture microdissection were used for gene expression dataset. The methylation microarray data from GSE45775 dataset contained 20 samples that included 15 AD tissues and 5 control samples which consisted of DNA methylation profiling of normal hippocampus and different Alzheimer Braak stages hippocampus samples. The entorhinal cortex is an area of the brain located in the medial temporal lobe which has a central role in neuronal networks that underlie memory functions. Similarly, the hippocampus also plays a key role in memory and knowledge acquisition. It was recently determined that the entorhinal cortex could be a new player for memory formation that works in parallel to the hippocampus (O’Neill et al., Reference O’Neill, Boccara, Stella, Schönenberger and Csicsvari2017). Although data obtained from the two different brain regions were integrated in the present study, both of these brain regions are thought to participate in memory functions.
2.2 Data processing and identification of differentially expressed genes
We employed GEO2R web-utility to identify DEGs and differentially methylated genes (DMGs) by comparing AD samples compared to control. The microarray datasets were processed and normalized in GEO2R. A p-value < 0.05 and |t| > 2 was considered as the cut-off criteria to identify the DEGs and DMGs. We identified overlapping MDEGs between the GSE4757 and GSE45775 datasets. The mutually common genes between down-regulated and hypermethylation genes were termed as hypermethylated-lowly expressed genes (Hyper-LGs). Similarly, the common genes between upregulated and hypomethylation genes were regarded as hypomethylated-highly expressed genes (Hypo-HGs).
2.3 Functional and pathway enrichment analysis
We performed functional annotation of the identified MDEGs via Enrichr (Kuleshov et al., Reference Kuleshov, Jones, Rouillard, Fernandez, Duan, Wang, Koplev, Jenkins, Jagodnik and Lachmann2016) to detect Gene ontology (GO) terms and KEGG pathways. p-value < 0.05 was considered as statistically significant for enrichment analysis.
2.4 Protein interactome analysis
We utilized the STRING database (Szklarczyk et al., Reference Szklarczyk, Morris, Cook, Kuhn, Wyder, Simonovic, Santos, Doncheva, Roth, Bork, Jensen and Von Mering2017) to study the protein-protein interaction (PPI) network for Hyper-LGs and Hypo-HGs the via NetworkAnalyst (Xia et al., Reference Xia, Gill and Hancock2015). The hubs were selected based on degree >20 to identify a high number of interacting hub proteins in the PPI networks.
2.4.1 Transcription factor analysis
We have analyzed and identified the regulatory transcription factors (TFs) that interact with MDEGs, suggesting these TFs may regulate the identified MDEGs utilizing the TRNASFAC and JASPAR databases via Enrichr (Kuleshov et al., Reference Kuleshov, Jones, Rouillard, Fernandez, Duan, Wang, Koplev, Jenkins, Jagodnik and Lachmann2016). A p-value < 0.05 was considered to designate the statistically significant TFs.
3. Results
3.1 Methylated differentially expressed genes in AD
We analyzed the gene expression and methylation data to identify DEGs or DMGs. We identified overlapping genes, termed here 18 Hyper-LGs, by matching down-regulated DEGs with the hypermethylated DMGs; 10 Hypo-HGs were identified by comparing and up-regulated DEGs and hypomethylated DMGs.
To clarify the biological significance of the identified MDEGs, GO enrichment analysis was performed (Table S1). With regard to Hyper-LGs, enriched biological processes (BP) included notably positive regulation of potassium ion transport, and regulation of glucose metabolic process. The enriched GO terms for Hypo-HGs were enriched in BP included positive regulation of transcription.
3.2 Molecular pathways from epigenetic perspective
The Hyper-LGs demonstrated enrichment in pathways of nitrogen metabolism, nicotine addiction, neuroactive ligand-receptor interaction, amyotrophic lateral sclerosis (ALS). Hypo-HGs were significantly involved in hippo signaling pathway, cGMP-PKG signaling pathway, alcoholism, TGF-beta signaling pathway (Table 1:).
Table 1. Pathway analysis of methylated-differentially expressed genes related to Alzheimer's disease patient samples.

3.3 Protein-protein Interaction to identify hub proteins
We analyzed the PPI of MDEGs. The Hyper-LGs PPI network had 208 nodes and 209 edges (Fig. 2), while the Hypo-HGs network consisted of 542 nodes and 574 edges (Fig. 3). Thetopological analysis showed hub genes for both the Hyper-LGs and Hypo-HGs networks. Hub proteins (TOMM22, TBX5, ANK2, GRIA2, COPS7B, RORA) were detected as Hyper-LGs, while hub proteins (BMP2, GATA4, HDAC11, GGA2, CREB3, RASSF1) were identified for Hypo-HGs.
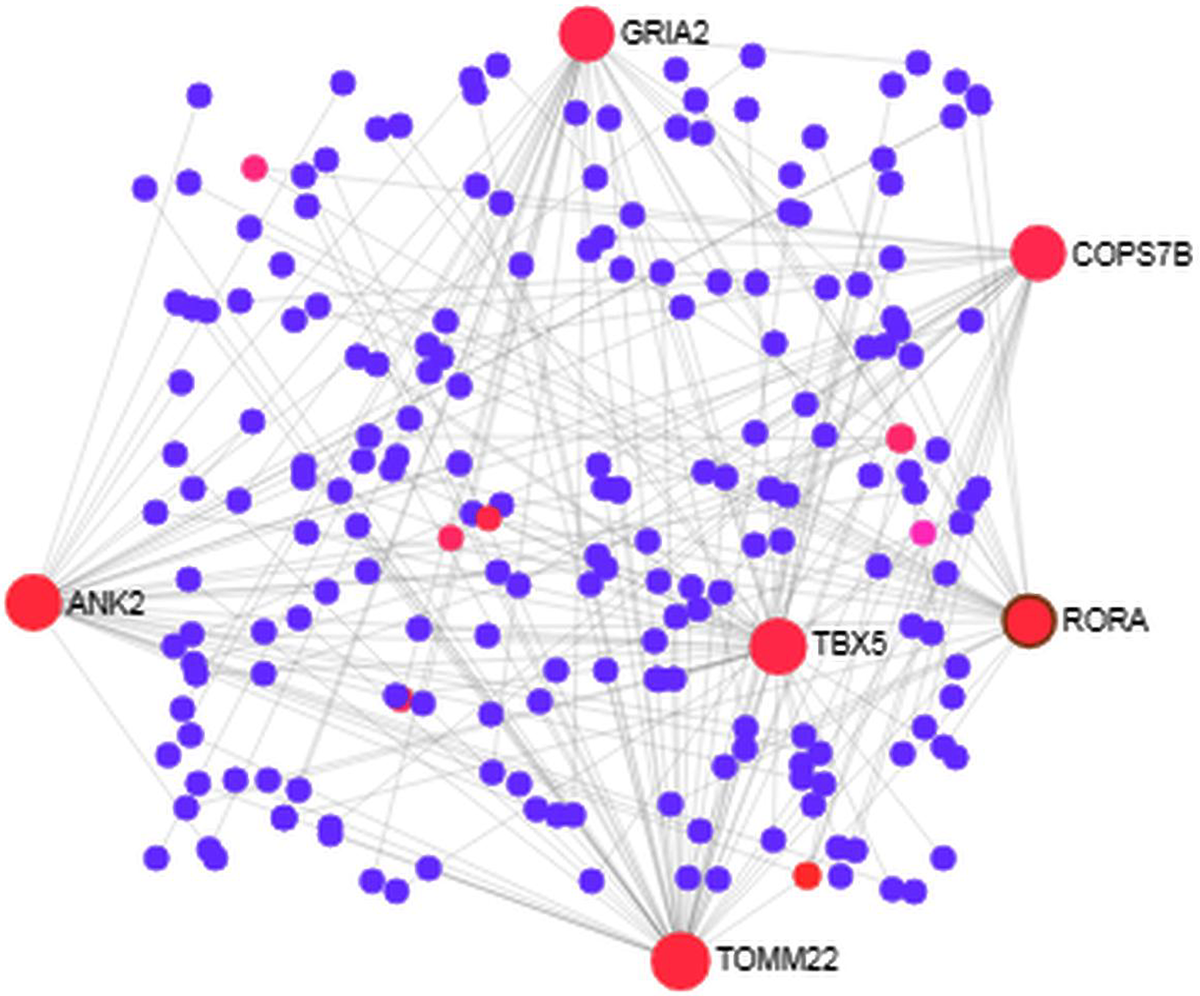
Figure 2. Protein-protein interaction analysis of the Hyper-LGs in Alzheimer’s disease. The proteins are represented in nodes (blue and red). Red nodes are marked as hub nodes. The larger node size indicates their degree in topological analysis. Edges in gray show the interactions among interacting proteins in the network.
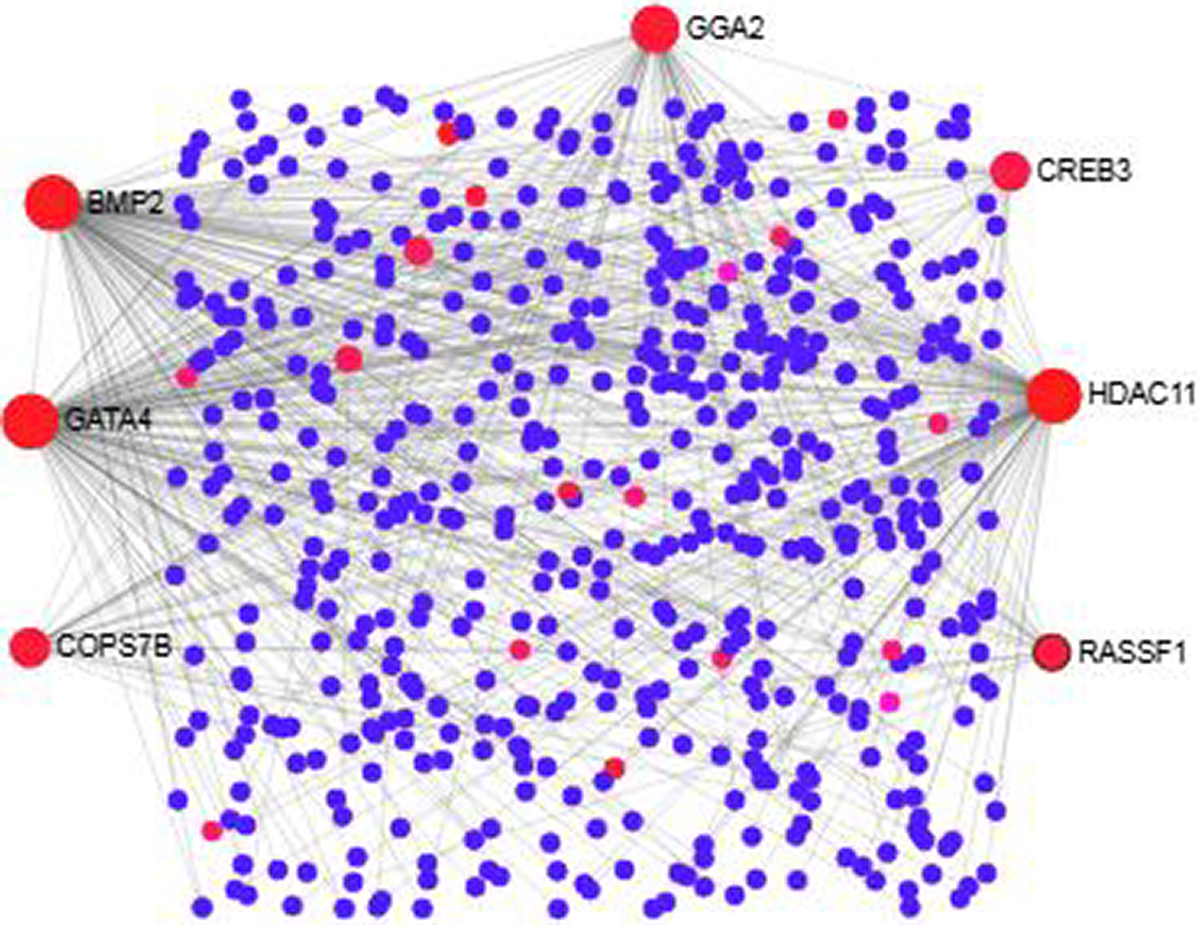
Figure 3. Protein-protein interaction analysis of the Hypo-HGs in Alzheimer’s disease. The proteins are represented in nodes (blue and red). Red nodes are marked as hub nodes. The larger node size indicates their degree in topological analysis. Edges in gray show the interactions among interacting proteins in the network.
3.3.1 Transcription factors of methylated-differentially expressed genes
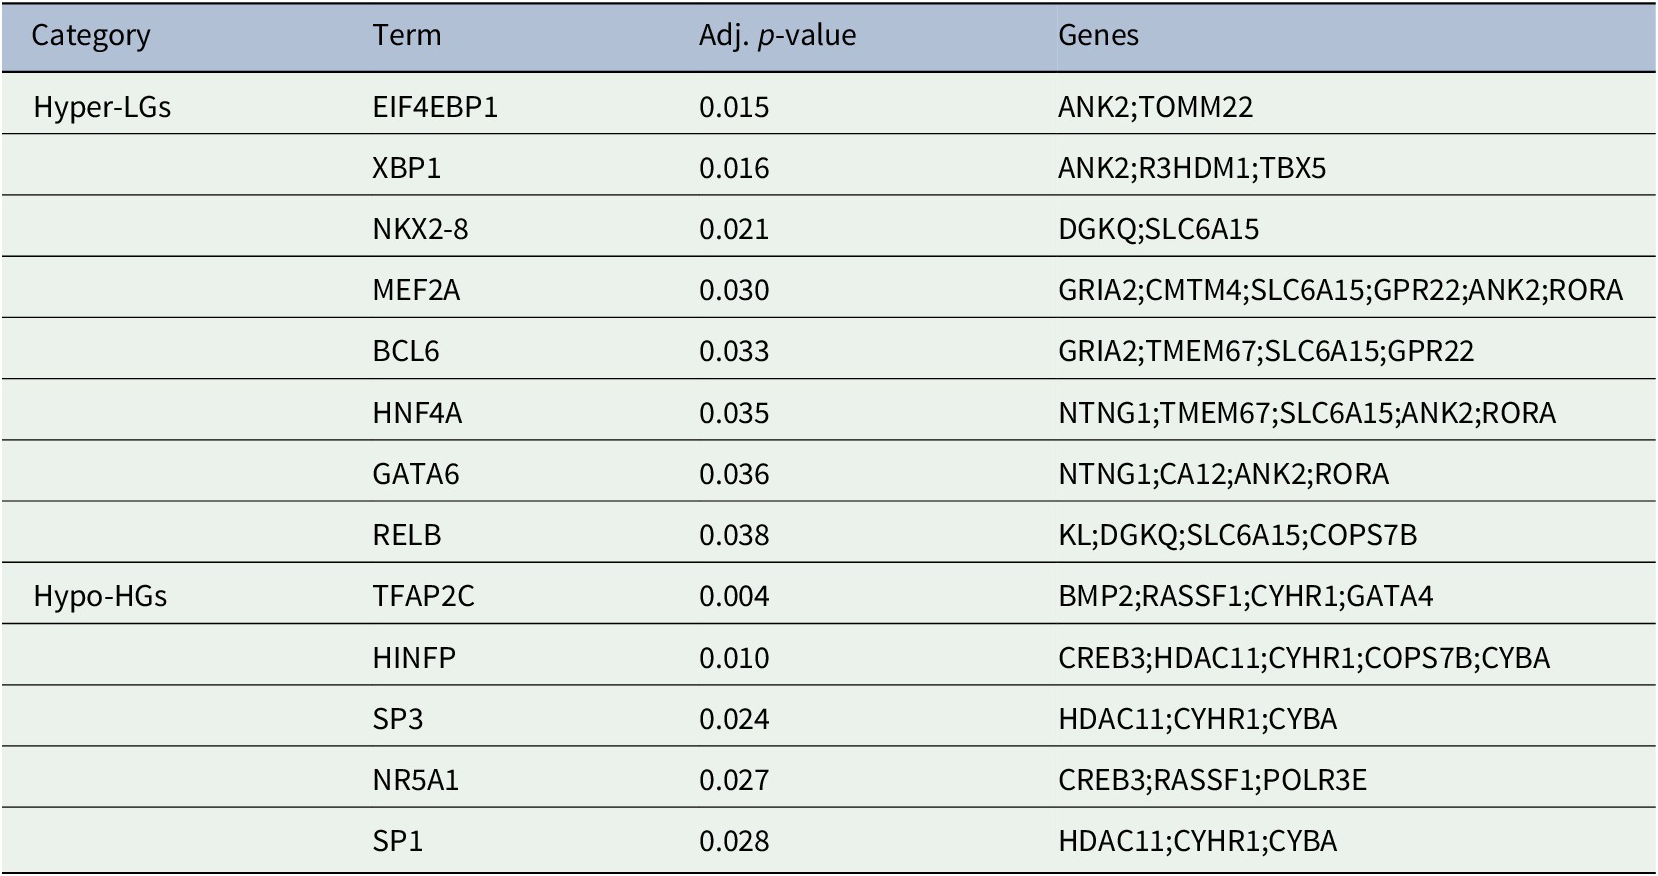
The generation of gene products can be regulated at both transcriptional and post-transcriptional levels. The TFs directly regulate the expression (i.e., transcription) of DEGs, thus we sought to detect the TFs that may regulate the MDEGs. Table 2: showed the TFs that regulate the MDEGs.
Table 2. Transcription factors of methylated-differentially expressed genes related to Alzheimer's disease patient samples.
4. Discussion
The development and progression of AD is the result of complex interplay of epigenetics and genetics mechanisms at multistage. Epigenetic perturbation, especially of DNA methylation, contributes immensely to the pathobiology of AD (Stoccoro & Coppede, Reference Stoccoro and Coppede2018; Kawalia et al., Reference Kawalia, Raschka, Naz, de Matos Simoes, Senger and Hofmann-Apitius2017). The identification of potential biomarkers for AD will not only improve the understanding of how the pathogenesis of AD is controlled but may also open new avenues of treatment strategies. We identified 18 Hyper-LGs and 10 Hypo-HGs as key gene signature in AD. The enrichment and PPI analysis provided significant pathways and methylated hub genes which may provide novel insights into the pathogenesis of AD. The pathway analysis of Hyper LGs showed enriched ALS pathways (Rusina et al., Reference Rusina, Sheardova, Rektorova, Ridzon, Kulist’ak and Matej2007) in ALS patients may be accompanied by cognitive impairment and existence of neurofibrillary tangles and plaques affecting neurons, (Rusina et al., Reference Rusina, Sheardova, Rektorova, Ridzon, Kulist’ak and Matej2007) suggesting the importance of the identified pathways in AD pathogenesis (Ravetti et al., Reference Gomez Ravetti, Rosso, Berretta and Moscato2010). Our analysis also showed pathways enriched by Hypo-HGs. Among the pathways, the pre-activation of hippo signaling pathway is associated with neurodegenerative diseases including AD (Mueller et al., Reference Mueller, Glajch, Huizenga, Wilson, Granucci, Dios, Tousley, Iuliano, Weisman, LaQuaglia, DiFiglia, Kegel-Gleason, Vakili and Sadri-Vakili2018). We obtained “alcoholism pathway” enriched by the MDEGs, which probably plays roles in AD pathogenesis because the alcohol has been found to be involved in neuroinflammation in dementia, suggesting an additional mechanism in neurodegenerative disease. Our analysis identified “TGF-beta signaling pathway” as involved in AD. Increasing evidence suggests that dysregulation of TGF-beta signaling pathway play critical roles in AD (von Bernhardi et al., Reference von Bernhardi, Cornejo, Parada and Eugenin2015). In brief, in order to identify new therapeutic targets, exploration of signaling pathways and biomarkers involved in MDEGs will provide new understanding about AD pathogenesis.
We studied the PPI based on the proteins encoded by the MDEGs. Among the hubs, TOMM22 serve as the main receptor for accumulation of amyloid β (Aβ) peptides in AD (Hu et al., Reference Hu, Wang and Zheng2018). Previous studies showed that the gene ANK2 is involved in AD (Higham et al., Reference Higham, Malik, Buhl, Dawson, Ogier, Lunnon and Hodge2018). Our analysis also detected RORA as a hub which is distinctively overexpressed in the hippocampus of AD brain (Acquaah-Mensah et al., Reference Acquaah-Mensah, Agu, Khan and Gardner2015). With regard to Hypo-HGs, we detected seven hub proteins, including BMP3, GATA4, HDAC11 and CREB, which have been previously described in brain functions and neurodegenerative diseases. Among these hubs we noted BMP2, the nuclear form of BMP2 has previously been shown to play a role in hippocampus memory formation (Cordner et al., Reference Cordner, Friend, Mayo, Badgley, Wallmann, Stallings, Young, Miles, Edwards and Bridgewater2017). Transcription factor GATA4 has been shown to be significantly differentially expressed in AD compared to controls (Garranzo-Asensio et al., Reference Garranzo-Asensio, San Segundo-Acosta, Martinez-Useros, Montero-Calle, Fernandez-Acenero, Haggmark-Manberg, Pelaez-Garcia, Villalba, Rabano, Nilsson and Barderas2018). It should also be noted that HDAC inhibitors are known to be a potential drug target in AD (Yang et al., Reference Yang, Zhang, Wang and Zhang2017) so HDAC11 could be a novel drug target for AD. CREB signaling has been a known link to neurodegenerative disorders and plays many important roles in brain cell functions (Saura & Valero, Reference Saura and Valero2011).
With regard to the Hyper-LGs that we detected, one study detected identified loci in EIF4EBP1 as associated with late onset AD (Nalls et al., Reference Nalls, Guerreiro, Simon-Sanchez, Bras, Traynor, Gibbs, Launer, Hardy and Singleton2009). A study has suggested that XBP1 was a risk factor for developing AD (Duran-Aniotz et al., Reference Duran-Aniotz, Cornejo, Espinoza, Ardiles, Medinas, Salazar, Foley, Gajardo, Thielen, Iwawaki, Scheper, Soto, Palacios, Hoozemans and Hetz2017). In addition, XBP1 dysregulation has a profound impact on immune systems, inflammatory response and implicated in complexes diseases including AD (Cisse et al., Reference Cisse, Duplan and Checler2017). A polymorphism in MEF2A could be involved in AD pathogenesis (González et al., Reference González, Alvarez, Menéndez, Lahoz, Martínez, Corao, Calatayud, Peña, García-Castro and Coto2007). Variation in RELB impacts upon hippocampal function in late onset AD (Xiao et al., Reference Xiao, Chen, Goldman, Tan, Healy, Zoltick, Das, Kolachana, Callicott, Dickinson, Berman, Weinberger and Mattay2017). With regard to Hypo-HGs, increased expression of SP3 observed in brains of AD patients (Boutillier et al., Reference Boutillier, Lannes, Buee, Delacourte, Rouaux, Mohr, Bellocq, Sellal, Larmet, Boutillier and Loeffler2007). The overexpression of SP1 in AD subjects was reported and suggested as a therapeutic target to help prevent AD (Citron et al., Reference Citron, Dennis, Zeitlin and Echeverria2008). However, it should be noted that our study has some limitations in that it does not include data on gene expression or the methylation profiles of the genes in the same brain region. This is due to the lack of any available datasets to investigate these aspects. Thus, although we have uncovered a number of potentially important hub genes and pathways, they require further experimental verifications to establish them as having a definite role AD pathobiology.
5. Conclusions
In the present study, we have analyzed gene expression and DNA methylation profiling in AD. We identified 28 MDEGs and pathway analysis revealed significant enrichment of pathways related to AD pathogenesis. The PPI analysis revealed hub Hyper-LGs of AD included TOMM22, TBX5, ANK2, GRIA2, COPS7B, RORA; such genes for Hypo-HGs included BMP2, GATA4, HDAC11, GGA2, CREB3, RASSF1. Regulatory TFs (EIF4EBP1, XBP1, NKX2-8, MEF2A, BCL6, HNF4A, GATA6, RELB) were identified among the hyper-LGs; similarly we identified TFs (TFAP2C, HINFP, SP1, SP3, NR5A1) influencing Hypo-HGs. Since these are robust candidate genes based on dysregulated methylation, it is possible that these or some significant downstream gene transcription targets of these TFs may be useful for diagnostics (in the case of secreted TFs detectable in the blood) and possibly as treatment targets for AD. The present study improves our understanding of the epigenetic in the pathobiology of AD and identified a number of potential AD biomarkers for further investigation in experimental studies.
Acknowledgements
Authors would like to thank Mr Humayan Kabir Rana for critical reading of the manuscript.
Author contributions
MRR conceived and designed the study; MRR and TI analyzed data; MRR wrote the draft manuscript; EG, JMWQ, and MAM reviewed and edited the manuscript; MAM supervised the project.
Funding information
This research received no specific grant from any funding agency, commercial or not-for-profit sectors.
Conflict of interest
The authors declare that there is no conflict of interest.
Data availability
Gene expression profiling data with accession GSE4757 and DNA methylation profiling data with accession GSE45775 are publicly available at the Gene Expression Omnibus database (https://www.ncbi.nlm.nih.gov/geo/).
Supplementary Materials
To view supplementary material for this article, please visit http://dx.doi.org/10.1017/exp.2020.65.


 Open access
Comments
Comments to the Author: Title: Identifying the Function of Methylated Genes in Alzheimer’s Disease to Determine Epigenetic Signatures: A Comprehensive Bioinformatics Analysis
In the present manuscript the authors apply a variety of bioinformatics approaches to identify differentially methylated genes and differentially expressed genes from available datasets on Alzheimer's disease to understand their biological pathways and interconnections. This manuscript is very interesting and advance epigenetics filed of Alzheimer's disease. The manuscript is clearly written and the results are well presented, but I suggest some minor revisions:
1) The manuscript should be improved in the level of detail and description of both materials and method and results, including figure captions.
2) The significance of the hub genes should be stressed in the discussion section.
3) The discussion section should be concise
4) Please check for grammar and typos. (for example, interaction is misspelt in discussion).