Introduction
Because of its low thermal conductivity, snow is an effective insulator that plays a key role in sea-ice thermodynamics. In the case of ice formation, the role of snow is often perceived as negative in that it retards the conductive heat flow through the ice, which reduces bottom growth rates and controls the ice thickness. On the other hand, if snow accumulates to sufficient depth and mass that overcome the buoyancy of the ice, the effect can be positive due to flooding and subsequent snow-ice formation on top of floes. Snow-ice formation is widespread in the Antarctic pack ice (e.g. Reference Lange, Schlosser, Ackley, Wadhams and DieckmannLange and others, 1990; Reference Eicken, Lange, Hubberten and WadhamsEicken and others, 1994; Reference Worby, Massom, Allison, Lytle, Heil and JeffriesWorby and others, 1998), and in some regions (e.g. the Ross Sea) it makes a greater contribution than either frazil ice or congelation ice to the thermodynamic thickening of the ice cover (e.g. Reference Jeffries, Krouse, Hurst-Cushing and MaksymJeffries and others, 2001).
Thickening by accretion of congelation ice at the bottom and snow ice at the top of floes is primarily a cold-season occurrence. During the warm season, Antarctic floes remain snow-covered and it was once believed that the snow did not melt at all (Reference Andreas and AckleyAndreas and Ackley, 1982). However, there is now ample evidence that melting and refreezing in the snow is widespread (Reference Haas, Thomas and BareissHaas and others, 2001; Reference Morris and JeffriesMorris and Jeffries, 2001) and contributes to warm-season ice formation at the top of the ice in both the pack-ice and landfast-ice zones (Reference Jeffries, Shaw, Morris, Veazey and KrouseJeffries and others, 1994, Reference Jeffries, Worby, Morris and Weeks1997; Reference Kawamura, Ohshima, Takizawa and UshioKawamura and others, 1997; Reference Eicken and JeffriesEicken, 1998; Reference Haas, Thomas and BareissHaas and others, 2001).
Melt/freeze cycles in the snow in the warm season affect electromagnetic properties and remote-sensing signatures (e.g. Reference HaasHaas, 2001). They also promote biological activity, including high algal standing stocks, at the ice surface (Reference Fritsen, Coale, Neenan, Gibson and GarrisonFritsen and others, 2001; Reference Haas, Thomas and BareissHaas and others, 2001). Superimposed-ice formation associated with melt/freeze at the top of floes and landfast ice affects their mass balance, strength and durability (Reference Kawamura, Ohshima, Takizawa and UshioKawamura and others, 1997; Reference Haas, Thomas and BareissHaas and others, 2001).
This paper adds to the evidence for melt/freeze cycles in snow and superimposed-ice formation at the top of floes in summer in the Antarctic pack ice. Specifically, we discuss the oxygen isotopic composition, density and salinity of ice blocks and layers with a distinctive polygonal granular crystal texture that were perched on slush, had accumulated directly on the ice surface, and were ‘buried’ below the ice surface in the Ross Sea.
Methods
A total of 65 ice cores with a total length of 63.68 m were obtained in January 1999 from 29 ice floes in the central and eastern Ross Sea (Fig. 1). Three floes (008, 017, 028) were multi-year ice that was distinguished from first-year floes by a higher freeboard, due to deeper snow and thicker ice, and a rougher, more deformed surface. The depth of standing water/slush on the ice at the bottom of the snow was measured at 1m intervals along 150 m transects prior to drilling and measuring ice thicknesses on 20 floes. At each floe, the snow cover and slush were sampled, as described in Reference Morris and JeffriesMorris and Jeffries (2001), and a surface sea-water sample was taken using standard oceanographic techniques. In the science freezer aboard the ship, the cores were split and vertical thick sections made along the entire length of each core. The sections were illuminated between crossed polarizers, and the stratigraphy and crystal texture of the ice were documented. One-half of the split core was sampled according to stratigraphic and textural variability. Those samples were melted and, together with snow, slush and sea-water samples, sent to the University of Calgary for analysis of 18O/16O ratios using standard mass-spectrometer techniques. Four half-cores and three ice blocks that had been removed from the snow cover were shipped frozen to Hokkaido University. There, the stratigraphy and texture were documented. The ice density was then calculated from the measured volume and weight of rectangular ice pieces. The pieces were melted for salinity and oxygen isotope analysis (in Calgary), and thin sections were made and photographed in plain and polarized light.
Fig. 1. Map of the study area and track of R.V. Nathaniel B. Palmer in the central and eastern Ross Sea in early 1999. Floes that were investigated are identified by Julian days 001 (1 January) to 033 (2 February).
Results
The snow cover was isothermal and close to the melting point, and there were frequent small ice lenses and pipes (Reference Fritsen, Coale, Neenan, Gibson and GarrisonFritsen and others, 2001; Reference Morris and JeffriesMorris and Jeffries, 2001). Snow samples with a salinity <1‰ had very low δ18O values (Table 1). The ice lenses and pipes had very low salinity values and δ18O values almost identical to those of the snow (Table 1).
Table 1 Mean (±1s.d.) salinity and δ18O values of snow, ice lenses and pipes, and slush. Values in parentheses are the number of samples analyzed
The snow cover remained intact throughout the cruise, and no melt ponds were observed on the surface of floes. However, there was widespread flooding at the base of the snow on all floes. Prior to drilling, 56% of the ice surface along the 150m ice-thickness transects was flooded to a mean depth of 0.121 m (n = 1529). The slush had salinity and δ18O values intermediate between those of snow and sea water (Table 1 and 2).
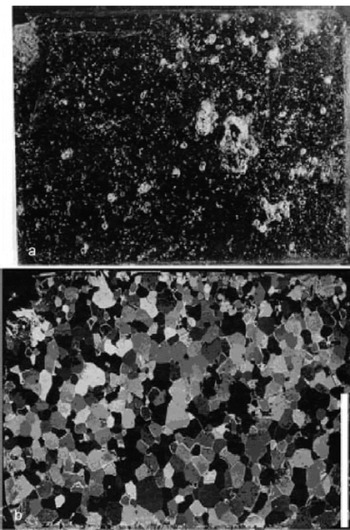
Throughout the study area a layer of consolidated ice could be found at the bottom of the snow cover ‘perched’ directly on top of the slush layer and not in direct contact with the underlying ice surface. These 0.03–0.15m thick layers were not continuous, and a thorough search was often required to find them. Particularly thick (0.15 m) perched ice layers were common during the early days of the cruise (floes 001–005; Fig. 1). They were characterized by a blocky appearance and rough bottom surface. Three ice blocks, up to 0.2m wide and 0.15 m thick, were taken for further examination. They were hard and glassy, with a mean density of 862 kg m–3 (n = 12) and had numerous air inclusions (Fig. 2a). The crystal texture was characterized by polygonal granular (PG) crystals with typical dimensions of 5–10 mm (Fig. 2b). The very low salinity and δ18O values were similar to those of the snow and ice lenses/pipes in the snow cover (Table 1).

Fig. 2. Thin section (a) in plain light and (b) between crossed polarizers of an ice block that was ‘perched’ on the slush at the bottom of the snow cover. The horizontal white bar at the right of (b) represents 30 mm.
PG ice layers with characteristics very similar to the perched ice blocks in the snow cover were found at the top of six cores from first-year floes 001, 002, 004 and 005 at latitudes 65–69˚ S along 165˚W longitude (Fig. 1). The thickness of the first-year PG ice layers ranged from 0.105 to 0.2 m. They contained numerous small inclusions, but the ice was much clearer than that below (Fig. 3). The polygonal grains were much larger than those in orbicular granular snow ice (Fig. 3a) and frazil ice, and, not surprisingly, quite different in appearance to columnar ice and platelet ice. The PG layers had very low salinity (mean = 0.05 ± 0.01‰, n = 2, core 005-01) and δ18O values compared to the ice below (e.g. Fig. 4a). δ18O values were very close to those of snow and much lower than those of slush and sea water (Table 1 and 2). The density of first-year PG ice was measured only on two samples from core 005-01 (mean = 897 ± 3 kg m–3).
Fig. 3. Polygonal granular ice at the top of core 005-01 (a) in plain light and (b) between crossed polarizers. The horizontal white bar at the top of (b) represents 30 mm.
Fig. 4. Salinity and δ18O profiles in (a) first year ice core 005-01 and (b) multi-year ice core 017-01. The stratigraphy and ice types in each core are identified on the right side of each graph with abbreviations PG (polygonal granular ice), SI (snow ice), FI (frazil ice) and CI (congelation ice).
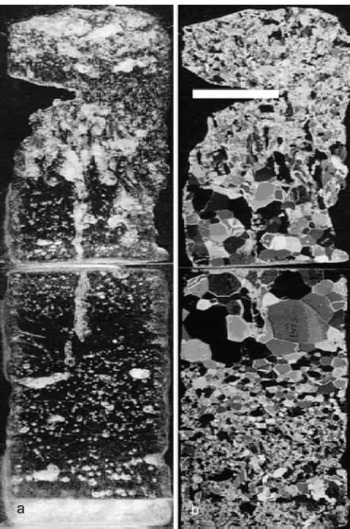
PG ice layers were also found in three cores from multi-year floes (cores 008-02, 008-03 and 017-01; Fig. 1). Unlike the first-year PG layers, those in the multi-year ice were ‘buried’ below the surface. The thickness of the multi-year PG ice layers ranged from 0.11 to 0.29 m and the mean density was 816 ± 44 kg m–3. Like the first-year PG ice, the multi-year PG ice contained far fewer inclusions (Fig. 5a) than, and was texturally quite different from, the ice above and below (Fig. 5b). The PG layer in core 017-01 was notable for an upper zone of very coarse crystals (the largest of all the PG crystals we observed) and a lower zone of finer-grained crystals (Fig. 5b). Note also the vertically oriented tubular feature that appears to penetrate the PG layer from above (Fig. 5a). A similar feature occurred in the PG layer in core 008-02.
Fig. 5. Polygonal granular ice at the top of multi-year ice core 017-01 (a) in plain light and (b) between crossed polarizers. The horizontal white bar near the top of (b) represents 30 mm.
The δ18O values of multi-year PG ice were not as low as those in the first-year cores (Table 2), but were still significantly different from the other ice types (Table 2). The salinity and δ18O profiles for a core with ‘buried’ PG ice emphasize these differences (Fig. 4b). The mean salinity of the PG layers in the multi-year cores was 2.1 ± 1.3‰ (n = 15).
Table 2 Mean (±1s.d.) δ18O values of sea water, slush, snow and ice types in ice cores. Values in parentheses are the number of samples analyzed. FY, first-year ice; MY, multi-year ice
Discussion
The PG ice is unmistakably superimposed ice. The crystal texture alone is sufficient to support this interpretation, based on the strong similarity between the texture illustrated here and what others have observed on Antarctic sea ice previously (Reference Jeffries, Shaw, Morris, Veazey and KrouseJeffries and others, 1994; Reference Kawamura, Ohshima, Takizawa and UshioKawamura and others, 1997; Reference Eicken and JeffriesEicken, 1998; Reference Haas, Thomas and BareissHaas and others, 2001). The negligible salinity of the first-year PG ice, the similarity between first-year PG ice and snow δ18O values, and the contrast between those and the δ18O values of the underlying sea ice are additional strong evidence for its origin.
Reference KoernerKoerner (1970) defines superimposed ice as ‘ice which is formed by the refreezing of melt water from the snow pack onto the glacier surface . . . Superimposed ice does not include ice formed from refreezing of melt water within the firn or snow pack.’ Here we are looking at sea ice rather than a glacier, but the PG ice at the top of the first-year cores nevertheless meets Koerner’s criteria. That is, the meltwater refroze directly onto the floe surface (Fig. 6a). On the other hand, the consolidated ice layers and blocks ‘perched’ on slush do not meet the criteria. We must ask where they originated, and why the PG layers in the multi-year cores were ‘buried’ and have higher salinity and δ18O values than the first-year PG ice.
Fig. 6. Conceptual models of superimposed-ice formation in cores described in this paper: (a) on an ice surface that does not subsequently flood; (b) as a block ‘perched’ on top of slush that freezes in the subsequent autumn; and (c) on an ice surface that subsequently floods, the slush freezes, and the superimposed ice becomes ‘buried’ below the new ice surface.
The slush layer in the Ross Sea was primarily due to percolation of sea water upward through the warm (almost 0˚C), permeable ice that was often depressed below sea level due to the mass of snow (Fig. 6bi) (Jeffries, unpublished data). The presence of the consolidated ice layers and blocks, and the size and shape of the blocks, perched on the slush was unexpected. Reference Haas, Thomas and BareissHaas and others (2001) have since reported similar ice layers, but not blocks, in the Weddell Sea and described the process classification of the summer surface process. It is suggested that the ice layers form initially when less dense, fresh meltwater percolating through the snow refreezes at the surface of the cold, denser slush (Fig. 6bii), and they thicken further by the refreezing of meltwater being added from above (Reference Haas, Thomas and BareissHaas and others, 2001).
The discontinuous occurrence of the perched ice blocks and other ice layers in the snow cover might seem unusual, but can be attributed to the probability that meltwater percolation and refreezing are not continuous in time and space. Patchy melting and refreezing events, and variable rates, probably account for the thickness/roughness variations and horizontally discontinuous occurrence of the perched ice layers and blocks. Also, rather than refreeze at the surface of the slush, meltwater might mix with the slush, and perched ice layers/blocks will not form. We have chosen to call them perched layers and blocks, but they are, in fact, simply superimposed on the slush layer. The slush that lies between a perched ice layer/block and the underlying floe surface is a ‘gap’ that provides a habitat for productive surface and freeboard communities of micro-organisms (Reference Fritsen, Coale, Neenan, Gibson and GarrisonFritsen and others, 2001; Reference Haas, Thomas and BareissHaas and others, 2001).
If a perched ice layer/block survives the summer, we propose that it can become an integral part of the floe in the autumn as air and snow temperatures decrease, and the slush layer freezes to form snow ice in the gap between the bottom of the ice layer/block and the top of the original floe surface (Fig. 6biii). Whether the PG ice layer at the top of a floe forms in this way, or in the more traditional mode of superimposed-ice formation directly on the ice surface (Fig. 6a), the PG ice will be ‘buried’ below snow ice at the surface of the floe if there is subsequent flooding and slush formation, followed by freezing (Fig. 6ciii). Hence the occurrence of ‘buried’ PG ice in the multi-year cores. Similar ‘buried’ PG layers have been reported in this region by Reference Jeffries, Shaw, Morris, Veazey and KrouseJeffries and others (1994, Fig. 4 and 10c). The dual layering with contrasting crystal sizes in the ‘buried’ PG ice in core 017-01 (Fig. 5b) probably represents two episodes of melting and refreezing, and differences in freezing rates during each episode. The water that formed the lower, finer-grained layer probably froze more quickly than the water that formed the upper, coarser layer.
All ice cores were obtained under similar conditions and it seems unlikely that the relatively high salinity and δ18O values of multi-year PG ice compared to first-year PG ice would be due to contamination while coring in a salty sampling environment. We do not discount the possibility that such contamination occurred, but the salinity and δ18O values of multi-year PG ice might be primarily the result of a natural process. Reference Haas, Thomas and BareissHaas and others (2001) have described salt-water droplets melting their way into PG ice from the submerged, flooded ice surface. We propose that this process leads to the formation of the vertically oriented tubular features observed in the PG layers of cores 017-01 (Fig. 5a) and 008-02. They are, in effect, brine drainage tubes that are transferring brine into the PG layers from above. The mixing of this brine and the PG ice in a melted sample could account for the relatively high observed salinity and δ18O values.
The thickness of the PG ice layers indicates that there can be considerable melting in the snow and summer ice accumulation at the top of first-year floes. Assuming an initial PG ice density of 897 kg m–3 (as observed in first-year core 005-01), the 0.11–0.29m thick superimposed-ice layers represent a water equivalent transfer of 0.098– 0.26 m of snow to the ice surface. Or, assuming an initial dry, cold snow density of 320 kg m–3 (Reference Morris and JeffriesMorris and Jeffries, 2001), the superimposed-ice layers correspond to a snow thickness of 0.34–0.90 m. Just as flooding and snow-ice formation significantly deplete the snow cover and add to the ice cover in the cold season (Reference Jeffries, Krouse, Hurst-Cushing and MaksymJeffries and others, 2001), so too do snowmelting and superimposed-ice formation in the warm season. Overall, there is no loss of mass at the floe surface (Reference Haas, Thomas and BareissHaas and others, 2001).
Although the PG ice layers were quite thick and comprised 8–30% of the length of the cores in which they were found, superimposed ice made only a small contribution to pack-ice development as a whole, as indicated by its proportion of the total length of ice core examined (Table 3). Much of the superimposed ice occurred in first-year cores at the beginning of the cruise, and perhaps it was only in this region that the conditions necessary for superimposed-ice formation were met while we were in the pack ice in January 1999. The conditions necessary for superimposed-ice formation obviously had been met in previous summers elsewhere in the pack ice, as evidenced by the multi-year PG ice.
Table 3 Proportion of ice types in cores as a function of the total length of core examined
Rather than be concerned with the small proportion of superimposed ice in the cores, we conclude this section by proposing that it is more important to focus on the fact that superimposed ice was forming at all. On a glacier, the lower boundary of the superimposed-ice zone is the equilibrium line, and below that is the ablation zone where there is a net loss of ice over the course of a year (Reference PatersonPaterson, 1994, p. 11). By analogy, the occurrence of superimposed ice on sea-ice floes indicates a snow cover at an advanced stage of melting not far removed from complete disappearance. This would lead to melt-pond formation and, presumably, accelerated sea-ice decay, as occurs in the Arctic. The observation of superimposed ice in the Ross Sea and elsewhere (Reference Jeffries, Shaw, Morris, Veazey and KrouseJeffries and others, 1994, 1997; Reference Kawamura, Ohshima, Takizawa and UshioKawamura and others, 1997; Reference Eicken and JeffriesEicken, 1998; Reference Haas, Thomas and BareissHaas and others, 2001) suggests that the summer snow and ice cover exist in a more delicate balance with the weather and climate than has previously been recognized. What remains to be determined is what conditions are required to tip the balance towards complete snowmelt and the formation of melt ponds, which have been observed occasionally on Antarctic floes (Reference Haas, Viehoff and EickenHaas and others, 1992; Reference LowLow, 1995). This is a vital issue in view of the regional physical and biological importance, and global significance of Antarctic sea ice.
Conclusion
The crystal texture, 18O/16O ratios, density and salinity of ice cores and of ice blocks ‘perched’ on slush at the surface of ice floes in summer in the central and eastern Ross Sea have been described. The distinctive polygonal granular (PG) texture and isotopic signature of the perched blocks, ice layers at the top of first-year floes, and ice layers ‘buried’ below the surface of multi-year floes are characteristic of superimposed ice. It is the result of melting in the snow cover and freezing of the water at the slush surface or directly on top of floes. Flooding after superimposed-ice accretion and subsequent snow-ice formation buries PG ice below the surface. Superimposed ice represents a diminution of the snow cover by mass transfer to the ice, but no net loss of mass at the surface of floes. Superimposed ice also indicates that the snow had reached an advanced stage of melting only one step removed from total disappearance and the formation of melt ponds. Thus, while PG ice was a relatively small proportion of the total ice mass (as represented by the total length of ice cores examined), the fact that it occurred at all is significant in view of the implications with regard to sea ice and its sensitivity to weather and climate variability and change.
Acknowledgements
This work was supported by a Grant-in-Aid for Scientific Research (13490002) from the Japanese Ministry of Education, Culture, Sports, Science and Technology to T.K., and US National Science Foundation grant OPP 9614844 to M.O.J. J.-L.T. is a Research Associate at the Fonds National de la Recherche Scientifique (FNRS), Belgium, and acknowledges the support of the Belgian Antarctic Program (SSTC, Science Policy Office) for his participation in this project. H.R.K. thanks the Canadian Natural Science and Engineering Research Council for its support of the Stable Isotope Laboratory, University of Calgary. We thank M. Gowing, C. Venn, S. Nihashi and T. Tin for their assistance with ice coring and analysis. We are grateful to the captain and crew of the Nathaniel B. Palmer, and Antarctic Support Associates personnel for their support.