

Politicians have on average much higher levels of education than citizens (Bovens and Wille Reference Bovens and Wille2017; Gaxie and Godmer Reference Gaxie, Godmer, Cotta and Best2007; Gerring et al. Reference Gerring, Oncel, Morrison and Pemstein2019). This empirical regularity is consistent across countries and over time, but is the overrepresentation of highly educated citizens in office justified? A long tradition sees highly educated politicians as more desirable on the basis that education is a sign of competence or “quality” (Dal Bó and Finan Reference Dal Bo and Finan2018): highly educated individuals are considered as better able to understand politics, as better managers, as having more authority on others, and as being more committed to the well-being of their communities than the less educated. In empirical research, numerous studies use the education of politicians as a proxy of their unobserved “quality” (e.g., Artiles, Kleine-Rueschkamp, and Leon-Ciliotta Reference Artiles, Kleine-Rueschkamp and León-Ciliotta2021; Baltrunaite et al. Reference Baltrunaite, Bello, Casarico and Profeta2014; Becher and Menendez Reference Becher and Menendez2019; Gagliarducci and Nannicini Reference Gagliarducci and Nannicini2013; Galasso and Nannicini Reference Galasso and Nannicini2011). This argument would provide a normative defense for the overrepresentation of some types of citizens in politics. In turn, this overrepresentation of some points of view is at the core of some elite-centered explanations of unequal representation, as discussed in the introduction of this volume (see also Bartels in this volume).
However, existing evidence about the actual consequences of having highly educated politicians on policy outcomes is scarce and conflicting. Some studies have argued that educated political leaders produce positive outcomes such as better economic performance (Besley, Montalvo and Reynal-Querol Reference Besley, Montalvo and Reynal-Querol2011; Congleton and Zhang Reference Congleton and Zhang2013) or an increase in the provision of public goods (Martinez-Bravo Reference Martinez-Bravo2017). But other studies find that the education of politicians is irrelevant for policy outcomes (Carnes and Lupu Reference Carnes and Lupu2016b; Freier and Thomasius Reference Freier and Thomasius2015) or find mixed evidence (Lahoti and Sahoo Reference Lahoti and Sahoo2020).
This chapter studies if the education level of politicians in government affects fiscal policies and performance using detailed local government data. While previous empirical research either views education as a sign of the quality of politicians or finds that highly and less-educated politicians implement similar policies, our research introduces a third possibility, which is that governments led by more-educated politicians implement more conservative fiscal policies. This idea is complementary to other elite-centered explanations in this volume, including the chapter by Mathisen et al. on the importance of parties; the chapter by Hacker, Pierson, and Zacher on the importance of communication; and Becher and Stegmueller on the role of interest groups to help understand why politicians fail to represent the views of citizens.
To study how the education of politicians affects government performance, we present detailed analyses based on data from Spanish municipalities between 2003 and 2011. We construct an original dataset with information about the gender, age, and education of all mayoral candidates in local elections and match it to local policy outcomes, including fine-grained information about budget items, tax rates, and spending in several policy areas. To address endogeneity concerns, we follow previous research that applies regression discontinuity designs to study the effects of partisanship and the characteristics of politicians on various outcomes (e.g., Ferreira and Gyourko Reference Ferreira and Gyourko2009; Gerber and Hopkins Reference Gerber and Hopkins2011). Our identification strategy, which is tailored to the PR system employed in Spanish municipal elections, exploits close races between mayoral candidates with and without a university degree to examine if performance and fiscal policy differed in municipalities where a candidate with a university degree just won or just lost an election.
The RD estimates suggest that when highly educated politicians closely win an election, municipalities do not have better outcomes in respect to unemployment, population growth, primary deficit, or a close match between projected and realized spending, nor are these governments more likely to be reelected. Our analysis of budget items and spending categories provides evidence that, on average, less-educated mayors choose higher levels of capital spending and increase spending in basic infrastructure projects. In ancillary analyses, we also find that the positive effect of electing left-wing governments on capital spending is reduced when the mayors of left-wing parties have a university degree. Overall, our results suggest that educated and noneducated politicians differ on preferences rather than on ability.
This chapter complements recent work on how the social class background of politicians affects government outcomes (Carnes Reference Carnes2013; Carnes and Lupu Reference Carnes and Lupu2015; Pontusson 2015; O’Grady Reference O’Grady2019). Our study joins others that claim that a lack of descriptive representation by socioeconomic status is normatively problematic, as argued by Bartels in this volume. The large overrepresentation of highly educated citizens in office does not produce obvious benefits in terms of better government performance, and our findings suggest that it can introduce a conservative bias in public policy.
Theory
Our work is motivated by studies which demonstrate that public policies are not determined by the median voter and political institutions alone, but also by the identity of political leaders (Bhalotra and Clots-Figueras Reference Bhalotra and Clots-Figueras2014; Chattopadhay and Duflo Reference Chattopadhay and Duflo2004; Jones and Olken Reference Jones and Olken2005; Pande Reference Pande2003). This claim has wide-ranging implications. Above all, when the composition of governments and legislatures differs from the composition of the population, policies will deviate from the counter-factual situation in which politicians resemble the population. Policy bias will, in all likelihood, favor the overrepresented groups. The most important respect in which politicians stand out in advanced industrial democracies is their privileged socioeconomic background, as discussed in the chapter by Carnes and Lupu in this volume. Whereas the underrepresentation of women and minorities has improved markedly over time, it has only worsened for workers, the less educated, and low-income citizens (Bovens and Wille Reference Bovens and Wille2017; Carnes Reference Carnes2013; Gaxie and Godmer Reference Gaxie, Godmer, Cotta and Best2007; O’Grady Reference O’Grady2019).
Different dimensions of socioeconomic advantage such as income, occupation, and education are highly correlated, but education has differential features that justify a separate assessment.Footnote 1 Highly educated governments have been defended based on the purported higher ability of their members. However, education is not only the result of higher ability and a vehicle of social mobility, but also a mechanism for the reproduction of inequality (Lee and Seshadri Reference Lee and Seshadri2019). Having parents of a higher socioeconomic and educational background predicts educational attainment and ultimately income, beyond differences in ability.Footnote 2 Education can affect the preferences of citizens through a variety of channels, some of which are separate from income or occupation (as we discuss in detail later). The distinctive features of education justify the need for a careful analysis of both valence and positional outcomes that could reveal trade-offs.
Previous Studies: Better Performance or No Effects?
A first strand of studies finds that highly educated politicians are more competent. Besley, Montalvo, and Reynal-Querol (Reference Besley, Montalvo and Reynal-Querol2011) exploit the death of leaders due to natural causes to identify the effects of their education on economic growth and find that the departure of highly educated leaders from office reduces economic growth. Martinez-Bravo (Reference Martinez-Bravo2017) exploits a large education program in Indonesia and finds that highly educated village heads govern more efficiently and deliver more public goods than less-educated village heads. Lahoti and Sahoo (Reference Lahoti and Sahoo2020) find that educated politicians produce better educational outcomes in developed states in India, but not in less-developed states.
There are several reasons why highly educated politicians may perform better. Educated people score higher on cognitive and noncognitive traits which predict job performance, including crystallized and fluid intelligence and personality traits such as openness to experience, conscientiousness, and emotional stability (Heckman and Kautz Reference Heckman and Kautz2012). Skills acquired through formal training or job experience, such as accounting skills, team management, or legal knowledge, can be transferred to government tasks. The correlation of education and desirable abilities and traits may be due to a mixture of self-selection of people with these traits to pursue postsecondary education and to formal education enhancing abilities such as mathematical, verbal skills, or grit. Whatever the direction of causality, if this positive correlation holds among politicians, we should expect highly educated politicians to deliver better outcomes than less-educated politicians on indicators of economic performance.
The dominant view that highly educated politicians perform better than less-educated politicians has been challenged empirically by Carnes and Lupu (Reference Carnes and Lupu2016b) who reanalize Besley, Montalvo and Reynal-Querol’s (Reference Besley, Montalvo and Reynal-Querol2011) data using a broader set of outcome measures and fail to find a positive effect on performance. They confirm these null results using further evidence from close elections in US congressional elections and mayoral elections in Brazil. Similarly, Freier and Thomasius (Reference Freier and Thomasius2015) do not find an effect of education on local spending and debt in German municipalities.
Two reasons stand out that may explain these null effects. Politicians may simply not be able to influence policy outcomes much, perhaps because other factors are more important or because governments have little power. The lack of effect of education on performance may also be due to self-selection. As in the case of female politicians (Anzia and Berry Reference Anzia and Berry2011), less-educated citizens may be less likely to run and to obtain support, holding quality equal. As a consequence, only the most exceptional less-educated citizens will run in elections and win office. Adverse selection may operate among highly educated citizens. If the salaries of politicians are lower than the salaries of highly educated workers in the private sector, perhaps only those with a low ability among the highly educated choose to run. As a result of both processes, even if there is a positive correlation between education and ability in the population, this correlation could be weakened among politicians. The prediction of this argument is that the education of politicians should not affect governmental performance.
Education and Economic Preferences
A third possibility is that educated politicians have different preferences and implement more fiscally conservative policies than less-educated politicians. This view links the strands of literature that link the preferences of citizens about redistribution (see Cavaille, Ares and Häusermann in this volume) to unequal representation in elite-centered explanations, also discussed in this volume. Perhaps individuals with different characteristics have different preferences. If some are more likely to be representatives than others, this introduces a bias in the political process that helps explain unequal representation.
The more general theoretical argument, in line with citizen-candidate models of representation (Besley Reference Besley2006), is that the individual characteristics of politicians are informative about their preferences and shape their actions in office. The main testable hypothesis is that the identity of politicians predicts public policies, a general claim that has been applied to multiple individual characteristics (Burden Reference Burden2007).
Education can shape preferences through multiple channels, some common to other socioeconomic characteristics and others specific to education. The first is the income channel: Educated people have higher incomes and income potential and hence different material interests. As an illustration of this well-known correlation for the Spanish case, according to the yearly Survey on Life Conditions conducted by the National Statistics Institute, citizens with university degrees had incomes more than twice as high, on average, as citizens with lower secondary education. Given the progressive structure of the tax system, this means that more-educated citizens pay relatively more taxes than less-educated citizens. Higher incomes also give educated citizens better access to privately provided healthcare, education, and other services. Because they pay more in and get less out, they should have a preference for a smaller size of the state.
A slightly different material interest channel relates to the risk of unemployment. Less educated citizens face much higher economic risks (Hacker, Rehm and Schlesinger Reference Hacker, Rehm and Schlesinger2013) and hence are more reliant on social protection. In Spain in 2007, people aged between 25 and 64 who had primary education were twice as likely to be unemployed than people with university education. The unemployment rate was 9.9 and 4.8 respectively. In 2010, the gap was even larger at 28 and 10.5. As a consequence of both their different incomes and risk levels, citizens – and politicians – with low levels of education should prefer a larger and more generous state.
There are several nonmaterial channels through which education can produce more fiscally conservative preferences, some of which are particularly relevant in the case of politicians. First, education strongly affects the composition of people’s networks. Educated politicians will have fewer acquaintances in their networks in situations of unemployment and economic hardship, which should limit the salience of these issues. Vicarious exposure to economic hardship also affects perceptions about the deservingness of those affected and hence views on economic issues (Newman, Reference Newman2013). A second reason why the educational composition of the networks of policymakers is important is that less-educated politicians should be more likely than highly educated politicians to be approached and lobbied by less-educated citizens (because networks facilitate access). Note that this “access channel” does not operate through the preferences of politicians.
Independently of income, risk, and networks, educated politicians may have more conservative economic views because of their different socialization experiences in educational environments during their formative years. Independently of their background, educated politicians have been socialized in secondary and university environments, in which peers of privileged backgrounds abound. Experiences lived in privileged educational environments lead to the development of more conservative worldviews (Mendelberg, McCabe, and Thal 2016). In addition, educated citizens (either because of self-serving biases or because of exposure to the rigors and delayed gratification of schooling) may be more likely to endorse “just-world” beliefs and view inequalities as a result of meritocracy.
Empirically, education has been repeatedly found to predict preferences for economic and welfare policies among citizens. For instance, education is associated with less support for redistribution (Rehm Reference Rehm2009) and social policies (Häusermann, Kurer, and Schwander Reference Häusermann, Kurer and Schwander2016), more support for economic globalization (Naoi Reference Naoi2020), and opposition to protectionism (Hainmueller and Hiscox Reference Hainmueller and Hiscox2006).Footnote 3 Also in Spain, education is associated with right-wing economic policies (Calzada and Del Pino Reference Calzada and Del Pino2008).
We expect governments led by educated politicians to reduce the size of the state and use less interventionist and expansionary policies. The most relevant evidence supporting this expectation is provided by Carnes and Lupu (Reference Carnes and Lupu2015) who find that politicians with a working class background (which correlates very strongly with education) sponsor more “leftist” bills and have more leftist ideal points. These authors look at legislative activity and do not examine if the class of legislators ultimately affects policy outcomes. There is some indirect evidence that the educational background of decision-makers may affect the fiscal conservatism of the policies they adopt and the economic results they obtain. For instance, the education and professional background of central bankers affect monetary policies (Adolph Reference Adolph2013; Gohlmann and Vaubel Reference Gohlmann and Vaubel2007), as well as the resulting inflation and unemployment rates. These studies focus mostly on the type of university education achieved and do not examine elected politicians but high-level economic decision-makers. Dreher et al. (Reference Dreher, Lamla, Lein and Somogyi2009) examine the effect of the educational level and background of the heads of government on the adoption of market-liberalizing reforms and find that, in some specifications, educated heads of government are more likely to initiate such reforms. Our main hypothesis is thus that governments led by educated politicians implement more conservative fiscal policies.
Testing this hypothesis poses an important identification challenge because of the correlation between the education of the population, of politicians, and of municipal- and party-level characteristics. Our research attempts to disentangle the effect of educated governments using a quasi-experimental regression discontinuity design focusing on municipal elections in Spain.
Institutional Background and Data
To examine the impact of education on government performance and fiscal policies, it is crucial to understand the constraints faced by politicians in a particular context. As our empirical analyses are focused on Spanish local governments, in this section we describe their main features with emphasis on how the members of the city council are elected, the structure of local public finances, and the capacity of local politicians to influence fiscal policy. We also discuss the data used to test the hypotheses and the construction of our main variables.
Spanish Local Elections
Spain has a decentralized political system with elected governments at the national, regional, and municipal level. Since 1979, citizens elect local councils every four years in about 8,000 municipalities, but our analysis only includes municipalities with more than 1,000 inhabitants.Footnote 4 Depending on their size, municipalities elect nine councilors or more using a closed party list proportional representation system (PR). In the first meeting, the local council elects a mayor, which is usually the first candidate of the party list with the most votes. The city council is the main decision-making body during the legislature and is responsible for approving the budget, tax codes, laws, regulations, and zoning.
Spanish local governments have considerable influence on the well-being of citizens. By law, municipalities are required to provide a number of services such as waste collection, street cleaning, public lightning, sewerage, and roads pavement. In addition, larger municipalities must provide other services depending on their size. They can also provide additional goods and services on a voluntary basis. Municipalities manage about 14 percent of total public expenditure. This figure is similar to countries like Belgium, Austria, Portugal, or Germany. They are, however, an important employer at 647,000 employees in 2015 according to the Ministry of Territorial Policy and Administration. Section S1.1 in the supporting information complements this description with further details about Spanish electoral law.
Local Public Finances
The revenues of local governments come from own resources and transfers from other levels of government. Municipalities can levy a number of taxes and fees, and receive fixed shares of the revenues of indirect taxes and the income tax. In 2009, taxes and fees amounted to 43 percent of total revenues. Current transfers amounted to 27 percent of revenues, with the main grant being the revenue-sharing grant transferred by the central government using a fixed formula based on population size and other parameters. Most other grants, including European grants, are earmarked for specific purposes. Regarding expenditures, the bulk of local expenditure (84 percent) was approximately equally distributed between three categories: personnel (29.4 percent), current goods and services (28.3 percent), and real investment (26.9 percent). The empirical analyses focus mostly on the largest categories.
As in other countries, the discretion that local governments have over expenditures is greater than their capacity to raise revenues. Municipalities have a limited capacity to issue debt and can mostly influence revenues by raising or reducing local taxes and by attracting grants.Footnote 5
Data: Politicians, Performance, and Fiscal Policy
Our analyses draw on an original dataset with individual-level information about the characteristics of local councilors elected in Spain in 2003 and 2007. Municipalities collect the data and send it to the Spanish Ministry of Finance (Ministerio de Hacienda y Administraciones Publicas), which granted the authors access. The dataset details the education, gender, age, and occupation of local council members.Footnote 6 Our dataset contains information on around 1,200 municipalities with more than 1,000 inhabitants for two terms of office (2003–2007 and 2007–2010). This coincides with a broadly expansionary economic cycle during the Spanish housing boom which lasted approximately until 2008, which was then followed by a deep economic crisis.
In our dataset, as expected, highly educated citizens are overrepresented among politicians. On average, the education of local councilors in our sample is thirteen years with a standard deviation of 2.42. The level of education of mayors is slightly higher at fourteen years. This is significantly higher than the education of the Spanish adult population, which according to the census is less than ten years on average.Footnote 7
We complement the dataset about the individual characteristics of local politicians with extensive municipal-level information on electoral results, performance outcomes, and fiscal data. The share of votes for the different parties is obtained from the Spanish Ministry of Home Affairs (Ministerio del Interior), which also provides data about population size, the number of registered voters, and the party of the mayor. We collect a variety of performance indicators to test whether educated mayors perform better,Footnote 8 suggesting that they have higher “quality.”
We view unemployment as an important indicator of economic performance. Although unemployment is not directly affected by municipalities, they can create jobs through public hiring or stimulating the local economy. Another performance indicator is population growth, which may be a proxy for the attractiveness of the municipality. We use deficit per capita as an additional measure of performance, although we acknowledge that this is debatable given that municipalities could use deficit to counteract economic cycles. Our next indicator of quality is the share of the vote for the incumbent party at the next election. Finally, we calculate the deviation between the budget approved for a given year (forecasted) and the actual amount spent in that year. This measures the ability of governments to administer their budgets as they intend to.
For our analyses about the effect of education on fiscal policies, we gather data from the annual budgets (liquidaciones) provided by Spanish municipalities and collected by the Ministry of Finance (Ministerio de Hacienda y Administraciones Publicas). We focus on the most important categories, these are total nonfinancial revenues and expenditures per capita and their main categories: capital transfers, current transfers, taxes and fees, capital spending, and spending on current goods and personnel.
Each observation in our dataset represents one municipality during a mayoral term. Compared to the original sample, our final sample is reduced significantly for several reasons. First, we exclude all municipalities with less than 1,000 inhabitants because, as mentioned, many variables are not available for these municipalities. We also exclude places where the mayor is not among winner and runner-up (2 percent) and where both the winner and runner-up have a university degree.
Empirical Strategy
As educated politicians are not randomly assigned to municipalities, many time-invariant and time-varying unobservable factors can be correlated with both the education of mayors and economic outcomes. For example, changes in voter preferences or in the composition of the population may influence both demand for different fiscal policies and for more-educated politicians. Thus, empirical approaches such as fixed-effects models are unable to establish causal links. To overcome concerns about endogeneity, we employ a Regression Discontinuity (RD) design to estimate the effect of the education of mayors on government performance and fiscal policies in Spanish municipalities. The intuition of the RD design is that municipalities where the party with the most educated candidate wins are very similar to municipalities where the most educated candidate lost (i.e., the latter are a good control group for the former). At the limit, the outcomes of these elections can be treated as random, which allows obtaining quasi-experimental estimates of the effects of interest.
We focus on municipalities in which the two parties with the highest and second highest number of seats (usually the main government and opposition parties) vary in the university attainment of their leading candidates. That is, we include only municipalities where one of the two main candidates had a university degree, while the other did not have it. To construct our forcing variable, we calculate the vote margin (vit) of the party with a university-educated candidate as the percentage of votes this party needs to win (lose) to become the winner (the runner-up) in terms of seats.
The RD approach has been mostly applied to majoritarian electoral systems such as the United States. By contrast, Spain has a PR system in which the party that wins an election may not be in government if it has less than 50 percent of seats and other parties can form a coalition with a majority of seats. In about 94 percent of municipalities in our sample, the mayor belongs to the winning party. We follow Curto-Grau, Sole-Olle, and Sorribas-Navarro (Reference Curto-Grau, Sole-Olle and Sorribas-Navarro2018) and Folke (Reference Folke2014) and implement a fuzzy set regression discontinuity design adapted to PR systems.
More formally, we estimate the following equations:
 (1)
(1) (2)
(2)where uit equals 1 if the mayor in municipality i at time t has a university degree. The variable yit refers to the outcomes of interest in fiscal year t. Our forcing variable – the margin of victory of the candidate with a university degree – is represented by vit and we construct a dummy variable dit that equals 1 if this margin is positive and 0 if it is negative. The margin of victory is based on the outcomes of the most recent election.Footnote 9 The function f (vit) is a function of the forcing variable fitted on each side of the threshold.
We report estimates using local linear regressions and a data-driven optimal bandwidth as per Calonico, Cattaneo, and Titiunik (Reference Calonico, Cattaneo and Titiunik2014a, Reference Calonico, Cattaneo and Titiunik2014b). All specifications report cluster standard errors at the municipality level and include time and region fixed effects as Spain presents significant regional heterogeneity in political and economic characteristics. The coefficient of interest, α1, is the Local Average Treatment Effect (LATE), which is a robust estimate of the causal effect for observations near the threshold.
Validation of the RD Strategy
The validity of the RD estimates relies on the assumption that the forcing variable, in this case the margin of victory of the party with a university-educated candidate, is not manipulated by political parties. When the margin of victory is very narrow, winning or losing the election should be a random event not influenced by electoral fraud. To check this assumption, we use the manipulation test proposed by Calonico, Cattaneo and Titiunik (Reference Calonico, Cattaneo and Titiunik2015). Figure 7.1 shows that, at the threshold, the density of the forcing variable is not discontinuous. This means that when candidates of different education levels compete in a close election, neither the more-educated nor the less-educated candidate has a significantly higher likelihood of winning.
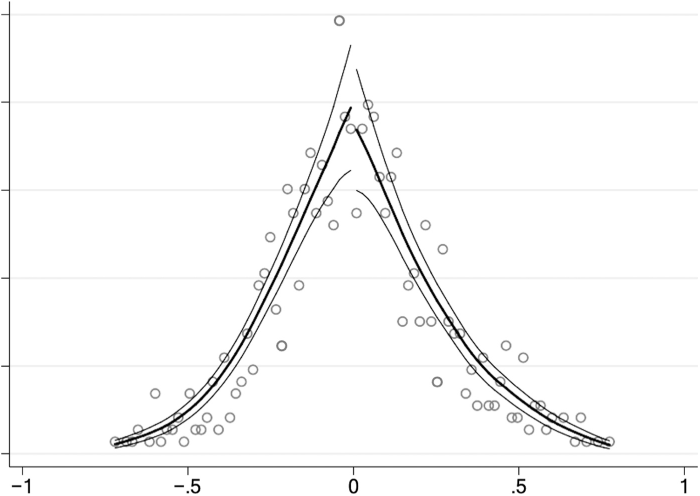
Figure 7.1 Continuity of the forcing variable
Note: Density plot of the forcing variable computed with rddensity Stata program.
In Table 7.1, we test for the presence of discontinuities for key political and socioeconomic variables. We find discontinuities in the mayors’ gender. This reflects the fact that female candidates tend to be better educated than male candidates. To address concerns that differences in the gender of mayors might affect our results, we control for this variable on both sides of the threshold in the main analyses. We also find a discontinuity in the percentage of retired citizens living in the municipality and control for this in the analyses.
Table 7.1 Discontinuities in political and socioeconomic covariates
| Coef. | SE | |
|---|---|---|
| Female mayor | 0.273* | (0.111) |
| Mayor’s age | 4.624 | (2.695) |
| Party alignment with regional government | 0.176 | (0.152) |
| Party alignment with central government | 0.208 | (0.157) |
| Party alignment with provincial government | 0.085 | (0.153) |
| Left-wing mayor | 0.182 | (0.152) |
| Majority government | 0.082 | (0.159) |
| Mayor is manager | −0.152 | (0.122) |
| Turnout | −0.020 | (0.031) |
| Initial debt per capita | −24.99 | (15.66) |
| Population | 7.338 | (4.963) |
| Density | 731.0 | (474.7) |
| % Population <14 | 1.068 | (0.995) |
| % Population >65 | −4.716* | (2.107) |
| Income | −0.063 | (0.0474) |
| Weight of tertiary sector | 4.074 | (4.355) |
| % Foreigners (EU) | 0.0773 | (0.658) |
| % Foreigners (non-EU) | −0.955 | (0.118) |
| % College education | −1.150 | (2.631) |
Note: *p < 0.1.
In addition, the descriptive analyses provide information about the education of the politicians involved in the mayoral races. Almost 46 percent of mayors have a university education and the figure is very similar for politicians who ended up in the second position.
Additional analyses show that in 49 percent of municipalities, the percentage of local government politicians educated in university is higher than the percentage of local opposition politicians educated in university. This finding suggests that mayoral races are on average balanced in terms of the education of politicians who win or lose the election (i.e., it is not the case that more-educated politicians managed to win close races at a higher than expected rate). This finding is confirmed when we look at an alternative indicator, the average years of education of government (thirteen years) and opposition members (13.2 years). Although the average is close to zero, Figure 7.2 shows that there is sizeable variability in the education levels of government and opposition members in individual races. On average, government members have 0.17 fewer years of education on average than opposition members (the mean difference is negative), but the standard deviation is 2.9 years, suggesting significant variation across municipalities.
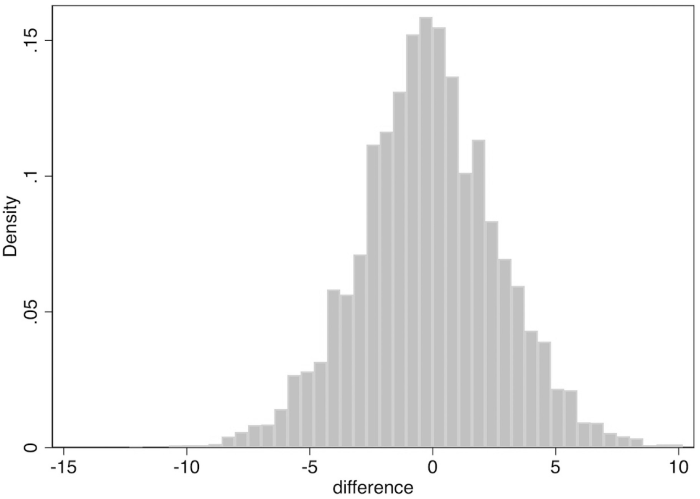
Figure 7.2 Distribution of difference in average years of education of government and opposition members
Results
In the empirical analyses, we first examine if educated politicians perform better in office using a variety of indicators. After showing that this is not the case, we present the main empirical analyses which test the hypothesis that the educated governments choose more conservative policies with extensive data on local finances.
Education and Government Performance
This section provides evidence about the causal effect of education on several performance indicators. To start, in column 1 of Table 7.2, we regress unemployment rates on the level of education of the government and find that electing mayors with a university degree leads to an increase of 0.36 percentage points in local unemployment rates, a 4 percent increase in unemployment. As discussed earlier, given the characteristics of the Spanish economy, we regard unemployment as a particularly important indicator of performance. Educated politicians perform worse in this respect.
Table 7.2 Effect of mayors with university degrees on performance outcomes
| Unemployment rate | Population growth | Incumbent vote at t+1 | Deviation from exp. budget | Primary deficit pc | |
|---|---|---|---|---|---|
| Education | 0.357 | −0.215 | −0.646 | −1.148 | 2.163 |
| (0.194)* | (0.634) | (1.003) | (1.296) | (5.526) | |
| Bandwidth | 0.185 | 0.190 | 0.158 | 0.168 | 0.173 |
| Mean outcome | 8.29 | 4.99 | −1.40 | 1.38 | −5.47 |
Notes: Standard errors clustered at the municipality level in parentheses, *p < 0.1, **p < 0.05, ***p < 0.01. All RD estimates are obtained by local linear regression and optimal bandwidth as per Calonico, Cattaneo, and Titiunik (Reference Calonico, Cattaneo and Titiunik2014a). All specifications include time and region fixed effects. Unemployment growth = percentage change in unemployed people (as a share of working-age population) between the first and last year of the legislature. Primary deficit and total expenditures (columns 3 and 4) are expressed in euros per capita. Deviation from exp. budget = percentage difference between the actual expenditure budget and its initial forecast approved by the local government.
We also test whether the government’s education affects population growth, which can signal quality if people are attracted to municipalities with a better provision of public goods and services. In column 2 of Table 7.2, we present the estimates of regressing municipal population growth from the start to the end of four-year electoral terms (hence the smaller number of observations) on the average education level of the government and find no statistically significant effect. Balanced budgets can also be regarded as indicators of good government performance, although deficit and surplus can also be a counter-cyclical fiscal policy used by governments. In column 3, we show the results of regressing the level of primary deficit per capita on the level of education. There is no evidence that more educated governments run smaller deficits.
Another indicator of government performance is the vote share of the incumbent in the next election. Voters should reward good governments such that the vote share of a well-performing incumbent party should be higher than the average incumbent. We test this hypothesis in column 4 and find that more-educated politicians do not perform better. Lastly, we examine whether more-educated governments are better at forecasting the spending needs of the municipality and able to stick to their own proposed budget. We construct a variable that measures the percentage difference between the actual expenditures and their initial forecast approved by the local government at the start of the fiscal year. The estimates in column 5 show that the education of the government has no statistically significant effect on this indicator.
The Effect of Education on Fiscal Policies
This section analyzes if the education of politicians affects the choice of fiscal policies. Table 7.3 presents LATE estimates using key spending and revenue categories of the local budget as dependent variables. We focus on the largest budget chapters, as discussed earlier. Except for current revenues, local governments have considerable discretion to influence these chapters.
Table 7.3 Effect of mayors with university degrees on fiscal outcomes
| Variable | Coef. | SE | Mean outcome |
|---|---|---|---|
| Nonfinancial expenditures | −36.114 | (12.493)*** | 949.98 |
| Personnel spending | −5.57 | (4.94) | 290.48 |
| Goods and services spending | −8.52 | (5.24) | 281.77 |
| Capital spending | −15.71 | (7.18)** | 288.59 |
| Nonfinancial revenues | −32.41 | (11.67)*** | 965.24 |
| Current transfers | −6.23 | (5.18) | 289.69 |
| Capital transfers | −12.60 | (5.41)** | 180.86 |
| Taxes and fees | −8.85 | (8.94) | 410.23 |
Notes: Standard errors clustered at the municipality level in parentheses, *p < 0.1, **p < 0.05, ***p < 0.01. All RD estimates are obtained by local linear regression and optimal bandwidth as per Calonico, Cattaneo, and Titiunik (Reference Calonico, Cattaneo and Titiunik2014a). All specifications include time and region fixed effects. The dependent variables are expressed in euros per capita and the figures represent averages over the four-year term of office.
The results indicate that more-educated mayors reduce expenditures and revenues per capita. Mayors with university degrees decrease total spending per capita by 36 euros (3.8 percent lower expenditures) and total revenues per capita by 32 euros (3.3 percent less funds). The negative effect of mayors’ education on local public spending is driven by lower capital spending, while the effect on current spending (expenditures on both personnel and current goods) is statistically insignificant. We find that electing a university-educated mayor decreases capital expenditures by 35 euros per capita (11 percent lower investment, on average). With regards to revenues, only capital transfers are affected by the education of mayors. University-educated mayors decrease capital transfers by13 euros per capita (7 percent). Given that capital transfers are used to finance public investment, the negative effect we observe can be attributed to lower capital spending. Although we cannot demonstrate that increased investment reduces unemployment, this is a plausible possibility. By contrast, our results suggest that it is unlikely that less-educated mayors reduce unemployment by increased public hiring, a classical clientelistic strategy.
These analyses suggest that better educated governments are more fiscally conservative, in the sense that they prefer smaller governments than less-educated politicians. Lower total revenues and expenditure are driven by the fact that educated governments invest less and receive lower capital transfers. To shed some light on the areas to which this increased investment may be going, the next section examines spending by “functional” area. This is also informative about the revealed policy priorities of politicians.
The Effect of Education on Key Revenue Categories
Besides capital transfers, city councils can influence some other revenue categories, the most important being revenues from fees and direct taxes. In Table 7.4, we present the RD estimates of the effect of the education of governments on those categories. In contrast to capital transfers, we do not find any effect on the other revenue categories at conventional significance levels.
Table 7.4 Effect of mayors with university degrees on key revenue categories and tax rates
| Coef. | SE | Bandw. | N | Mean outcome | |
|---|---|---|---|---|---|
| Revenues from: Fees | 8.587 | (9.373) | 0.13 | 1,016 | 177.57 |
| Direct taxes | −19.258 | (21.388) | 0.17 | 1,262 | 250.63 |
| Tax rates: Urban property tax | 0.006 | (0.008) | 0.13 | 1,169 | 1.38 |
| Rural property tax | 0.009 | (0.011) | 0.16 | 1,208 | 0.65 |
Notes: Standard errors clustered at the municipality level in parentheses. *p < 0.1, **p < 0.05, ***p < 0.01. All RD estimates are obtained by local linear regression and optimal bandwidth as per Calonico, Cattaneo, and Titiunik (Reference Calonico, Cattaneo and Titiunik2014a). All specifications include time and region fixed effects.
To investigate the influence of education on taxation, we narrow the analysis to the taxes on which city councils have most discretion: the urban and rural property tax. The coefficients are positive, but they are insignificant and the magnitudes are very small. Thus, it is unlikely that the education of governments influences tax revenues to a large extent.
The findings about taxes and fees are relevant because they once more disconfirm the claim that less-educated governments have a lower quality. We found earlier that less-educated governments spend more, but these analyses suggest that they are not incurring more deficit nor are they increasing fiscal pressure. Hence, their higher spending is not financed through strategies that could be detrimental in the long term. Rather, it seems that less-educated governments finance higher spending by attracting capital transfers from other administrations.
Effects on Spending Areas
Our dataset provides information about how total spending is distributed across policy areas. These functional data are rare and valuable, but much noisier than the data about types of spending presented earlier. First, many municipalities do not report this data, leading to a higher number of missing values. Second, the classification of budget items to policy areas is often subjective and the internal organization of areas in policy departments varies substantially across municipalities, leading to more measurement error.
In 2009, two out of eight investment items, production of public and social goods and production of economic goods absorbed 87.4 percent of local capital expenditures and 62 percent of total spending. The most important areas in budgetary terms are housing, community welfare (including waste and water management), culture, and basic infrastructure. By contrast, spending on areas such as health and education is low because municipalities only have residual powers on these policy areas.
Table 7.5 presents the findings regarding the effect of the education of mayors on total expenditures (including capital spending and other types of spending) in the two main functional categories and their corresponding subcategories. For each expenditure area and each year, we compute the share of total expenditures allocated to that function. Following previous work (e.g., Gerber and Hopkins Reference Gerber and Hopkins2011), we use this measure because it reflects policy preferences better than per capita spending. The results indicate that electing a mayor with a university degree decreases spending on basic infrastructure, transportation, and agrarian infrastructure. These results are also important. Basic infrastructure and transportation projects may be one of the targets of the increased investment we detected in previous analyses. This again is consistent with our interpretation that less-educated politicians adopt more Keynesian policies.
Table 7.5 Effect of governments’ education on key areas
| Expenditure by function | Coef. | SE | Mean outcome |
|---|---|---|---|
| Production of public and social goods | 1.216 | (0.746) | 47.02 |
| Health | 0.189 | (0.245) | 1.68 |
| Education | 0.209 | (0.178) | 3.87 |
| Housing and urban planning | 0.558 | (0.532) | 14.14 |
| Community welfare | 0.034 | (0.313) | 10.87 |
| Culture | 0.218 | (0.314) | 13.00 |
| Other social and community services | −0.081 | (0.270) | 3.63 |
| Production of economic goods | −1.008 | (0.497)** | 10.96 |
| Basic infrastructure and transportation | −0.890 | (0.481)* | 9.91 |
| Communications | 0.019 | (0.018) | 0.13 |
| Agrarian infrastructure | −0.115 | (0.060)* | 0.63 |
| Research | 0.019 | (0.014) | 0.034 |
| Basic information and statistics | −0.031 | (0.031) | 0.15 |
Notes: Standard errors clustered at the municipality level in parentheses, *p < 0.1, **p < 0.05, ***p < 0.01. All RD estimates are obtained by local linear regression and optimal bandwidth as per Calonico, Cattaneo, and Titiunik (Reference Calonico, Cattaneo and Titiunik2014a). All specifications include time and region fixed effects. The control variables included in all regressions are: % female government members, mayor’s education, average years of education of the opposition members, and a binary variable for left-wing mayors. Revenues from fees and direct taxes are measured in euros per capita.
Robustness Checks
Placebo Tests
We conduct a series of placebo tests in order to increase confidence in the validity of our findings. The most relevant test is to examine the effect of the education of mayors on dependent variables lagged one period.Footnote 10 The estimates presented in Table 7.6 show that the education of mayors elected in certain year does not have any statistically significant effect on fiscal outcomes of the previous term as politicians do not have the capacity to influence such outcomes. This increases our confidence that the results presented in this chapter are not due to chance.
Table 7.6 Effect of mayors with university degrees on lagged fiscal outcomes
| Variable | Coef. | SE |
|---|---|---|
| Total expenditures | −15.50 | (17.22) |
| Personnel spending | 1.63 | (5.70) |
| Goods and services spending | −4.61 | (6.43) |
| Capital spending | −14.09 | (11.25) |
| Total revenues | −19.16 | (17.44) |
| Capital transfers | −1.47 | (8.36) |
| Current transfers | 2.02 | (6.24) |
| Financial revenues | −3.33 | (3.94) |
| Taxes and fees | −13.74 | (12.09) |
Notes: Standard errors clustered at the municipality level in parentheses, *p < 0.1, **p < 0.05*** p < 0.01. All RD estimates are obtained by local linear regression and optimal bandwidth as per Calonico, Cattaneo, and Titiunik (Reference Calonico, Cattaneo and Titiunik2014a). All specifications include time and region fixed effects. The dependent variables are expressed in euros per capita with one period lag (i.e., the education of governments during term t is regressed on fiscal outcomes of the previous term that this government cannot influence).
The results confirm that the education of governments has no statistically significant effect either on the revenues obtained through direct taxation or on financial expenditures.
Who Is Driving These Results?
We examine whether the effects of the education of mayors on economic outcomes and fiscal policy differ for left- and right-wing governments. To estimate heterogeneous local average treatment effects (HLATE), we interact the explanatory variable of interest (university-educated mayor) with a dummy variable that equals one if the mayor is left-wing (Left). Table 7.7 shows these results. The estimates suggest that the role of education in affecting nonfinancial and current expenditures does not differ significantly for left- and right-wing governments, although we note that all interaction coefficients are negative. Columns 3 shows that the preference of left-wing governments for more capital spending is lower when the mayor is more educated. Specifically, electing a mayor with a university degree reduces the large effect of having a left-wing government on spending by 35 euros per capita. The interaction term Education × Left is also significant for nonfinancial and capital expenditures and indicates that the effect of having a left-wing mayor on revenues is decreased by 42 euros per capita when the mayor has a university degree. All in all, the results suggest that highly educated left-wing mayors choose more fiscally conservative fiscal policies.
Table 7.7 Heterogeneous effects of governments’ education: left- and right-wing parties
| Nonfinancial expend. | Current expend. | Capital expend. | Nonfinancial rev. | Capital rev. | |
|---|---|---|---|---|---|
| Education | −49.448 | −6.133 | −14.082 | −23.048 | 14.859 |
| (60.023) | (20.223) | (30.701) | (51.658) | (23.560) | |
| Left | 610.845 | 9.510 | 478.887 | 441.623** | 251.832 |
| (367.438)* | (136.194) | (197.334)** | (316.019)* | (138.052)* | |
| Education × Left | −44.466 (27.785) | −1.204 (10.359) | −35.293 (15.070)** | −41.615 (23.860)* | −17.577 (10.486)* |
Notes: Standard errors clustered at the municipality level in parentheses, *p < 0.1, **p < 0.05, ***p < 0.01. All RD estimates are obtained by local linear regression and optimal bandwidth as per Calonico, Cattaneo, and Titiunik (Reference Calonico, Cattaneo and Titiunik2014a). All specifications include time and region fixed effects.
While these results are suggestive, the reasons why they are driven by left-wing parties are unclear. One possibility is that the pathways to political office are different for individuals in left-wing parties with high or low levels of education. Traditional working-class organizations, such as trade unions or other organization, such as agrarian cooperatives, may affect the political preferences and policy priorities of less-educated politicians (making them more likely to embrace what we label “Keynesian” policies) and also be ways in which individuals are recruited and helped to achieve a runner-up position in mayoral races. While this is an interesting possibility, other data would be needed to explore it.
Conclusion
Some scholars believe that educated citizens are more capable political leaders (Dal Bó and Finan Reference Dal Bo and Finan2018). Recent empirical research echoes this elitist view and uses education as a proxy measure of leader quality. Using a detailed dataset about performance outcomes and fiscal policies at the local level, we find that highly educated leaders do not perform better on a variety of indicators. Instead, we find evidence supporting the claim that more educated politicians implement more fiscally conservative policies, both raising less revenue and spending less money. Our database allows us to pin down some aspects of how the actions of more- and less-educated politicians differ. We find that less-educated governments are more expansionary, in the sense that they increase both revenues and spending, but we do not find that they use strategies that may be harmful in the long run. These results suggest that education should not be used as a proxy of leader quality.
Our substantive findings have broad-ranging implications. In sharp contrast to gender or ethnicity, the descriptive representation of less-educated citizens has worsened over time in lockstep with the declining influence of trade unions. Our analyses suggest that the secular decline in the share of less educated politicians within left-wing parties can shift the policies of these parties in a more conservative economic direction (see also O’Grady Reference O’Grady2019). The result could be a mismatch between the preferences of the party leadership and their constituencies, leaving the door open for political entrepreneurs to appeal to the traditional supporters of the left. While we cannot provide direct evidence about the political consequences of the changing composition of politicians, it is noteworthy that the ongoing realignment in advanced industrial democracies (Beramendi et al. Reference Beramendi, Häusermann, Kitschelt and Kriesi2015) is driven in part by changes in how more- and less-educated citizens vote. It is plausible that the increasingly elitist educational makeup of politicians is one reason, among others, why the traditional constituencies of center-Left parties feel disconnected from mainstream parties and search for alternatives such as populist parties.
Our results are also relevant for research about the unequal responsiveness of politicians to the preferences of affluent citizens (Bartels Reference Bartels2016; Giger, Rosset, and Bernauer Reference Giger, Rosset and Bernauer2012; Gilens and Page Reference Gilens and Page2014). A well-known finding is that when the preferences of citizens with a high or low socioeconomic background differ, politicians are more responsive to the preferences of the rich. The mechanisms that generate unequal responsiveness are largely unexplored, though (see Becher and Stegmueller, this volume). One possible mechanism suggested by our findings is the similarity in educational backgrounds between privileged citizens and elites. If educated citizens and elites share preferences and worldviews, it is unsurprising that when the preferences of the public diverge, elites side with people who are descriptively like them.
To be sure, our empirical analysis has limitations. We cannot tease out the relative effect of education, income, and occupation. An important follow-up question is if different types of education and degrees affect preferences in different ways. For instance, the share of lawyers, engineers, or economists in governments may have different effects on policies. Our work focuses on local elections in Spain in a specific time period and further research should establish if the results hold in other political arenas, geographic contexts, and time periods. Although we scrutinize a wide range of outcome measures, we lack some relevant measures of performance such as economic growth, which is not measured at the local level, or corruption. As is well known, RD estimates are internally valid, but they may not apply to contexts in which the margin of victory was not close.
Despite these limitations, the results of our analyses support the view that the education of who is in government affects fiscal policies. According to Hanna Pitkin, having representatives with a similar distribution of politically relevant characteristics as the represented population is important not on its own sake but mainly because we “tend to assume that people’s characteristics are a guide to the actions they will take” Pitkin (Reference Pitkin1967: 89). Our results show that education does guide the actions of politicians and suggest that increasing the substantive representation of these disadvantaged citizens would change fiscal policies and make them less conservative.


 Open access