


Iodine is an essential component in thyroid hormone biosynthesis and physiology( Reference Zimmermann, Jooste and Pandav 1 ). Thyroid hormone regulates multiple metabolic processes important for human growth and development and also regulates adult metabolism, especially lipid and carbohydrate metabolism as well as controlling energy storage and expenditure( Reference Muller, Liu and Rent 2 ). Since thyroid hormone affects energy metabolism, including regulating the biochemical functions of cellular mitochondria, iodine concentration is directly associated with various health outcomes, including the development of disorders such as hypothyroidism, intellectual disability and dyslipidaemia( Reference Zimmermann, Jooste and Pandav 1 ). Iodine deficiency is a global public health concern affecting 1·92 billion people, among which pregnant and lactating women and children up to 2 years old are the most prevalent( 3 , Reference Pearce 4 ). Deficiency of dietary iodine can be especially detrimental to pregnant women, infants and children because thyroid hormone is integral to normal neurodevelopment, and iodine deficiency reduces thyroid hormone production( Reference Pearce 4 ). Impaired lipid metabolism and abnormal lipid profiles may result when low iodine concentration stemming from low dietary iodine intake causes reductions in thyroid hormone production( Reference Pearce and Caldwell 5 ). As such, accurate evaluation of population iodine status is required, so that iodine deficiency can be identified and its clinical effects prevented.
Urinary iodine concentration (UIC) is an accepted and well-validated measure of iodine status and iodine nutrition worldwide( Reference Pearce 4 ). UIC is considered a reliable indicator for assessing recent dietary iodine intake( Reference Doggui and El Atia 6 ) and population iodine status assessment because more than 90 % of the dietary iodine appears in urine( Reference Zimmermann, Jooste and Pandav 1 , Reference Hurrell 7 ). However, since individual dietary iodine intake varies considerably from day to day, iodine excretion and UIC values will also fluctuate and quality control of methods before and after analysis is critical, so that laboratory UIC values are reliable( Reference Pearce 4 , Reference Doggui and El Atia 6 ).
A recent study reported that low UIC values were associated with dyslipidaemia in US adults( Reference Lee, Shin and Song 8 ). Associations are also shown between thyroid hormones and cardiometabolic risk factors in US youth( Reference Le, Celi and Wickham 9 ). Analysis of data from the National Health and Nutrition Examination Survey (NHANES) 2007–2010 found that thyrotropin (TSH) levels and free triiodothyronine (T3) to free thyroxine (T4) levels in euthyroid US youth correlated with multiple cardiometabolic risk factors independent of age and sex( Reference Le, Celi and Wickham 9 ). Although that study demonstrated a possible predictive role of thyroid hormone and indices of peripheral thyroid hormone metabolism in cardiometabolic risk determination, this relationship is less characterised in adolescents( Reference Le, Celi and Wickham 9 ).
Although low UIC is associated with dyslipidaemia in adults( Reference Lee, Shin and Song 8 ), the relationships between urinary iodine, thyroid hormone, lipid profiles and other cardiometabolic risk factors in adolescents are still unclear. In addition, one report suggests that UIC is age and sex dependent( Reference Als, Keller and Minder 10 ). Therefore, this study aims to examine the extent to which low UIC is associated with dyslipidaemia in adolescents and the effect of sex on any such association. Our strategy was to test this hypothesis in a large sample of adolescents from NHANES 2001–2012, a population-based survey that includes quality-controlled data from validated physical examinations and clinical laboratory testing of serum samples. These data were analysed by uni- and multivariate analyses to identify any associations between UIC, lipid profiles and other cardiometabolic risk factors and to examine possible sex differences in adolescents.
Methods
Study design and setting
The present study used cross-sectional, population-based design and secondary data analysis to investigate associations between UIC, lipid status and other cardiometabolic risk factors in adolescents from a large, nationally representative database.
Data source
Data for this study were collected from six cycles of the NHANES 2001–2012. The NHANES database is a stratified, multistage probability sample representative of the civilian non-institutionalised US population( 11 ). The survey was administered by the National Center for Health Statistics (NCHS) of the Centers for Disease Control and Prevention (CDC) and approved by its institutional review board. The NCHS designed NHANES and collected the data after receiving informed consent from either the participants or their parents. Survey data have been collected continuously since 1999 guided by detailed quality control and quality assurance procedures. The quality control and quality assurance protocols for laboratory data met the 1988 US Clinical Laboratory Improvement Act( 11 , 12 ).
Study population
Data from 1692 participants in the NHANES cycles from 2001 to 2012 who were aged 12–19 and had completed a NHANES mobile examination center (MEC) interview/questionnaire and physical examination, including UIC measures and cardiometabolic laboratory parameters, were eligible for inclusion. Age-appropriate participants with diagnosed diabetes mellitus were excluded based on self-reports of being told by a doctor or health professional that they had diabetes or ‘sugar’ diabetes, or if they were taking diabetic pills or insulin concurrently. Participants with incomplete information or concurrent pregnancy were also excluded. Signed informed consent was provided at the time of enrolment in the NHANES study, but since the data of all participants are de-identified in the NHANES database, signed informed consent was not required for the present study.
Main outcomes and variables
In the first analysis, the primary end points were UIC (independent variable) and cardiometabolic risk factors and dyslipidaemia (dependent variables). In the second analysis, UIC was treated as a dependent variable. Study subjects were divided into two groups categorised by low UIC and normal UIC. We further categorised the population by sex to explore and compare associations between potential risk factors and results, since UIC and thyroid hormone activity are both associated with sex differences. Thyroid hormone, however, was not included in the analysis because its involvement with iodine and lipid metabolism is already well established( Reference Muller, Liu and Rent 2 ).
Subjects’ blood and urine samples for laboratory testing were collected during NHANES MEC physical examinations and were then processed, stored and shipped to the Division of Laboratory Sciences, National Center for Environmental Health at the CDC( 12 ). NHANES clinical laboratory data were obtained for each subject and were measured as follows.
Urinary iodine concentration
NHANES data include UIC measurements to monitor iodine status among the US population aged 6 years and older since 1971. Information on UIC has been collected through spot urine samples by the Elemental Analysis Laboratory of the Division of Laboratory Sciences of the CDC. UIC was quantified using inductively coupled plasma dynamic reaction cell mass spectroscopy as described in the NHANES laboratory protocol manual( 12 ). The UIC cut-off point was established as 49 µg/l for school-age children (≥6 years) as proposed by World Health Organization( 13 ) guidelines for iodine deficiency.
Cardiometabolic risk factors
Measures of waist circumference, BMI calculated by weight×height2, systolic and diastolic blood pressure, apoB, fasting glucose and fasting insulin were obtained for each subject from NHANES MEC examination and laboratory data derived according to NHANES methods. Age- and sex-specific percentiles for BMI and BMI z scores were determined using NHANES MEC BMI protocol( 14 ) and were defined according to the 2000 CDC growth charts developed using a CDC SAS program( 15 , Reference Krebs, Himes and Jacobson 16 ).
HOMA-IR was calculated using the equation: (fasting glucose (mg/dl)×fasting insulin (pmol/l))/405/6( Reference Matthews, Hosker and Rudenski 17 , Reference Geloneze, Repetto and Geloneze 18 ).
Dyslipidaemia
Measures of total cholesterol (TC), TAG, HDL-cholesterol, LDL-cholesterol and non-HDL-cholesterol were performed on fasting blood samples (overnight fast before morning blood collection) to assess for dyslipidaemia. For this study, dyslipidaemia in children and adolescents was defined based on at least one of the following values: elevated TC >4·4mmol/l; lowered HDL-cholesterol <1·17mmol/l; elevated LDL-cholesterol >2·85mmol/l; elevated TAG defined as >1·02mmol/l for adolescents aged 10–19 years, as recommended by the US National Heart, Lung and Blood Institute( 19 ).
Other variables
Potential confounding variables were also measured for each subject using NHANES data. These variables included demographic data (i.e. age, sex, race/ethnicity, family income:poverty ratio) and lifestyle factors (tobacco exposure, physical activity), which were all obtained by NHANES technician-administered interviews and questionnaires.
Tobacco exposure was defined as a response of ‘yes’ to either of the two questions: ‘Have you ever tried cigarette smoking, even 1 or 2 puffs?’ or ‘Does anyone you live with smoke cigarettes, cigars, or pipes anywhere inside the home?’.
Physical activity was estimated in pre-2007 NHANES subjects by summing the product of weekly time spent in each activity reported by the participant multiplied by the metabolic equivalent of task (MET) value for that activity, yielding an MET-h index. One MET is the energy expenditure of 4·1868 kJ/kg body weight per h. For this study, subjects who had MET-min/week ≥500 were referred to as physically active, while those with <500 MET-min/week were referred to as non-active according to national guidelines( 20 ). For NHANES cycles after 2007, the physical activity questionnaire was changed and weekly MET-h was estimated for moderate and vigorous activities (e.g. walking or cycling, moderate-intensity sports and fitness or recreation activities or more vigorous sports or fitness activities) using participants’ responses to questions by interviewers about the number of days per week engaged in physical activities and number of minutes engaged in these activities on a typical day. Then using an MET of 4·0 for walking or cycling, 4·0 for walking or bicycling for transportation and moderate-intensity and 8·0 for vigorous intensity activities, these data were applied to estimate the MET min/week of moderate to vigorous activity outside of participants’ routine activities of daily living, as previously described( Reference Janssen, Carson and Katmarzyk 21 ). As explained above, participants in the present study were categorised as active (≥500 MET-min/week) or non-active (<500 MET-min/week) based on these data.
Statistical analysis
Continuous variables are presented as the means with their standard errors as analysed by complex samples general linear model. Categorical variables are presented as count and weighted percentages as analysed by χ 2 test. Univariate and multivariate regression analyses (linear and logistic) were performed to examine the associations between cardiometabolic risk factors, dyslipidaemia and UIC in adolescents. Multivariate regression models were adjusted for all baseline characteristics, including socio-demographic variables that may be important in the present population-based study (age, sex, race, poverty:income ratio, tobacco exposure and physical activity level). All analyses were weighted for urinary iodine, stratum and primary sampling units per recommendations from the NCHS as part of the NHANES laboratory protocol( 12 ).
NHANES provides different subsample weights for each variable of interest. These subsample weights can be used to estimate the weighted sample size (weighted N). All statistical assessments were two sided and evaluated at the 0·05 level of significance. All statistical analyses were performed using SAS version 9.4 (Windows NT version; SAS Institute Inc.).
Results
Study sample
Among 61 951 participants whose data were collected in six cycles of NHANES from 2001 to 2012, a total of 10 928 were aged 12–19 years. After excluding 6591 participants without complete weighted values, 2612 without UIC data, twelve with diabetes and twenty-one pregnant women, the data of the remaining 1692 participants were retained as the analytic sample. The analytic sample size was equivalent to a population-based sample size of 13 336 716 participants.
Subject characteristics
The analyses included data from 1692 subjects, 178 with low UIC (mean age 15·6 (se 0·23) years) and 1514 with normal UIC (mean age 15·4 (se 0·08) years). More females than males had low UIC (57·3 v. 45·2 %, P=0·04). Statistically significant differences were found in subjects’ physical activity levels (reported in MET), apoB, lipid profiles (i.e. TC, HDL-cholesterol, non-HDL-cholesterol and LDL-cholesterol between those with low UIC and normal UIC (Table 1). Among male subjects, associations were found between UIC and elevated TC, elevated non-HDL and elevated LDL; in female subjects, apoB, fasting insulin, elevated non-HDL and elevated LDL were associated with UIC (Table 1).
Table 1 Baseline characteristic of study population, National Health and Nutrition Examination Survey 2001–2012 (unweighted n 1692; weighted n 1 3336 716)† ‡ (Numbers and percentages; mean values with their standard errors)
UIC, urinary iodine concentrations; MET, metabolic equivalent of task; SBP, systolic blood pressure; DBP, diastolic blood pressure; TC, total cholesterol; HOMA-IR, homoeostatic model assessment for insulin resistance.
* Significant difference between low UIC and normal UIC (P<0·05).
† Continuous variables were shown as means with their standard errors; categorical variables were shown as counts (weighted %).
‡ Low UIC, <49 µg/l; normal UIC, ≥49 µg/l.
Cardiometabolic risk factors, dyslipidaemia and urinary iodine status stratified by sex
Univariate analysis treating UIC as the independent variable revealed that subjects with low UIC had higher apoB as compared to those with normal UIC (mean 0·07), subjects with low UIC had 1·96 higher odds of having abnormal elevated TC (>4·4mmol/l) (95 % CI 1·37, 2·81), subjects with low UIC had 1·92 higher odds of having abnormal elevated non-HDL-cholesterol (>3·11mmol/l) (95 % CI 1·33, 2·76) and subjects with low UIC had 2·77 higher odds of having elevated LDL (>2·85mmol/l) (95 % CI 1·83, 4·19). Males with low UIC were at significantly higher risk of elevated TC (≥4·4mmol/l) as compared to those with normal UIC (OR=2·23, 95 % CI 1·19, 4·17), and males with low UIC were at significantly higher risk of elevated LDL (≥2·85mmol/l) (OR=2·82, 95 % CI 1·39, 5·75). Female subjects with low UIC had higher apoB (mean: 70·07), lower fasting insulin (mean: –13·76), abnormal elevated non-HDL (≥3·11mmol/l) (OR=1·99, 95 % CI 1·10, 3·60) or abnormal elevated LDL (≥2·85mmol/l) (OR=2·80, 95 % CI 1·53, 5·14) compared to females with normal UIC (Table 2).
Table 2 Linear regression analysis of cardiometabolic factors according to urinary iodine status (β-Coefficients and standard errors; odds ratios and 95 % confidence intervals)

SBP, systolic blood pressure; DBP, diastolic blood pressure; TC, total cholesterol; aOR, adjusted OR; HOMA-IR, homoeostatic model assessment for insulin resistance; Ref., reference.
* Statistical significance (P<0·05).
† Standard error cannot be measured because the model was infinity.
After adjusting for age, sex, race, poverty:income ratio, tobacco exposure and physical activity, multivariate regression analysis showed that subjects with low UIC had higher apoB (mean: 0·04) and were at 1·69 times the risk of elevated TC (≥4·4mmol/l) (95 % CI 1·17, 2·46), 1·73 times the risk of elevated non-HDL (≥3·11mmol/l) (95 % CI 1·17, 2·58) and 2·43 times the risk of elevated LDL (≥2·85mmol/l) (95 % CI 1·58, 3·74). Male subjects with low UIC had higher apoB (mean: 0·04) and were at higher risk of elevated TC (≥4·4mmol/l) (OR=2·10; 95 % CI 1·14, 3·88) and elevated LDL (≥2·85mmol/l) (OR=2·84; 95 % CI 1·33, 6·07) than did those with normal UIC. Females with lower UIC had higher apoB (mean: 0·04) and were at higher risk of elevated LDL (≥2·85 mmol/l) (OR=2·15, 95 % CI 1·10, 4·19) than were females with normal UIC. However, females with lower UIC had lower fasting insulin (mean: –11·19) (Table 2). The results of multivariate linear regression analysis are shown in Fig. 1.
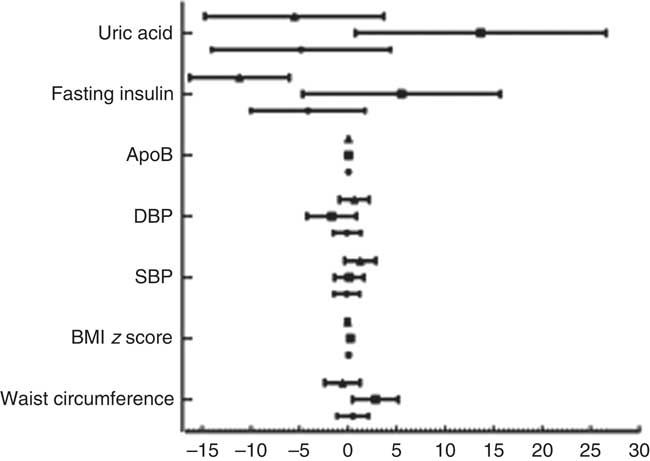
Fig. 1 Results of multivariate linear regression analysis. Values are means, with standard errors represented by horizontal bars. DBP, diastolic blood pressure; SBP, systolic blood pressure. ![]() , Total;
, Total; ![]() , male;
, male; ![]() , female.
, female.
In the following association analyses, UIC was treated as a dependent variable, and cardiometabolic risk factors and dyslipidaemia were treated as independent variables (Table 3). The multivariate analyses indicated that in the total population, the risk of low UIC was 1·71 times greater in those with elevated TC (≥4·4mmol/l) (95 % CI 1·18, 2·48), 1·75 times greater in those with elevated non-HDL (≥3·11mmol/l) (95 % CI 1·17, 2·60) and 2·44 times greater in those with elevated LDL (≥2·85mmol/l) (95 % CI 1·59, 3·75). Multivariate analyses also revealed that male patients had abnormal elevated TC (≥4·4mmol/l) and abnormal elevated LDL (≥2·85mmol/l) (adjusted OR=2·16, 95 % CI 1·13, 4·13 and adjusted OR=2·87, 95 % CI 1·33, 6·18, respectively). On the other hand, female patients with abnormal elevated LDL (≥2·85mmol/l) had 2·15 times the risk of having lower UIC (95 % CI 1·10, 4·21) (Table 3).
Table 3 Risk of low urinary iodine according to cardiometabolic factors (Odds ratios and 95 % confidence intervals)
aOR, adjusted OR; SBP, systolic blood pressure; DBP, diastolic blood pressure; TC, total cholesterol; HOMA-IR, homoeostatic model assessment for insulin resistance; Ref., reference.
* Statistical significance (P<0·05).
Discussion
Among the 1692 adolescent subjects enrolled in this study, those with low UIC had a greater number of associations with dyslipidaemia and cardiometabolic risk factors. Significant differences were found in physical activity levels, apoB levels and lipid profiles (TC, HDL, non-HDL, LDL and TAG) between subjects with low and normal UIC. In analyses treating UIC as a dependent variable, the risk of low UIC was significantly greater in those with higher apoB (95 % CI 1·00, 1·03), elevated TC (≥4·4mmol/l) (95 % CI 1·37, 2·81) and elevated non-HDL (≥3·11mmol/l) (95 % CI 1·28, 2·66) than in those with normal UIC. In males, the risks of elevated TC and elevated LDL were significantly higher in those with low UIC than in those with normal UIC. Female subjects with low UIC were at higher risk of abnormal apoB, abnormal fasting insulin, elevated non-HDL and elevated LDL than were those with normal UIC. Also, more females than males had low UIC. Overall, these results show that both male and female adolescents with low UIC tend to be at greater risk of dyslipidaemia and abnormal cardiometabolic biomarkers, though the specific parameters showing abnormalities differed between the sexes.
In adults, lower HDL values and elevated LDL values are associated with UIC, demonstrating a tendency towards dyslipidaemia( Reference Lee, Shin and Song 8 ). Similarly, results of the present study show that UIC in adolescents is associated with dyslipidaemia, though the associations with specific cardiometabolic risk factors are different for adolescents than in adults. Since thyroid hormone is closely associated with multiple metabolic pathways, any decrease in thyroid hormone levels caused by low dietary iodine intake may lead to abnormal lipid metabolism( Reference Lee, Shin and Song 8 ). It is probably not surprising to find associations between low UIC and a range of cardiometabolic risk factors, given the relationship between iodine and thyroid function and that euthyroid adolescents have already been shown to have correlations between thyrotropin and thyroid hormone levels and multiple cardiometabolic risk factors, including classic factors such as overweight and obesity, high blood pressure, and abnormal lipid and glucose metabolism( Reference Le, Celi and Wickham 9 ). Also, thyrotropin concentration was associated with elevated TC, LDL and TAG in a German population-based study of adolescents, and the elevated values were found more frequently in those who were overweight or obese with higher BMI( Reference Witte, Ittermann and Thamm 22 ). In the present study, we did not find significant correlations between subjects’ BMI and abnormal lipid profiles, but that was also not the focus of this study. Nevertheless, animal studies have demonstrated that dietary iodine intake affects lipid metabolism, with dramatic decreases in thyroid hormone production in iodine deficiency and corresponding increases in TC, LDL and TAG values( Reference Zhao, Ye and Sun 23 ). Apparently, lipid levels may also be affected by iodine deficiency independent of the association with thyroid physiology, since iodine exhibits antimicrobial, anti-inflammatory and anti-proliferative properties as well as reducing the viscosity of blood, all of which contribute to cardiovascular health( Reference Hoption Cann 24 ).
Results also differed between the sexes in the present study, and other authors suggest possible explanations. In the present study, low UIC was associated with apoB, fasting insulin and elevated non-HDL-cholesterol in female adolescents, and associated with elevated TC and LDL in male adolescents. This may be explained in part by the fact that excess body fat affects lipid kinetics differently in men and women( Reference Magkos and Mittendorfer 25 ), even though the precise mechanism has not yet been elucidated. Differences have also been found between the sexes in the effects of excess iodine on lipid metabolism, and sex hormones have been associated with lipid metabolism( Reference Zhao, Ye and Sun 23 ). Sex differences in lipid metabolism are considered to be the result of complex interactions of hormones combined with the action of direct or indirect modulators of lipid metabolism( Reference Wang, Magkos and Mittendorfer 26 ). Nevertheless, the effects of progestogens and androgens only partially explain the differences in plasma lipids between the sexes, and the underlying modulators of lipid metabolism in men and women are still not fully understood.
After adjusting for demographic and lifestyle variables, multivariate regression analysis still showed significant differences between low UIC and normal UIC groups, indicating that UIC could possibly serve as a reliable biomarker for dyslipidaemia in adolescents. However, authors of another study using NHANES data and UIC measured by spot urine samples( Reference Lee, Shin and Song 8 ) suggest that, although UIC may be a reliable biomarker at the population level, it may not be as useful at the individual level. Clearly, further studies are needed to identify biomarkers for iodine status in individuals and to better understand the effects of iodine levels on lipid metabolism.
According to national surveys, good progress has been made in reducing iodine deficiency and at least forty-five countries have adequate iodine status( Reference Zimmermann and Andersson 27 ). Much of this progress is attributed to households in developed and developing countries responding to programs of UNICEF and WHO urging people to use iodised salt, which was reported by UNICEF in 2012 to be 71 % worldwide( 28 ). However, the need for iodine supplementation is determined on an individual basis. Thyroid hormone levels actually dictate the amount of iodine needed by an individual to produce more T3 and T4( Reference Mansourian 29 ), and the individual’s age and physiological status are involved as well( Reference Luton, Alberti and Vuillard 30 ). Therefore, interventions to correct iodine deficiency in individuals may still be necessary to help support thyroid hormone production and ensure that the multiple metabolic processes regulated by thyroid hormone can be carried out effectively, especially including neurodevelopment in infants and children, and lipid and carbohydrate metabolism in adults( Reference Muller, Liu and Rent 2 ). An investigation of iodine supplementation showed that moderate to severe iodine deficiency in overweight women resulted in elevated thyrotropin levels and lipid levels, and that iodine supplementation reduced hypercholesterolaemia, ultimately reducing cardiovascular risk( Reference Herter-Aeberli, Cherkaoui and El Ansari 31 ). In that clinical trial, iodine supplementation produced a steady increase in UIC values over 6 months. Accordingly, in adolescents and adults with low UIC, such supplementation may be needed to reduce dyslipidaemia and cardiometabolic risk factors, occurring as a result of iodine-deficiency-induced thyroid disorders as well as the associated risk of neurodevelopment disorders in children.
Strengths and limitations
Using the 2001–2012 NHANES database added strength to the observations and conclusions of the present study. NHANES data are comprehensive and, because they are drawn from a large, diverse sample of the US population, they are nationally representative. Therefore, the findings of this study are likely generalisable to the overall US population, even though they cannot be generalised to other populations. Nevertheless, this study still has several limitations, mainly that the NHANES data set is cross-sectional and therefore results cannot be attributed to cause. Also, the use of interviews and self-reported questionnaires in collecting NHANES data may involve inaccurate reporting or lack of full recall by participants or participants’ parents, which may result in recall bias. Although NHANES data include results of physical examination and laboratory analysis of biological samples, certain factors needed for thorough investigation of relationships between thyroid hormone and lipid synthesis were not available in the NHANES database, including levels of PTH, vitamin D, Ca and ultrasound results of thyroid function, which might have added additional support to our analysis. Further longitudinal prospective study is still needed among adolescent populations to corroborate our results and to fully understand associations between low UIC, dyslipidaemia and cardiometabolic risk factors.
Conclusions
Significant differences are found in cardiometabolic risk factors between adolescents with low UIC and those with normal UIC, with greater risk of those with low UIC having dyslipidaemia and other abnormal cardiometabolic risk factors. Associations with low UIC vary between sexes, including greater risk of having elevated lipids (TC and LDL) among male adolescents with low UIC and greater risk among female adolescents with low UIC for having abnormal apoB, fasting insulin, elevated non-HDL and elevated LDL. Although it is not certain that these relationships will continue into adulthood, results of the present study may help identify youth who might benefit from interventions to improve cardiometabolic risk.
Declarations
Ethical considerations and consent to participate
Use of the NHANES database is approved by the Institutional Review Boards of the NCHS of the CDC in the United States and use of the database is granted to investigators for research purposes only( Reference Lee, Shin and Song 8 ). All participants’ data in the NHANES database are de-identified and, therefore, no signed informed consent was required of study subjects.
Data availability
The NHANES dataset supporting the conclusions of this article are available at https://www.cdc.gov/Nchs/Nhanes/about_nhanes.htm.
Consent for publication: not applicable.
Acknowledgements
This research received no specific grant from any funding agency, commercial or not-for-profit sectors.
L. G., Q. P. and X. W. designed and directed the project. X. W., T. X., L. Z., X. J., F. M., L. L. and J. Z. collected and analysed the data. All authors discussed the results and contributed to the final manuscript.
The authors have no conflicts of interest associated with the present study.


