

I. INTRODUCTION
Digital music data on the Internet are explosively growing. Therefore, applications of content-based music retrieval (CBMR) system are more and more popular. Searching music by a particular melody of a song directly is more convenient than by a name of a song for people. Moreover, according to the survey from the United Nations [Reference Chamie1], the 21st century will witness even more rapid population ageing than did the century just past; therefore, it is important to develop an efficient and accurate way to retrieve the music data.
A CBMR method is a more effective approach for a music retrieval system than the text-based method. A CBMR system aims to retrieve and query music by acoustic features of music, while a text-based music retrieval system only takes names, lyrics, and ID3 tags of songs into consideration.
Query-by-singing (QBS) is a popular method in CBMR. Many approaches based on QBS have been developed currently. Huang [Reference Huang2] proposed a QBS system by extracting the pitches and the volumes of the music. The data are used to build an index structure via advanced fast pattern index (AFPI) and Alignment [Reference Su, Huang, Yeh and Tseng3] as its searching technique.
Lu et al. [Reference Lu, You and Zhang4] proposed an extraction mechanism that regards audio data as a sequence of music notes, and then a hierarchical matching algorithm was performed. Finally, the similarity scores of each song to the query were combined with respect to the pitches and the rhythm by a linear ranking formula. This approach is accurate when an instrumental clip is given as the search key; however, the accuracy decreases when the input is the humming voice from a human. Cui et al. [Reference Cui, Liu, Pu, Shen and Tan5] introduced a music database that applied both text-based and content-based techniques simultaneously. Various acoustic features are regarded as indices and trained by a neural network mechanism. Such a design of the music database provides high efficiency and accuracy due to its good algorithms, but it lacks in portability since the implementation is too complicated. Inspired by Huang [Reference Huang2], a QBS-CBMR system was proposed in our previous work [Reference Chiang, Lee, Hsieh and Wang6]. An entropy-weighting mechanism was developed to determine the final similarity.
Presently, state-of-the-art QBS-CBMR systems can achieve high accuracy under clean environments. However, under noisy environments, the performance might degrade due to the mismatch between the noisy feature and the clean-trained model. Motivated by this concern, this paper extends the previous work [Reference Chiang, Lee, Hsieh and Wang6]. Noise effects are further reduced by applying Approximate Karbunen–Loeve transform (AKLT) [Reference Yang and Wang7] for preprocessing. The proposed robust QBS-CBMR system has five stages:
-
(1) Noise reduction: Considering the real case of music retrieval, the noise in the music clips may impact the results. Therefore, we use AKLT as preprocess to reduce the influence of the noise for all music clips.
-
(2) Feature extraction: The input music clip is first converted into a 39-dimensional Mel-frequency cepstral coefficients (MFCCs) [Reference Tao, Liu and Tang8,Reference Tu, Liao, Chin, Lin and Wang9] and 12-dimensional Chroma [Reference Shepard10]. For each music clip, there are totally 51-dimensional features. Second, each dimension of features is transformed into symbolic sequences using the adapted symbolic aggregate approximation (adapted SAX) method [Reference Lin, Keogh, Lonardi and Chiu11], which is proposed in this work. These symbolic sequences are also called the SAX representation.
-
(3) The AFPI tree structure: Following feature extraction stage, the input music is transformed into 51 symbolic sequences with respect to 51 features. In the proposed QBS-CBMR system, symbolic sequences are regarded as a search key. Finally, these symbolic sequences are stored by a tree structure called the AFPI tree [Reference Huang2] due to high efficiency for the retrieval task.
-
(4) Score calculation: The results of the music retrieval task are determined by the “scores”. After the two stages mentioned above, music clips are transformed into 51 AFPI trees. A partial score is calculated for each AFPI tree first. The final score is then obtained by the weighted summation of all partial scores, where the weighting of each partial score is determined by its entropy [Reference Shannon12]. The higher scores denote the higher similarity between the query music clip and the songs in the database.
The rest of this paper contains the following sections: Section II briefly reviews related works. Section III briefs the overview of the proposed music retrieval system. The details of the feature extraction stage are discussed in Section IV. Section V describes how the database works to search the music clip input in detail. In Section VI, we present the performance of the proposed system through some experiments. Finally, Section VII concludes the paper.
II. RELATED WORKS
A) Music content representation
The MFCCs were first proposed by Davis and Mermelstein in 1980 [Reference Davis and Mermelstein13]. The MFCCs are non-parametric representations of the audio signals and are used to model the human auditory perception system [Reference Tu, Liao, Chin, Lin and Wang9]. Therefore, MFCCs are useful for audio recognition [Reference Tyagi and Wellekens14]. This method had made important contributions in music retrieval to date. Tao et al. [Reference Tao, Liu and Tang8] developed a QBS system by using the MFCCs matrix. For improved system efficiency, a two-stage clustering scheme was used to re-organize the database.
On the other hand, the Chroma feature proposed by Shepard [Reference Shepard10] has been applied in studies of music retrieval with great effectiveness. Xiong et al. [Reference Xiong, Yu and Shi15] proposed a music retrieval system that used Chroma feature and notes detection technology. The main concept of this system is to extract a music fingerprint from the Chroma feature. Sumi et al. [Reference Sumi, Arai, Fujishima and Hashimoto16] proposed a symbol-based retrieval system that uses Chroma feature and pitch features to build queries. Moreover, to make the system with high precision, conditional random fields has been used to enhance features.
Chroma features can work well when queries and reference data are played from different music scores. It has been found that Chroma features can identify songs in different versions. Hence, we can use Chroma features to identify all kinds of songs, even cover versions [Reference Peeters17]. This research extends our previous work [Reference Chiang, Lee, Hsieh and Wang6]. Compared with [Reference Chiang, Lee, Hsieh and Wang6], a new feature vector containing 39-MFCCs features and 12-Chroma features are extracted.
B) Noise reduction
The actual application must eliminate environmental noise. Otherwise, the accuracy of the music retrieval results decreases. Shen et al. [Reference Shen, Shepherd, Cui and Tan18] proposed a two-layer structure Hybrid Singer Identifier, including a preprocessing module and a singer modeling module. In the preprocessing module, the given music clip is separated into vocal and non-vocal segments. After the audio features are extracted, vocal features are fed into Vocal Timbre and Vocal Pitch models, and non-vocal features are fed into Instrument and Genre models. It had been proven that the work of [Reference Shen, Shepherd, Cui and Tan18] is robust against different kinds of audio noises. However, the noise is not removed and so the performance will be still affected by noise.
Mittal and Phamdo [Reference Mittal and Phamdo19] proposed a Karhunen–Loeve transform (KLT)-based approach for speech enhancement. The basic principle is to decompose the vector space of the noisy speech into two subspaces, one is speech-plus-noise subspace and the other is a noise subspace. The signal is enhanced by removing the noise subspace from the speech-plus-noise subspace [Reference Ephraim and Van Trees20]. The KLT can perform the decomposition of noisy speech. Since the computational complexity of KLT is very high, the proposed system uses AKLT with wavelet packet expansion [Reference Yang and Wang7] to process the noise reduction of input music clips.
III. THE SYSTEM ARCHITECTURE OVERVIEW
The structure of the proposed system is developed based on the work of Huang [Reference Huang2]. Figure 1 demonstrates the proposed system. The feature extraction stage converts music files into 51 symbolic sequences, which are stored using tree structures. The methods used in the feature extraction stage are discussed in detail in Section III.

Fig. 1. The main structure of t he proposed music retrieval system.
The feature extraction stage mainly contains two steps: (1) transform music files into 39 of the MFCCs features [Reference Tao, Liu and Tang8,Reference Tu, Liao, Chin, Lin and Wang9] and 12 of the Chroma features [Reference Shepard10]; (2) convert each dimension of MFCCs into a symbolic sequence by the piecewise aggregate approximation (PAA) method [Reference Lin, Keogh, Lonardi and Chiu11] and the adapted SAX [Reference Lin, Keogh, Lonardi and Chiu11].
After feature extraction, each of the 51 symbolic sequences is then stored using a tree structure called the AFPI tree. Next, the 51 AFPI trees are used to generate a final score to evaluate the similarity between the query music clip and the songs in the database.
Two components stored in the database for each song are:
-
(1) 51 AFPI tree structures.
-
(2) Music IDs and other information.
The searching process only accesses these components instead of the original audio files, so that the proposed music retrieval system is portable.
In the proposed implementation, two music retrieval-related operations are performed: adding a complete music file into the database (the ADD operation), and searching from the database with a music clip file (the SEARCH operation). Both operations run the music retrieving process and access the tree structures in the database. However, this study is focused on the SEARCH operation for the following reasons:
-
• For a user, searching a database to find a song is more desirable than simply “donating” (adding) a song to the database.
-
• The only two differences between ADD and SEARCH are: (1) ADD builds the structure, while SEARCH searches the structure; (2) SEARCH analyzes the result from the database structures, while ADD does not.
IV. MUSIC RETRIEVAL PROCESS
Figure 2 shows the feature extraction stage, which is performed as follows:

Fig. 2. A diagram for the music retrieving process in our system.
A) MFCCs
MFCCs are non-parametric representations of audio signals, which model the human auditory perception system [Reference Tu, Liao, Chin, Lin and Wang9,Reference Davis and Mermelstein13]. Therefore, MFCCs are regarded as a useful feature for audio recognition.
The derivation of MFCCs is based on the powers of the Mel windows. Let X ω denotes the ωth power spectral component of an audio signal, S k be the power in kth Mel window, and M represents the number of the Mel windows usually ranging from 20 to 24. Then S k can be calculated by:
 $$S^k = \sum\limits_{\omega = 0}^{F/2 - 1} W_{\omega}^k \cdot X_{\omega}, \quad k = 1,2, \ldots, M,$$
where W k is the kth Mel window, and F is the number of samples in a frame, which must be a power of 2, and usually set to 256 or 512 that makes each frame ranging from 20 to 30 ms approximately.
Let L denote the desired order of the MFCCs. Then, we can calculate the MFCCs from logarithm and cosine transforms.
 $$c_n = \sum\limits_{k=1}^M \log \lpar S^k \rpar \cos \left[\lpar k - 0.5 \rpar {n\pi \over M} \right], \quad n = 1,2, \ldots, L.$$
B) Chroma feature
Shepard proposed the use of tone height and Chroma to perform the perception of pitch [Reference Shepard10]. The Chroma vector can be divided into 12 semi-tone families, between 0 and 1 into 12 equal parts. Additionally, 12 semi-tones constitute an octave. Shepard conceptualized pitch perceived by humans as a helix with a 1D line. Figure 3 illustrates this helix with its two dimensions. The vertical dimension is the continuous tone height, and the angular dimension is the Chroma. The Shepard decomposition of pitch can be expressed as

Fig. 3. Shepard helix of pitch perception. The vertical dimension is tone height, and the angular dimension is chroma.
 $$f_p = 2^{h + c},$$
where p is pitch, f is frequency, h is tone height, $c \in [0,1)$
, and
$c \in [0,1)$
, and $h \in Zh \in \hbox{Z}$
.
$h \in Zh \in \hbox{Z}$
.
The Chroma for a given frequency can then be calculated as follows:
 $$c = \log_2 f_p - \lfloor x \log_2 f_p \rfloor,$$
where $\lfloor\cdot \rfloor$
denotes the greatest integer function. Chroma is the fractional part of the 2-based logarithm of frequency. Like the ideas of pitch, some frequencies are mapped to the same class.
$\lfloor\cdot \rfloor$
denotes the greatest integer function. Chroma is the fractional part of the 2-based logarithm of frequency. Like the ideas of pitch, some frequencies are mapped to the same class.
C) PAA and the adapted SAX
The PAA method [Reference Lin, Keogh, Lonardi and Chiu11] reduces an n-dimensional vector into a w-dimensional one. The vector generated by the PAA method is called the PAA representation. An example of the PAA representation is demonstrated in Fig. 4.

Fig. 4. A 128-dimensional time series vector is reduced to an 8-dimensional vector of PAA representation [11].
After converting each row of the feature matrix into the PAA representations, the adapted SAX method is applied to the PAA representations to construct symbolic sequences shown in Fig. 5. The adapted SAX method is developed based on the work of Lin et al. [Reference Lin, Keogh, Lonardi and Chiu11]. The difference between these two methods is that the original SAX uses the Gaussian distribution curves, while the adapted SAX uses Cauchy distribution, whose probability density function (PDF) and cumulative distribution function (CDF) curves both look similar to the Gaussian curves. Figure 6 illustrates the difference.

Fig. 5. An illustration of a symbolic sequence. The PAA representation shown in Fig. 4 is converted into a symbolic sequence of three distinct symbols: a, b, c, via the original SAX method.

Fig. 6. The pdf curves for the standard Cauchy and the standard Gaussian distributions. The curve exactly on the solid-colored area is the Cauchy distribution curve.
When implementing both of the original SAX or the adapted SAX method, the inverse function of the CDF of the specified distribution is required in order to determine, where the breakpoints are located (see Fig. 7).

Fig. 7. An example of a cumulative distribution function (CDF) P of the time series variable x. When n=5, the breakpoints are located in the positions of P(1/5), P(2/5), P(3/5), and P(4/5), respectively. To find x from P(x), the inverse function of a CDF is required.
The CDF of the Gaussian distribution is represented as the following equation:
 $${1 \over 2} \left[1 + \hbox{erf} \left({x - \mu \over \sqrt{2\sigma^2}} \right) \right],$$
where erf(·) denotes the complementary error function.
Based on the work of Huang [Reference Huang2], this paper proposes the adapted SAX by applying Cauchy distribution. The CDF of the Cauchy distribution is represented as:
 $${1 \over \pi} \left[1 + \hbox{arctan} \left({x - x_0 \over \gamma} \right) \right] + {1 \over 2},$$
where x 0 x 0 is the location parameter, and γγ represents the half of the interquartile range.
The adapted SAX with (6) is a more feasible and convenient way than the original SAX with (5). Both (5) and (6) are increasing functions for all real numbers x, while (5) contains the Gaussian error function (erf), whose inverse function does not commonly exist in many standard libraries in popular programming languages such as C++ and Java. However, (6) has a “special function”, the arctan function, whose inverse function is identical to the tangent function in almost all standard libraries of the major programming languages. Hence, implementation of the adapted SAX with (6) is more feasible and convenient compared with implementation of the original SAX with (5).
V. THE STORAGE STRUCTURES AND THE SCORING MECHANISM OF THE DATABASE
The storage of the database contains 51 AFPI tree structures [Reference Huang2]. Each tree is constructed by the SAX representation of the corresponding MFCCs feature. Firstly, the partial score for the similarity between the query music clip and the songs in the database is calculated from each AFPI tree. Secondly, the final score for the overall similarity is determined by the proposed weighted summation of the partial scores, with respect to the entropy [Reference Shannon12] of the SAX representation in each feature of the query.
The proposed QBS-CBMR system only stores the AFPI trees and the information of the songs in the database. Therefore, the proposed system is portable. The two methods used to build the storage structure in the proposed system are described in detail as follows.
A) AFPI structure
Figure 8 shows an AFPI tree. The root of the tree consists of n pointers for each distinct symbol that can possibly be generated in the SAX representation [Reference Huang2,Reference Su, Huang, Yeh and Tseng3]. Each pointer in the root for the symbol S i points to a child node, which contains n sets of pattern relation records, respectively, in which each set is for another symbol S j that can be either the same as or different from S i . Each record of pattern relation contains an integer for the music ID and a K-bit binary code for storing relation states.

Fig. 8. Example of AFPI tree structure, where n=6 and K=3. This figure is redrafted from [2].
The kth bit from the right in the K-bit binary code determines whether there exists a subsequence of the SAX representation from a particular music ID, in which the subsequence has a length of k+1 beginning with S i and ending with S j .
For example, in Fig. 8, the pointer for the symbol “b” at the root points to a child node, in which the pattern relation set for “a” contains a binary code of 010 for song 1 and a binary code of 011 for song 2. The binary code just mentioned for song 2 means that there are subsequences “ba” and “b*a”, but not “b**a”, of the SAX representation for the song. In this example, each asterisk can be replaced with any symbol.
When searching for a song with a music clip, the whole SAX representation of each MFCCs feature from the music clip is parsed into a set of pattern relations, which is then compared with the respective AFPI tree. Table 1 shows two examples of a pattern relation set for a SAX representation.
Table 1. Two examples of pattern relations.
After a feature from the music clip is parsed into a pattern relation set, it is compared with all pattern relation sets stored in the AFPI tree. This step obtains a partial score for the similarity of the music clip to each song in the database. Pattern relation sets can be compared in the following two steps:
-
(1) Find the intersection of the two sets of (S i , S j ) from each pattern relation set.
-
(2) For every (S i , S j ) in the intersection set, find the number of common bits in the binary codes of the two pattern relation sets. This step is illustrated in Table 2 as an example.
Table 2. The common bits.
*Common bits and the two binary codes must be in the same position.
†“Yes” and “No” are marked in the order of the content of the two binary codes, where “Yes” means that a pair of the common bits at the specified position exists.
Table 2 shows the common bits of the binary codes from song 2 and the music clip in the example in Table 1. Since the summation of the number of common bits is 1+2=3, the partial score given by the AFPI tree is thus 3 points.
B) Entropy and the mechanism for merging the 51 partial scores given by each AFPI tree
The concept of information entropy was first introduced by Claude E. Shannon in 1948 [Reference Shannon12]. Information Entropy Methods are still widely used in many computer science fields and an entropy method was applied in this study.
The information entropy [Reference Shannon12] H(X) of a discrete random variable X can be calculated by the following formula:
 $$H \lpar X \rpar = \sum\limits_i P \lpar x_i \rpar \log_b P \lpar x_i \rpar ,$$
where x i denotes each possible event of X, and P(x i ) is the probability that the event x i occurs, while b is the logarithmic base used, usually set to 2 for binary logarithm.
In the proposed system, entropy in (7) is applied for the SAX representation sequence {a 1, a 2, …, a n }. We set x i as each distinct symbol that can be found in the sequence, and P(x i ) represents the probability that a j equals x i , where j is a uniformly distributed random variable of an integer between 1 and n (inclusive).
C) Mechanism for merging the 51 partial scores given by each AFPI tree
To search for a music clip, each of the 51 AFPI trees gives a particular partial score for the similarity to the music clip, and the 51 scores are combined. Next, the combined score is the “final score”, which is then ranked as the final ranking result.
The final score is obtained by calculating the weighted summation of all partial scores with the corresponding entropy, which can be evaluated as the following equation:
 $$R_{final} = \sum\limits_{k = 1}^{13} R_k \cdot H \lpar X_k \rpar ,$$
where R k is the partial score given with respect to the kth MFCCs feature, and H(X k ) represents the entropy of the random variable X k from the SAX representation sequence of the search key in the kth MFCCs feature.
D) Noise suppression based on AKLT
Walter and Zhang proposed [Reference Walter and Zhang21] that, for N random vectors $\{{\bf x}_{n} \in R^{d} \vert n = 1,2, \ldots, N\}$
, the following steps can find the approximate KL basis. First, expand N vectors into complete wavelet packet coefficients. Then calculate the variance at each node and search this variance tree for the best basis. Sort the best basis vector in decreasing order, and select the top m best basis vectors to form a matrix U. Finally, transform N random vectors using the matrix U and diagonalize the covariance matrix R
N
of these vectors to obtain the eigenvectors. Since we expect m≪d, the reduction in computational load must be considered. Figure 9 illustrates the flowchart.
$\{{\bf x}_{n} \in R^{d} \vert n = 1,2, \ldots, N\}$
, the following steps can find the approximate KL basis. First, expand N vectors into complete wavelet packet coefficients. Then calculate the variance at each node and search this variance tree for the best basis. Sort the best basis vector in decreasing order, and select the top m best basis vectors to form a matrix U. Finally, transform N random vectors using the matrix U and diagonalize the covariance matrix R
N
of these vectors to obtain the eigenvectors. Since we expect m≪d, the reduction in computational load must be considered. Figure 9 illustrates the flowchart.

Fig. 9. The flowchart of AKLT.
A linear estimator is used for noise reduction [Reference Mittal and Phamdo19]. Let z, y, and w be K-dimensional vectors denoting noisy speech, clean speech, and noise, respectively. Transform z and w into wavelet packet domain. Then, calculate z and w to build the variance trees T z and T w , respectively. Because clean speech and noises are independent, subtract T w from T z node-by-node, and calculate the eigen-decomposition of clean speech by transforming the subtraction of the variance tree with AKLT[Reference Yang and Wang7].
Let $\tilde{\bf R}_{y} = {\bf U}_{y} {\bf \Lambda}_{y} {\bf U}_{y}^{H}$
denote the eigen-decomposition. Finally, let M be the number of eigenvalue of
$\tilde{\bf R}_{y} = {\bf U}_{y} {\bf \Lambda}_{y} {\bf U}_{y}^{H}$
denote the eigen-decomposition. Finally, let M be the number of eigenvalue of $\tilde{\bf R}_{y}$
greater than zero. Let
$\tilde{\bf R}_{y}$
greater than zero. Let ${\bf U}_{y} = \lsqb {\bf U}_{1}, {\bf U}_{2} \rsqb $
, where U
1 donates the
${\bf U}_{y} = \lsqb {\bf U}_{1}, {\bf U}_{2} \rsqb $
, where U
1 donates the $K\,{\times}\,M$
matrix of eigenvectors with positive eigenvalues,
$K\,{\times}\,M$
matrix of eigenvectors with positive eigenvalues,
 $${\bf U}_1 = \{u_{yk} \vert \lambda_y \lpar k \rpar \gt 0 \}.$$
Let ${\bf z}^{T} = {\bf U}_{y}^{H} {\bf z} = {\bf U}_{y}^{H} {\bf y} + {\bf U}_{y}^{H} {\bf w} = {\bf y}^{T} + {\bf w}^{T}$
. The covariance matrix
${\bf z}^{T} = {\bf U}_{y}^{H} {\bf z} = {\bf U}_{y}^{H} {\bf y} + {\bf U}_{y}^{H} {\bf w} = {\bf y}^{T} + {\bf w}^{T}$
. The covariance matrix ${\bf R}_{w^{T}}$
of w
T
is
${\bf R}_{w^{T}}$
of w
T
is ${\bf U}_{y}^{H} {\bf R}_{w} {\bf U}_{y}$
. Let
${\bf U}_{y}^{H} {\bf R}_{w} {\bf U}_{y}$
. Let $\sigma_{wT}^{2} (k)$
be the kth diagonal element of
$\sigma_{wT}^{2} (k)$
be the kth diagonal element of ${\bf R}_{w_{T}}$
. The obtained estimate of
${\bf R}_{w_{T}}$
. The obtained estimate of $\tilde{\bf y}$
is
$\tilde{\bf y}$
is
 $$\tilde{\bf y} = {\bf Hz}, {\bf H} = {\bf U}_y {\bf QU}_y^H,$$
where Q is a diagonal matrix.
 $${\bf Q} = diag \lpar q_{kk} \rpar , q_{kk} = \left\{\matrix{a_k^{1/2}, \hfill &k = 1,2, \ldots, M \hfill \cr 0, \hfill &\hbox{otherwise}, \hfill} \right.$$
and
 $$a_k = \left\{\matrix{\exp \left({-v\sigma_{wT}^2 \lpar k \rpar \over \lambda_y \lpar k \rpar} \right), \hfill & {k = 1, 2, \ldots, M} \hfill \cr 0, \hfill &\hbox{otherwise}, \hfill} \right.$$
where v (=0.5) is a predetermined constant.
The assumptions are that the noise is stationary and that the pure noise vector w is known. The pure noise vector w can be obtained from the noise only frame.
VI. EVALUATING THE PERFOMANCE BY EXPERIMENTS
In this section, we evaluate the performance in accuracy and efficiency of the proposed QBS-CBMR system.
A) Experimental data and measures
The database consists of 200 songs of various languages: 44 in Chinese, 51 in English, and 105 in Japanese. A total of 110 songs of the database are sung by male artists, 62 are by female artists, and the remaining 28 is a choral. In all, 67 different artists are involved and the songs are of various tempos and lengths so that the database is as diversified as possible. All songs in our database are sampled in 22 050 Hz and 8 bits-per-sample.
The proposed system is implemented with Java SE7, and the experiments are run on Windows 8.1, with a 3.4 GHz i7−3770 CPU, and a RAM of 4 GB.
The performance was measured in terms of Accuracy, which was calculated as follows:
 $$\hbox{A}ccuracy = {\sum\nolimits_{i=0}^N R(i) \over N},$$
where N is the total number of tests. In each test, R(i) returns 1 or 0 depending on whether a given music clip can or cannot be searched in the top n ranking, respectively. Therefore, different Accuracy rankings are calculated with different n.
Table 3 shows the results obtained when using this method to compute accuracy. The first row is the name of input music clips. When n=2, there are two correct results of music retrieval that can be found in all four songs. Hence, the Accuracy is 50%.
Table 3. The example of how to calculate accuracy.

Twenty songs were randomly chosen from the 100 songs in the database. In the prelude song, there are usually no obvious changes, until the chorus. Therefore, accuracy is higher when using music clips from the chorus than when using music clips from the prelude song. Music clips from the chorus are used in this experiment.
The database contains N songs and M music clips. Each music clip is of t seconds. We test the total amount of the songs within the top n ranks among M search keys (M≤N). In the following experiments, we set N=200, M=20, and t=20±1 s.
B) Experimental results
The system, which uses the AFPI tree and the Fusion of AFPI and Alignment (FAA) tree without entropy-weighting mechanism is selected to be the baseline system [Reference Huang2]. Figure 10 shows the comparison of the proposed system and the baseline system. The experimental results show that the proposed method with entropy-weighting outperforms the baseline system.

Fig. 10. Comparison of the proposed system and baseline system.
The first experiment shows that using AFPI with entropy weighting is better than using only AFPI or FAA. The proposed music retrieval system uses the AFPI method for the database and the entropy-weighting summation mechanism for determining the final ranking, while [Reference Huang2] claims that the FAA method performs better than using AFPI only, since the methods used in the music retrieval processes are different. The first experiment compared the accuracy of the methods with and without AFPI and FAA and determined whether or not entropy-weighting should be used in the summation mechanism for the final result.
The second experiment used MFCCs and Chroma as features for music retrieval. Every music clip is an interception of the chorus part in 20 s. Figure 11 shows the comparison between different dimensions of features. The result about the second experiment is that the accuracy of using MFCCs and Chroma features is obviously better than only use MFCCs feature.
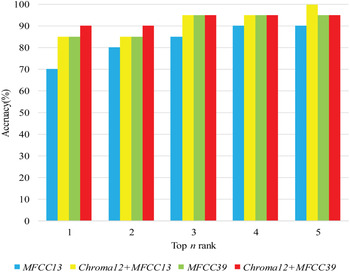
Fig. 11. Comparison between different dimensions of features.
In the third experiment, 5 db white noise and pink noise was added to each music clip, and AKLT was used to exclude the effect of noise. Figure 12 shows the result of noisy and enhanced music clips in music retrieval. The feature is as same as the previous experiments, MFCCs and Chroma features. It is clear to find that after using AKLT to enhance the music clips, the music retrieval result is better than without using AKLT.

Fig. 12. Comparison between noised music clips and enhanced music clips.
VII. CONCLUSION
The robust QBS music retrieval system proposed in this study first converts the 51-dimensional features, which include MFCCs and Chroma features, into symbolic sequences by applying adapted SAX methods. The symbolic sequence is then used to construct the AFPI tree. Finally, the entropy-weighting mechanism is proposed to determine the final ranking. Noise effects are further reduced by applying AKLT preprocessing. The experimental results show that the proposed QBS-CBMR system outperforms the baseline system. Future studies will optimize the parameters of the proposed method such as the length of symbolic sequence and the dimension of the PAA representation. Moreover, a large database will be used to demonstrate the efficiency of the system.
ACKNOWLEDGEMENT
This research was supported in part by Ministry of Science and Technology, Taiwan, R.O.C., under Grant MOST 104-2218-E-126-004.
Yuan-Shan Lee received his M.S. degree in Applied Mathematics from National Dong Hwa University, Hualien, Taiwan, in 2013, and he is presently working toward the Ph.D. degree in Computer Science and Information Engineering in National Central University, Taoyuan, Taiwan. His current research interests include machine learning, blind source separation, neural network, and signal processing.
Yen-Lin Chiang received his B.S. degree in Computer Science from National Central University, Taiwan, in 2015. He is presently pursuing his M.S. degree at National Tsing Hua University, Taiwan. His general researches include machine learning and pattern recognition for multimedia processing.
Pei-Rung Lin is presently working toward the B.S. degree at National Central University, Taiwan. Her recent work has been in the areas of music retrieval and score following. Her general researches include machine learning and pattern recognition.
Chang-Hung Lin received his B.S. degree in Computer Science and Information Engineering from National Central University, Taoyuan, Taiwan. His general research interests include singing evaluation for karaoke applications, machine learning, and pattern recognition.
Tzu-Chiang Tai received his M.S. and Ph.D. degrees in Electrical Engineering from National Cheng Kung University, Tainan, Taiwan, in 1997 and 2010, respectively. He was with Philips Semiconductors and United Microelectronics Corporation (UMC) from 1999 to 2003. Presently, he is an Assistant Professor in the Department of Computer Science and Information Engineering, Providence University, Taichung, Taiwan. His research interests include signal processing, reconfigurable computing, VLSI design automation, and VLSI architecture design.


 Open access