


Introduction
During the 1957–58 International Geophysical Year (IGY), the Russian Academy of Sciences conducted extensive glaciological research in the Suntar–Khayata range in eastern Siberia (Fig. 1) and identified nearly 200 glaciers (Reference KoreishaKoreisha, 1963). Detailed observations were made of Glacier No. 31, where a meteorological station was constructed and various glaciological data were collected from 1956 to 1958. After the IGY, however, few follow-up observations were conducted, with the exception of aerial photographs and satellite images.

Fig. 1. Location of the Suntar–Khayata range.
In the summer of 2001, Reference YamadaYamada and others (2002) made a reconnaissance observation of Glacier No. 31 (Fig. 2). They determined that this glacier was unsuitable for an ice-core study because the surface was covered with a water-saturated firn in the accumulation zone and meltwater percolation could disturb chemical and isotopic signals. In addition, drill work was difficult because of frequent drill stacking caused by freezing in the cold, subsurface ice.

Fig. 2. Glacier No. 31 in the Suntar–Khayata range. The terminal and side moraines are shown clearly. The photograph was taken from a helicopter with the camera pointing southeastward on 28 July 2001.
In 2004 and 2005, Reference Takahashi, Kameda, Sugiura, Ananicheva and KononovTakahashi and others (2006) collected meteorological and glaciological observations in this area as part of the International Polar Year (IPY). Meteorological instruments were installed at the former IGY station, the terminus of Glacier No. 31 (Fig. 3), and several points around Oymyakon.

Fig. 3. Measurement site in the Glacier No. 31 area. G0 is at the terminus of Glacier No. 31. G2 and G1 are on a slope to the riverside. G3 is at the former IGY meteorological station. (Image obtained from Google Map.)
During 2006–07, 15 thermometers were set along the 800 km long Kolima road from Magadan to Oymyakon to investigate the temperature distribution for 1 year from the coast to the Kolima and river Indigirka inland drainage basin.
Observations Around Suntar–Khayata
From August 2004 to August 2005, we placed meteorological instruments in the basin around Oymyakon and near the terminus of Glacier No. 31. We installed a Pt100 sensor for temperature (Kadec-US), a YOUNG aero-vane monitor for wind speed and direction (Kona-Kaze System) and a pyranometer for solar radiation (Eiko-PCM-01L recorded by Kadec-21UP) at Oymyakon (63˚27'41.5" N, 142˚46’32.1" E; 677ma.s.l.). Another 12 thermometers, including a recorder with a thermistor sensor (T&D, TR-52), were installed along a 30 km road from Oymyakon southwest to Tomtor (63˚15’46.2" N, 143˚12'29.2" E; 776ma.s.l.). At the abandoned and collapsed IGY meteorological station (62˚37’28.7" N, 140˚48’35.6" E; 2043ma.s.l.), 135 km southwest of Oymyakon and 2.2 km northwest of the glacier terminus, we installed instruments to record temperature (TR-52), wind speed and direction (Kona-Kaze), solar radiation (Eiko-PCM-01L and Kadec-21UP) and snow depth data (collected by taking photographs of a stake using an interval digital camera; Kadec-Eye, Kona System). One thermometer was placed at the glacier terminus (62˚36’46.9" N, 140˚50’37.4" E; 1988ma.s.l.), and two were placed on the slope between the terminus and the former station.
Figure 4 shows T 0, the temperature at Oymyakon (677ma.s.l.); T G, the temperature at the terminus of Glacier No. 31 (1988ma.s.l.); and their difference, dT = T G – T 0. The minimum temperature in the 2004/05 winter was –59.2˚C at Oymyakon and –40.8˚C at the glacier terminus, suggesting a strong temperature inversion. The temperature difference, dT, was >20˚C in December and January and 10˚C from November to March. Considering the potential temperature difference that exists between elevations 1311 m apart, the atmosphere was thermally neutral at dT = –12.8˚C. The strong atmospheric stable condition, dT > 0˚C, continued from the end of October to the beginning of April.

Fig. 4. Temperature at Oymyakon (677ma.s.l.), T 0, and at the terminus of Glacier No. 31 (1988ma.s.l.), T G, and the difference, dT (T 0 – T G).
The Siberian high (SH), which covers the Irkutsk area in central Siberia near Lake Baikal, is the main cause of this long period of stability (Reference Panagiotopoulos, Shahgedanova, Stephenson and HannachiPanagiotopoulos and others, 2005). During 1900–2000, the average winter pressure was >1030 and 1025 hPa at the center of the SH and in the Suntar–Khayata area, respectively. Therefore, the SH contributed to the atmospheric stability causing the strong, continuous temperature inversion around Oymyakon and Suntar–Khayata.
To observe the change in snow depth and estimate snow accumulation, stakes in the snow were photographed every 3 hours (Fig. 5). The data indicated that the snow accumulation period was from 3 September 2004 to 27 June 2005, with a maximum snow accumulation of 72 cm on 11 May 2005. Snowfall occurred in September and October, at the beginning of winter, and in April and May, at the end of winter. Little snowfall occurred from November to March, in midwinter. This is a common pattern in inland areas with a strong SH. The high stability in mid-winter prevents atmospheric disturbances, and the water vapor required for snowfall is limited to the beginning and end of winter.

Fig. 5. Snow depth observed using an interval camera. An example of the images captured by the camera is shown in the inset. The snow-covered period was between 3 September 2004 and 27 June 2005, and the maximum accumulation (72 cm) occurred on 11 May 2005.
From August 2006 to September 2007, we measured air temperature along the 1000 km long Kolima road between Magadan and Oymyakon. Thermometers were placed along the road at 100 km intervals from August 2006 to September 2007 (Fig. 6). The thermometers (T&D, TR-52) were set ~1.5m above the ground surface and data were recorded every hour. The minimum temperatures along the road are given in Figure 6.

Fig. 6. The minimum temperatures recorded from Magadan to Oymyakon. The letters denote the geographic setting of the thermometer sites: [P] indicates a plain, [H] a hill, [V] a valley and [Sea] the seashore.
The lowest minimum temperature recorded along the road was –59.7˚C at Oymyakon, and the isotherm below –50˚C extended at least 300 km eastward from Oymyakon, which is covered by the SH. The minimum temperatures were higher near the coast; Magadan, on the Sea of Okhotsk, recorded –23.2˚C.
According to the 2006/07 winter-temperature records, the lowest temperatures in the study area were at Oymyakon, where temperatures were below –50˚C from December to February. However, the summer temperatures in Oymyakon were generally higher than those at Magadan, indicating the Oymyakon area has a typical inland climate.
Glacier Retreat
The Suntar–Khayata range divides the Sea of Okhotsk and Arctic Ocean drainage basins. Its recent glaciation is among the most extensive in northeast Asia. There are ~200 glaciers covering up to 210 km2 at elevations above 2000 m (Reference KoreishaKoreisha, 1963). They are grouped into three main massifs: the northern, central and southern massifs, with glacier covers of 90, 50 and 65 km2, respectively. Figure 7 shows aerial photographs of the glaciers in Suntar–Khayata taken from a helicopter in 2005.

Fig. 7. Glaciers in Suntar–Khayata.
The 1945 USSR glacier inventory, based on an aerial photograph survey (Reference Golodkovskaya and KoreyshaGolodkovskaya and Koreysha, 1977), is the major source of information on historical glaciation. In addition, M.M. Koreisha explored these glaciers as part of the IGY activities in 1957–59, providing information on glacial areas (Reference KoreishaKoreisha, 1963), and in 1970 the Institute of Geography, Russian Academy of Sciences, conducted an expedition to survey of some of the glaciers.
To determine the recent glacier distribution, satellite images from 2003 were obtained and analyzed. Data from 1945, 1970 and 2003 were used to estimate changes in glacier area and length.
In 2003, Suntar–Khayata was estimated to have 162.2 km2 glacier cover, of which 155.5 km2 was identified from Landsat images and 6.7 km2 was estimated proportionally from the whole glacier area, based on the 1970s and 1980s USSR glacier inventories and the area covered by the satellite images. In 2003, the glaciated area had decreased by 37.2 km2 from the 1945 USSR inventory result of 199.4 km2, a 19.3% reduction (Table 1).
Table 1. Glacier area reduction in Suntar–Khayata from 1945 to 2003
Reference Ananicheva, Koreisha and TakahashiAnanicheva and others (2005) investigated glacier retreat in the Suntar–Khayata range using the distance between the glacier terminus and the end of terminal moraine during the Little Ice Age (LIA). They estimated the shrink length from the LIA to 1973 to be 50–150m in the northern massif, (Glacier Nos. 2–31), and 100–200m in the southern massif (Glacier Nos. 141–154) (Fig. 8). Because the glaciers in the southern massif are bigger and subject to higher temperatures and heavier precipitation, they shrink more readily than the northern massif glaciers.

Fig. 8. Glacier retreat in the northern and southern massifs in the Suntar–Khayata range. The upper part of the bar represents glacier length in 1973, the middle part represents glacier retreat from 1945 to 1973 and the lower part represents retreat from the LIA to 1973, estimated by moraine location. (From Reference Ananicheva, Koreisha and TakahashiAnanicheva and others, 2005.)
Reference SolominaSolomina (2000) analyzed aerial photographs of ~1000 glaciers in former Soviet Union mountain ranges from the Caucasus to Kamchatka, including Suntar–Khayata, to examine glacier retreat since the LIA maximum. He measured the length of the LIA moraines to obtain the length change, dL, and elevation change, dH, of the glacier terminus. In Suntar–Khayata, the average dL was 259m and dH was 55 m. In general, the glacier shrinkage of dL and dH in continental Siberia (Suntar–Khayata, Cherskiy range and Kodar) was much smaller than that in central Asia (Caucasus, Pamir-Alai, Tien Shan and Altai) and along the Pacific margins (Koryakskoye Nagorye and Kamchatka). However, the average relative change dL/L (L the glacier length) was not so different, ~0.2–0.3 except for Koryakskoye Nagorye (0.5–0.6). The reason that Suntar–Khayata has smaller dL and dH but almost the same dL/L is because the glaciers in Suntar–Khayata are not as long; the elevation of the range is <2900m and the glaciers exist in a narrow elevation range between 2000 and 2800 m.
Glacier Sensitivity To Climate Change
Glacier No. 31 in the Suntar–Khayata range is located at 62˚36’ N, 140˚51’ E at elevations between 2000 and 2600 m (Reference SolominaFig. 9). According to the World atlas of snow and ice resources (Reference KotlyakovInstitut Geografii RAN, 1997), the equilibrium-line altitude (ELA), where the annual accumulation equals ablation, is ~2300m in this area. We assumed the present ELA of Glacier No. 31 was ~2350 m, where the area of the upper part is equal to that of the lower part. Reference Ananicheva, Krenke and HannaAnanicheva and others (2008, Reference Ananicheva, Krenke and Barry2010) adopted an ELA of 2350m for their estimate of ELA change. To understand the glacier response to climate change, we assessed the relationship between ELA variation and changes in meteorological conditions.

Fig. 9. Glacier No. 31 in Suntar–Khayata.
We used the US National Centers for Environmental Prediction (NCEP) reanalysis data to examine meteorological changes in Suntar–Khayata. The NCEP dataset has 2.5˚ latitudinal and longitudinal resolutions. We selected the nearest gridpoint to Glacier No. 31, 62.5˚ N, 140˚ E, and used the monthly average temperature and precipitation at 850 hPa for that point during 1950–2009. The temperature at any elevation necessary for the ELA estimate was obtained using a lapse rate of 6.5˚Ckm–1. The annual mean temperature during 1950–2009 at the assumed ELA of 2350m is shown in Figure 10. The temperature increase estimated from the regression line of the data is ~1.9˚C over 60 years.

Fig. 10. The mean annual temperature at 2350 ma.s.l. from 1950 to 2009 based on NCEP data.
To understand the ELA response to increasing temperature, we made two assumptions when estimating the glacier surface mass balance. First, we assumed that the ablation season was equal to the period of positive temperature. Given that ablation begins near, but not exactly at, 0˚C, ablation can be estimated roughly from degree-day, or the accumulation of positive daily temperatures, with an empirical degree-day coefficient. Second, we assumed that the snow-accumulation season equalled the period of negative temperature. Snow can fall when the ground temperature is >0˚C, sometimes at 2 or 3˚C (Reference Ageta and HiguchiAgeta and Higuchi, 1984), but this snow melts and does not contribute significantly to snow accumulation. Although the border temperature between the ablation and accumulation season is not exactly 0˚C, we were primarily interested in the ELA response to rising temperatures, so it did not need to be precise.
Figure 11 presents the monthly mean temperature and precipitation from the NCEP data at 2350m in 2004 and 2005; at this elevation, the ablation season is short, whereas the accumulation season is long. In winter, precipitation is very low, almost zero, which agrees with the 2004/05 observations (Reference Golodkovskaya and KoreyshaFig. 5). Additionally, Figure 11 indicates high snow precipitation at the beginning and end of winter (September and May).
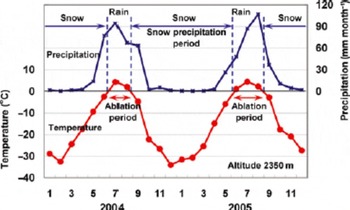
Fig. 11. The monthly mean temperature and precipitation at 2350ma.s.l. based on NCEP data.
Precipitation on days with negative temperatures, assumed to be snow precipitation, for each year is shown in Figure 12. The average precipitation was ~150mm a–1, decreasing at a rate of ~15mm a–1 over 60 years, reflecting shortening snow precipitation periods due to increasing temperatures.

Fig. 12. Annual snow precipitation and ablation at 2350ma.s.l. from 1950 to 2009.
Assuming that ablation is proportional to positive air temperature, ablation was estimated from the sum of positive degree-days. The degree-day factor, a coefficient between ablation and positive degree-days, for the estimation was adjusted to balance with snow precipitation at 2350 m (157mm a–1), which was 1.96×10⁻²mm˚C–1 d–1 (Fig. 12). The mean ablation over the study period averaged ~15mma–1; this value increased by ~40mm over the 60 year period due to rising temperatures. Therefore, snow precipitation and ablation varied with temperature change. We calculated the 60 year snow precipitation and ablation average at all elevations from 1400 to 3000 m.
Figure 13 shows the vertical profiles of the surface mass balance based on present temperature conditions and on profiles in which average temperatures are higher by 1, 2 and 3˚C. The elevation at which precipitation and ablation are equal is the ELA. The ELA is ~2350m at present and increases by ~150m for a 1˚C temperature increase.

Fig. 13. Vertical profiles of snow precipitation (SP) and ablation (AB). The present average condition is 0; 1, 2 and 3 are the conditions in which temperature is increased by 1, 2 and 3˚C, respectively. The circles indicate the ELAs.
According to this temperature dependence, when the temperature increases by 1.8˚C the ELA increases to ~2600 m, the top of the glacier ridge, causing the accumulation zone of Glacier No. 31 to disappear and the glacier to gradually retreat. Although no exact glacier depth data or bed maps were available, we estimated surface lowering assuming the maximum depth of the glacier body was 150 m and that glacier flow was negligible under the condition that there was no accumulation zone. Using this rough approximation, the glacier volume would decrease to ~50% and 20% after 400 and 1000 years, respectively (Fig. 14).

Fig. 14. Surface lowering of Glacier No. 31 if the ELA rises to 2600ma.s.l.
Reference Ananicheva, Krenke and HannaAnanicheva and others (2008, Reference Ananicheva, Krenke and Barry2010) made vertical profiles of mass balance (accumulation and ablation) and estimated ELA and glacier area changes, in which they assumed precipitation did not change with increasing temperature. If precipitation is constant, the ELA increase for a 1˚C rise is 100 m, according to Figure 13, while by our method with changing precipitation it was 150 m. Thus change of precipitation with temperature change increases ELA sensitivity to temperature.
Concluding Remarks
In the Suntar–Khayata area, a strong temperature inversion remains throughout the winter. The temperature in the flat plain of Oymyakon, at ~700ma.s.l., was ~20˚C colder than in the glaciated area at ~2000ma.s.l., and the atmosphere was much more stable from October to April due to the Siberian high.
Snowfall was limited to the beginning and end of winter, with almost none in midwinter because atmospheric disturbances are inhibited by the stability of the SH.
From 1945 to 2003, the glaciated area of the Suntar– Khayata range decreased by 37.2 km2, a 19.3% reduction. To assess this retreat, we estimated the glacier response to climate change. According to NCEP data, the temperature increased by ~1.9˚C over 60 years. Using the calculated snow precipitation and ablation rates, the sensitivity of the ELA to temperature change was evaluated. We estimated snow precipitation as precipitation below 0˚C and the ablation level using the degree-day method, which showed that the degree-day coefficient, adjusted to balance annual ablation with annual snow precipitation at the ELA, was 1.96×10⁻² for Glacier No. 31. Based on these estimates, the ELA of Glacier No. 31 could increase by ~150m with a temperature increase of 1˚C; with a long-term temperature rise of 1.8˚C, Glacier No. 31 could lose its accumulation area, leading to a glacier body volume decrease of 50% after 400 years.
Acknowledgements
We thank M. Koreisha of the Research Institute on Engineering Investigations in the Building Industry (PNIIIS) for his pioneering work at Suntar–Khayata and his assistance. We also thank A.N. Krenke for his valuable comments and our referee for valuable suggestions that improved the manuscript. We further thank D.R. MacAyeal (the issue chief editor) for help in revising the manuscript. This study was supported by a Grant-in-Aid for International Scientific Research (No. 16403006; principal investigator S. Takahashi) of the Ministry of Education, Culture, Sports, Science and Technology of Japan.


