


1. Introduction
Rice is an important staple crop for almost half of the world’s population (Hoang and Meyers, Reference Hoang and Meyers2015), and is particularly important for Asian countries where 90% of rice is grown and consumed (Kim and Andres Ramirez, Reference Kim and Andres Ramirez2014; Ricepedia, 2020). For instance, in Southeast Asia, almost one-third of daily calories come from rice (Glamalva and Weaver, Reference Glamalva and Weaver2015). This dependency on rice for calories will continue because world rice consumption is projected to increase by 5.5% by 2028 (USDA, 2019).
For various reasons, including self-sufficiency policies that restrict imports and support domestic production, rice is largely produced and consumed within a given country. As a result, the international rice market is thinly traded. Although the portion of rice traded internationally to total production has increased in the last several decades (9.0% in 2019, relative to 6.9% in 2009 and 5.6% in 1999),Footnote 1 rice trade remains thin relative to other staple agricultural commodities (USDA, 2020). For instance, for soybeans, wheat, and corn, 44.8%, 24.3%, and 15.1% of total production was traded between 2017 and 2019, respectively (USDA, 2020). Consequently, international rice prices fluctuate greatly with supply shocks due to biotic or abiotic stresses or trade restrictions by rice-exporting countries.
With international rice trade expanding, understanding how importing countries respond to exchange rate fluctuations is increasingly important. Rice-importing countries are concerned that rice exporters influence international and domestic prices through government programs, such as producer price guarantees. These government interventions can destabilize the thinly traded international rice market because of the heavy costs involved, misallocation of scarce resources, exchange rate manipulation, market distortions, attempts to restabilize prices, and increases in international rice price volatility (John, Reference John2013).
Governments of many Asian countries focus on rice price stability because of the impact prices have on self-sufficiency, food security, and political stability. To cushion against international price volatility, rice-importing countries, such as Malaysia, Indonesia, and the Philippines, are working toward self-sufficiency in rice production (Clarete, Lourdes, and Esteban, Reference Clarete, Lourdes and Esteban2013). With rice deeply engrained in Southeast Asian culture, consumers have strong preferences for rice and differentiate by processing, length, type, variety, origin, and brand (Glamalva and Weaver, Reference Glamalva and Weaver2015). These strong preferences, together with rice being a staple food, result in inelastic demands. Consequently, when rice prices are high, consumption of other foods high in protein, vitamins, and minerals are often reduced due to decreased purchasing power. High rice prices can have major consequences for food security, primarily among poor households in developing countries in Asia that are net consumers of rice (Gustafson, Reference Gustafson2013). Therefore, governments in Southeast Asia have concluded that price stability acts as an important safety net for society (Dawe, Reference Dawe2002). As a result, the rice industry in many Southeast Asian countries has been highly regulated to achieve domestic price stability and self-sufficiency (Omar, Shaharudin, and Tumin, Reference Omar, Shaharudin and Tumin2019).
Due to concerns of unfair practices in the international market, many rice-importing countries have opted to create a state trading enterprise (STE) or agency. STEs can help achieve price stability by increasing prices for producers or lowering prices for consumers, or both in the case of price stabilization (Dawe, Reference Dawe2000). For example, Dawe (Reference Dawe2000) found evidence that Thailand and Malaysia have successfully stabilized their domestic rice price relative to the world market price.Footnote 2 However, STEs failed to rein in rice prices during the 2008 rice crisis, as world rice prices hit record highs (Lee and Valera, Reference Lee and Valera2016). In the Southeast Asian rice trade, governments bestow complete control of rice imports to STEs. The objectives of STEs often differ from profit-maximizing trade agents. Some of these alternative objectives include food security, farmer support, political stability, self-sufficiency, and/or maintaining cultural norms. Consequently, STEs do not optimize returns to exchange rate fluctuations, causing a violation of the law of one price (LOP).Footnote 3 Given the highly volatile nature of exchange rates, we analyze the impact of exchange rate fluctuations on the behaviors of STEs.
The literature analyzing exchange rate pass-through in food and agriculture is limited, particularly for the rice trade in Asia. There is extended literature on exchange rate pass-through for nonagricultural commodities such as crude oil.Footnote 4 Within agriculture, Pompelli and Pick (Reference Pompelli and Pick1990) analyze pass-through of exchange rates and per unit tariffs in noncompetitive tobacco markets and show that prices do not fully pass-through. Miljkovic, Brester, and Marsh (Reference Miljkovic, Brester and Marsh2003) find incomplete exchange rate pass-through in US meat exports. However, their results do not reveal the cause of the price distortion. Miljkovic and Zhuang (Reference Miljkovic and Zhuang2011) use meat-weighted exchange rates to estimate pass-through in US meat exports to Japan. Their results show poultry and beef have partial pass-through (i.e., domestic price to exchange rate elasticities are less than one), whereas pork has zero pass-through (i.e., domestic prices do not respond to exchange rate variation) in exchange rates. To the best of our knowledge, Yumkella et al. (Reference Yumkella, Unnevehr and Garcia1994) is the most recent study analyzing exchange rate pass-through in Thai rice markets. The authors implement a price-to-market trade model with unit price as the dependent variable and exchange rates, time, and country fixed effects as independent variables. The results show evidence of noncompetitive rice prices and imperfect pass-through of the exchange rate. Our model builds on this analysis by decomposing exchange rate volatility into appreciation and depreciation, considers the impact of national income on the rice trade, and includes the dynamic nature of trade through lagged dependent and independent variables.
The literature analyzing asymmetrical exchange rate pass-through in food and agriculture is expanding. Ardeni (Reference Ardeni1989) uses cointegration to test the LOP, and argues exchange rates should be considered in international trade analysis to see if purchasing parities hold. For a wide range of agricultural goods, the results suggest the LOP does not hold (Ardeni, Reference Ardeni1989). Fedoseeva (Reference Fedoseeva2014) concludes that exchange rate nonlinearities are more common in food and agriculture trade than nonfood trade flows when studying food exports from Europe to the United States of America. Fousekis and Trachanas (Reference Fousekis and Trachanas2016) study asymmetrical, spatial price linkages in skimmed milk powder markets in trade between the United States of America, the European Union, and Oceania with a nonlinear autoregressive distributed lag (NARDL) model. In a follow-up paper, Fedoseeva (Reference Fedoseeva2016) finds that European export quantities are impacted less by exchange rate changes than export values.
Co-movement of rice prices via price transmission methods has been studied in Southeast Asia. For example, Alam et al. (Reference Alam, Buysse, McKenzie, Begum, Wailes and Van Huylenbroeck2012) utilize a multivariate cointegration test and an error correction model to show a dynamic equilibrium between the domestic Bangladeshi and world rice price exists. John (Reference John2013) utilizes a vector autoregression model to analyze if domestic price shocks impact the international price and if international price shocks impact domestic prices. The results show that international price shocks impact domestic prices only in the long run. Consequently, Thailand’s rice policies do not heavily distort the international market. Chen and Saghaian (Reference Chen and Saghaian2016) analyze the world rice export markets using a threshold vector error correction model; their results reveal that rice export prices for the United States of America, Thailand, and Vietnam are cointegrated, with the first two countries being the price leaders. Lee and Valera (Reference Lee and Valera2016) implement a panel GARCH framework and show that price shocks in the Asian rice market transmit to domestic rice prices and also impact conditional price variances. The results also indicate strong interdependence between Asian rice trading countries. Sirikanchanarak et al. (Reference Sirikanchanarak, Liu, Sriboonchitta, Xie, Huynh, Kreinovich and Sriboonchitta2016) utilize time-varying copulas and VAR models to analyze price transmission for Thailand and Vietnam rice export prices. The results provide evidence that these two countries’ export prices move together, but Vietnam is likely the price leader. Pede et al. (Reference Pede, Barboza, Valera, McKinley, McKenzie and Alam2018) use linear processes or nonlinear smooth transition autoregressive to study the dynamic relationship between farm gate, wholesale, and retail prices in 16 regions in the Philippines. Alam et al. (Reference Alam, McKenzie, Begum, Buysse, Wailes and Van Huylenbroeck2016) implement cointegration tests and an asymmetric error correction model to show that wholesale and retail prices are in long-run equilibrium with the wholesale market dominating the retail market. Our analysis is unique because it analyzes the impact of exchange rate volatility in the Southeast Asian rice trade with asymmetric exchange rates.
This paper relates to the asymmetrical exchange-rate pass-through work of Luckstead (Reference Luckstead2018) and Anders and Fedoseeva (Reference Anders and Fedoseeva2017), who use a NARDL model to study cocoa and coffee markets, respectively. Their results show that when appreciation and depreciation are explicitly separated, substantial nonlinearities exist in how importers of these commodities respond to exchange rate volatility.
This paper utilizes a NARDL model to examine the impact of exchange rate fluctuations on rice trade flows in Asia.Footnote 5 Because the Southeast Asian importing countries included in this study manage rice imports through STEs, this analysis will provide insight as to whether these agencies respond to exchange rate fluctuations in a manner consistent with profit-maximizing firms—appreciation (depreciation) of an importers’ currency results in imports rising (falling). While currency appreciation (depreciation) can cause deflation (inflation), reducing (expanding) imports when the currency depreciates (appreciates) will dampen (increase) the inflationary pressures (Stone et al., Reference Stone, Roger, Shimizu, Nordstrom, Kisinbay and Restrepo2009). Behavior inconsistent with these expectations could provide evidence of stabilizing domestic prices or import restriction policies.
This analysis focuses on the main Asian importers (Malaysia, Indonesia, the Philippines, and China) of rice by volume from Thailand. In addition to being the largest rice exporter, the Thailand Ministry of Commerce also releases reliable high-quality trade data.Footnote 6 Top rice-importing countries in Southeast AsiaFootnote 7 include Malaysia, Indonesia, and the Philippines. Together, these three countries accounted for 97% of rice imports in Southeast Asia between 2002 and 2018 (FAS, 2020). While not part of Southeast Asia, China is a large rice importer and is included in the analysis for comparison. Malaysia imported a total value of $1.2 billion in rice (harmonized system (HS) code 1006) over the 3 years between 2017 and 2019. Of Malaysia’s total imports, 37.3% or 0.45 billion came from Thailand. For Indonesia and China, Thailand accounted 35.6% and 29.9% of the total rice imports ($1.36 billion and $4.68 billion) over this period. Therefore, our analysis includes Malaysian, Indonesian, the Philippines, and Chinese rice imports from Thailand.
2. State Trading Enterprises in Southeast Asian Rice Markets
In Southeast Asian rice trade, governments typically control imports and exports through STEs. Asian governments are concerned with domestic price stability and its impact on self-sufficiency, food security, and political stability. STEs allow these governments more control over price fluctuations and to advance goals other than profit maximization (McCorriston and MacLaren, Reference McCorriston and MacLaren2012). Along this line, trade liberalization in rice is a non-starter and omitted from trade negotiations. As a result, STEs are granted exclusion from trade agreements by the World Trade Organization (WTO) and are allowed to solely negotiate rice trade (Glamalva and Weaver, Reference Glamalva and Weaver2015). As a result, STEs offer governments more control in using trade to achieve domestic policies. For importing markets, STEs limit market access by implicitly imposing tariff equivalents, import bans, and quantity restrictions. Given the dominance of STEs in Southeast Asian rice trade, we discuss rice trade, STE, and currency regimes for the three countries (Thailand, Malaysia, Indonesia, the Philippines, and China) analyzed in this study.
2.1. Thailand
Thailand is one of the largest rice-producing and rice-exporting countries, and rice plays an important role in the Thai economy. About 50%, or 27.7 million acres, of all agricultural land in Thailand is used for rice production. As a result, rice contributed 15% to the agricultural gross domestic product (GDP) in 2018. While Thailand ranks sixth in the world in rice production, domestic consumption accounts for less than 50% of total rice production (Ahmad and Gjølberg, Reference Ahmad and Gjølberg2015). With production greatly outweighing consumption, Thailand is the leading rice exporter.
Thailand has long tried to control the world rice market. In 2002 and 2012, Thailand failed to establish a cartel with other rice exporters to control rice prices (Chen and Saghaian, Reference Chen and Saghaian2016). Based on the assumption that the international rice price would follow the Thai rice price, Thailand again tried to exert control on the price of rice with the Paddy Pledge Program (PPP) implemented between 2011 and 2014. However, the high farm-gate price guaranteed by PPP eroded Thailand’s competitiveness and led to a large stock buildup (Sirikanchanarak, Liu, Sriboonchitta, and Xie, Reference Alam, McKenzie, Begum, Buysse, Wailes and Van Huylenbroeck2016). Currently, Thailand’s STE—Public Warehouse Organization (PWO)—purchases and sells rice to promote the government’s price stabilization policy (PWO, 2020).
Chen and Saghaian (Reference Chen and Saghaian2016) show that Thailand is a major rice exporter, but lacks the ability to fully influence the world market by manipulating the world rice price because of other exporters, such as Vietnam and India.Footnote 8 Ultimately, these three countries prevent each other from monopolizing the rice market. Chen and Saghaian (Reference Chen and Saghaian2016) show that, while cointegration analysis reveals that Thai and Vietnamese rice markets are integrated, Thailand is the price leader.
Since 1897, the Baht has been the official currency of Thailand (WorldAtlas, 2019). In 1997, Thailand moved to a semi-floating exchange rate or managed float exchange rate regime. The exchange rate is allowed to fluctuate, but the Bank of Thailand can make adjustments if imbalances occur (BoT, 2015).
2.2. Malaysia
Malaysia is a net importer of rice. In 2019, rice imports were estimated at 997,903 metric tons (USDA, 2020). Malaysia allows the importation of rice through its STE, Main Market of Burna Malaysia (BERNAS). BERNAS was privatized in 1996 and acts as the legal entity under the direction of the Malaysian government to manage the nation’s rice market. BERNAS purchases rice from farmers, processes it, and also distributes rice subsidies to farmers (Kim and Andres Ramirez, Reference Kim and Andres Ramirez2014). BERNAS is the largest rice miller in Malaysia. Since Malaysia can only supply 60%–70% of its domestic demand, BERNAS is the sole entity that negotiates with foreign governments to import rice to fulfill the excess demand (BERNAS, 2019a). BERNAS is also mandated to perform noncommercial activities for rice importation such as maintaining the supply and affordability of rice. Thus, BERNAS does not have to follow market signals in importing rice. Also, BERNAS has indicated that they only import long-grain milled rice from Thailand (BERNAS, 2019b).
The official currency of Malaysia is the Ringgit. From 1998 through July 21, 2005, the Ringgit was pegged to the US dollar (USD) (USDoS, 2006). However, since July 22, 2005, Malaysia has maintained a floating exchange rate system.
2.3. Indonesia
Indonesia is a major rice importer in Southeast Asia. The National Food Logistics Agency (BULOG) is Indonesia’s STE governing all food logistics (BULOG, 2018b). In 2000, BULOG was assigned to handle inventory, distribution, and price setting for rice (BULOG, 2018c). Setting high farm-gate prices, BULOG encourages farmers to grow more rice to increase supply. BULOG argues the need to manage supply and imports for food security to manage domestic food prices (BULOG, 2018a). Currently, Indonesia encourages private businesses to participate in the local rice market, but still maintains the authority to intervene (WTO, 2018b). Since 2005, BULOG has attempted to become more commercial and move toward deregulation. However, an analysis shows their commercialization efforts resulted in an increase in the tariff equivalent imposed on rice imports from 23% to 56% (McCorriston and MacLaren, Reference McCorriston and MacLaren2012).
The Rupiah has been the official currency of Indonesia since 1946. In the late 1990s, the currency moved from a fixed exchange rate to a free-floating rate (Mitchell, Reference Mitchell2019).
2.4. Philippines
The Philippines is the largest rice-importing country in Southeast Asia with an average of over $600 million in rice imports between 2002 and 2018. While the Philippines is the leading importer, the Philippines imports about 2.4 times more from Vietnam than Thailand (FAOStat, 2021). The National Food Authority (NFA) has had a monopoly on the importation of rice for decades and has been considered as a source of inefficiencies through inappropriate market behavior (Clarete, Reference Clarete2019; Galvez, Reference Galvez2019). However, in 2019, the government of the Philippines passed the Rice Tariffication Law (RTL), which opened the rice market to private traders, and lessened the role of the NFA on rice imports. Under the new RTL, rice is imported primarily by private companies, while the NFA has the authority to manage the public rice stocks and import rice when needed (Balie, Minot, and Valera, Reference Balie, Minot and Valera2020). Since the establishment of the Central Bank of the Philippines in 1993, the Philippine peso has been operating under a fully floating exchange rate system.
2.5. China
China is the leading rice producer and consumer in the world. With consumption generally exceeding production, China imports about 2% of total rice consumption (Glamalva and Weaver, Reference Glamalva and Weaver2015).Footnote 9 The China National Cereals, Oils, and Foodstuffs Corporation (COFCO) was given exclusive rights in 1949 for the rice trade. COFCO’s goals are to secure an adequate supply of food, limit price fluctuations, and ensure food security. Commercial importers can import rice to fill demand, but COFCO determines the import price. China has stressed to the WTO that their STE operates competitively, highlighting that rice imports are determined by domestic supply, domestic and world prices of rice, and “other factors” (WTO, 2018a). With WTO membership, China is starting to allow private firms to trade agricultural commodities, but the state still controls most of the trading activities (McCorriston and MacLaren, Reference McCorriston and MacLaren2012).
The Chinese Yuan was pegged to the USD from 1994 through July 2005, when it became a managed floating currency exchange rate. China manages the exchange rate, determining the exchange rate for USD each day with room to appreciate or depreciate by predetermined amounts (Picardo, Reference Picardo2019). According to Picardo (Reference Picardo2019), China typically undervalues its currency.
In summary, the key Southeast Asian rice-importing countries and China heavily utilize STEs to have broader control on rice trade to advance domestic policy goals, such as encouraging domestic production and maintaining high producer prices. While all countries currently maintain a floating exchange rate, the governments have indicated that they will become involved if imbalances occur.
3. Econometric Model
We define the NARDL model that is implemented to analyze STEs response to exchange rate volatility.Footnote 10 The nonlinear aspect arises from the partial sum decomposition of the log real Thai exchange rate to Local Currency Units (Baht/LCU) for country $k$
(
$k$
( $r_t^k$
):
$r_t^k$
):
 $$r_t^k = r_0^k + r_t^{k - } + r_t^{k + },$$
where $r_0^k$
is the initial value at time
$r_0^k$
is the initial value at time ${t_0}$
, the
${t_0}$
, the $k$
superscript represents importing country
$k$
superscript represents importing country $k = Malaysia, Indonesia, Philippines, China$
;
$k = Malaysia, Indonesia, Philippines, China$
; $r_t^{k - }$
and
$r_t^{k - }$
and $r_t^{k + }$
are negative and positive first difference partial sums defined as
$r_t^{k + }$
are negative and positive first difference partial sums defined as
 $$r_t^{k - } = \mathop \sum \limits_{n = 1}^t \min \left( {\Delta r_n^k,0} \right) \,{\rm and\,} r_t^{k + } = \mathop \sum \limits_{n = 1}^t {\rm{max}}\left( {\Delta r_n^k,0} \right),$$
where
 $$\Delta $$
is the first difference. Using the partial sum decomposition of the exchange rate given by equation (2), the NARDL model is
$$\Delta $$
is the first difference. Using the partial sum decomposition of the exchange rate given by equation (2), the NARDL model is
 $$\eqalign{ \Delta m_t^k = \alpha _0^k + {\beta ^k}m_{t - 1}^k + \psi _r^{k - }r_{t - 1}^{k - } + \psi _r^{k + }r_{t - 1}^{k + } + \psi _i^ki_{t - 1}^k + \sum\limits_{n = 1}^N {\phi _n^k} \Delta m_{t - n}^k \cr \; + \sum\limits_{n = 1}^N {(\rho _{r,n}^{k - }\Delta r_{t - n}^{k - } + \rho _{r,n}^{k + }\;\Delta r_{t - n}^{k + } + \rho _{i,n}^k\Delta i_{t - n}^k)} + \;\xi _t^k, \hskip43.5pt\cr} $$
where $m_t^k$
is the log of real value of imports by county
$m_t^k$
is the log of real value of imports by county $k$
from Thailand;
$k$
from Thailand; $\alpha _0^k = {\alpha ^k} + r_0^k + i_0^k$
;
$\alpha _0^k = {\alpha ^k} + r_0^k + i_0^k$
; ${\alpha ^k},{\rm{\;}}{\beta ^k},{\rm{\;}}\psi _r^k,{\rm{\;\;}}\psi _i^k,{\rm{\;}}\phi _n^k,{\rm{\;}}\rho _{r,n{\rm{\;}}}^k,{\rm{\;and\;}}\rho _{{\rm{i}},n}^k{\rm{\;}}$
are coefficients;
${\alpha ^k},{\rm{\;}}{\beta ^k},{\rm{\;}}\psi _r^k,{\rm{\;\;}}\psi _i^k,{\rm{\;}}\phi _n^k,{\rm{\;}}\rho _{r,n{\rm{\;}}}^k,{\rm{\;and\;}}\rho _{{\rm{i}},n}^k{\rm{\;}}$
are coefficients; $N$
is the number of lagged first differences of dependent and independent variables;
$N$
is the number of lagged first differences of dependent and independent variables; $i_t^k$
is the log of real per capita income representing domestic demand for country
$i_t^k$
is the log of real per capita income representing domestic demand for country $k$
; and
$k$
; and $\xi _t^k$
is the random error term. We can also implement an ARDL model by replacing the partial sum decompositions with the non-decomposed log real exchange rates.
$\xi _t^k$
is the random error term. We can also implement an ARDL model by replacing the partial sum decompositions with the non-decomposed log real exchange rates.
Importing agencies might respond differently to rises than falls in exchange rates. Because the negative first difference partial sums, $r_t^{k - }$
, captures all monotonic decreases in exchange rates, while the positive first difference partial sums,
$r_t^{k - }$
, captures all monotonic decreases in exchange rates, while the positive first difference partial sums, $r_t^{k + }$
, captures all monotonic increases in exchange rates, the NARDL model given by equation (2) allows for the analysis of agents’ response to appreciation and depreciation separately. The key parameters for analyzing long-run exchange rate elasticities are
$r_t^{k + }$
, captures all monotonic increases in exchange rates, the NARDL model given by equation (2) allows for the analysis of agents’ response to appreciation and depreciation separately. The key parameters for analyzing long-run exchange rate elasticities are ${\beta ^k}$
,
${\beta ^k}$
, $\psi _r^{k - }$
, and
$\psi _r^{k - }$
, and $\psi _r^{k + }$
. The error correction term,
$\psi _r^{k + }$
. The error correction term, ${\beta ^k} \in \left[ { - 1,0} \right]$
, is needed to express long-run relationships. If
${\beta ^k} \in \left[ { - 1,0} \right]$
, is needed to express long-run relationships. If ${\beta ^k} = {\rm{\;}} - 1$
, then instantaneous long-run equilibrium adjustments occur. If
${\beta ^k} = {\rm{\;}} - 1$
, then instantaneous long-run equilibrium adjustments occur. If ${\beta ^k} = {\rm{\;}}0$
, then no long-run relationship exists between imports, exchange rates, and income, and the model only estimates short-term dynamics. Furthermore, the variables must be cointegrated for a long-run relationship to exist.
${\beta ^k} = {\rm{\;}}0$
, then no long-run relationship exists between imports, exchange rates, and income, and the model only estimates short-term dynamics. Furthermore, the variables must be cointegrated for a long-run relationship to exist.
The coefficients $\psi _r^k$
and
$\psi _r^k$
and $\psi _i^k$
are the product of the long-run elasticities (
$\psi _i^k$
are the product of the long-run elasticities ( $e_r^k$
and
$e_r^k$
and $e_i^k$
) and the error correction term (
$e_i^k$
) and the error correction term ( ${\beta ^k}$
). Therefore, the asymmetrical long-run elasticities for real exchange rates are
${\beta ^k}$
). Therefore, the asymmetrical long-run elasticities for real exchange rates are
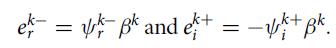 $$e_r^{k - } = \psi _r^{k - }{\beta ^k}{\rm{ \,and\, }}e_i^{k + } = - \psi _i^{k + }{\beta ^k}.$$
Standard errors for the elasticities are calculated using the delta method. Finally, the coefficients $\phi _n^k$
and
$\phi _n^k$
and $\rho _{r,n}^k$
show short-term dynamics, while the coefficients
$\rho _{r,n}^k$
show short-term dynamics, while the coefficients $\rho _{r,0}^k$
and
$\rho _{r,0}^k$
and $\rho _{{\rm{i}},0}^k$
represent contemporaneous elasticities of exchange rates and import demand on trade.
$\rho _{{\rm{i}},0}^k$
represent contemporaneous elasticities of exchange rates and import demand on trade.
4. Data
The model is estimated using the value of imports, real exchange rates, and real GDP for the three importing countries. We collect monthly bilateral quantity and value trade data for Malaysian, Indonesian, and Chinese imports of all rice (HS code 1006), milled rice (HS code 100630), and broken rice (HS code 100640) from Thailand for the period January 2002 through January 2019 from Thailand’s Ministry of Commerce (TMC, 2019).Footnote 11,Footnote 12 To convert nominal values into real values, we collect consumer price indexes (CPI) on a monthly basis for the importing countries from the International Monetary Fund (IMF, 2020).Footnote 13
Monthly exchange rate data are collected from USDA ERS (2019). The value of imports to Malaysia, Indonesia, Philippines, and China from Thailand is converted to real importing countries’ currency using the CPI and exchange rate data. To obtain the exchange rate between Thailand and Malaysia, Indonesia, and China, we divide Thailand’s exchange rate (Baht/USD) by Malaysia’s, Indonesia’s, Philippines’, and China’s exchange rate in Local Currency Units per USD (LCU/USD). Annual GDP per capita, in nominal LCU, is collected from the World Bank (TWB, 2019). Because of the low variability in each country’s GDP data, we estimate the monthly observations from annual real data using spline interpolation in R.Footnote 14 We also estimate 1 month for GDP for January 2019 based on previous trends.
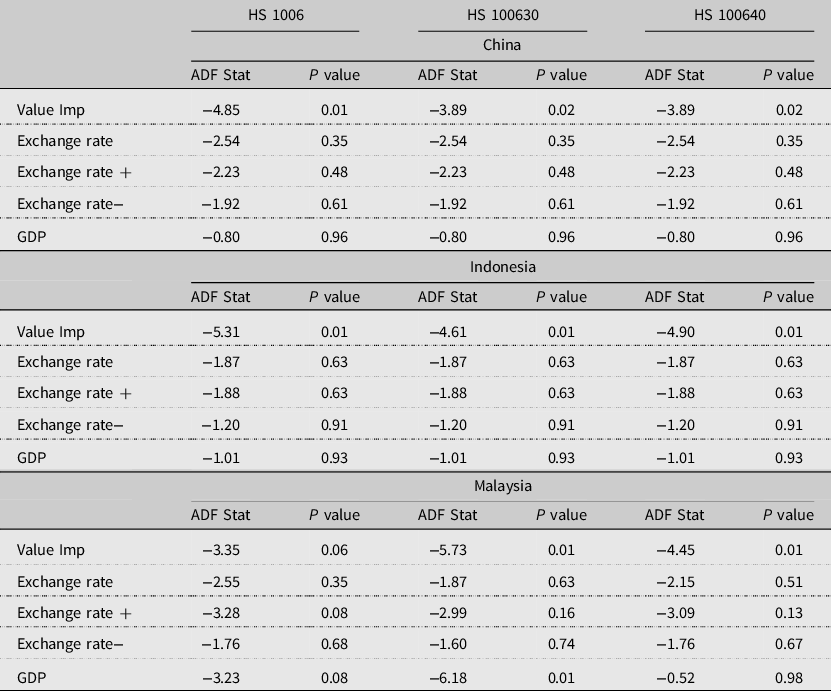
Descriptive statistics are reported in Tables 1 and 2. All exchange rates and GDPs series fail the augmented Dickey–Fuller unit root test (see Appendix B). Figure 1 shows exchange rate fluctuations and partial sum decompositions, based on equation (2), for the three importing countries. Seasonality was identified in Indonesia and Chinese broken rice (HS 100640) imports and removed from the data. Removing seasonality helps ensure the changes in the value of imports due to exchange rate fluctuations are captured instead of changes due to the seasonality of rice. For example, during the harvest season, regardless of the exchange rate, STEs may limit rice imports due to a surge in domestic production and lack of storage for rice.
Table 1. Descriptive statistics of real value of monthly rice imports from Thailand from 2002 to 2019, in local currency units (LCU)
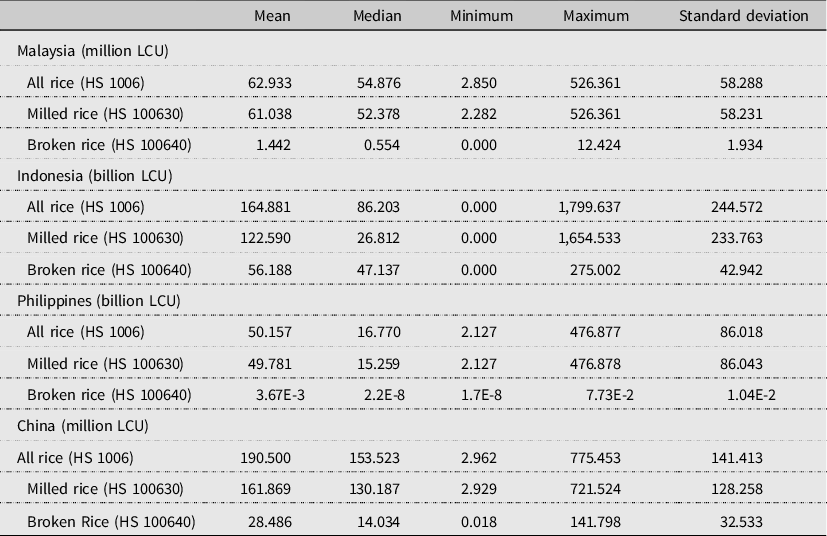
Table 2. Descriptive statistics of independent variables of importing countries
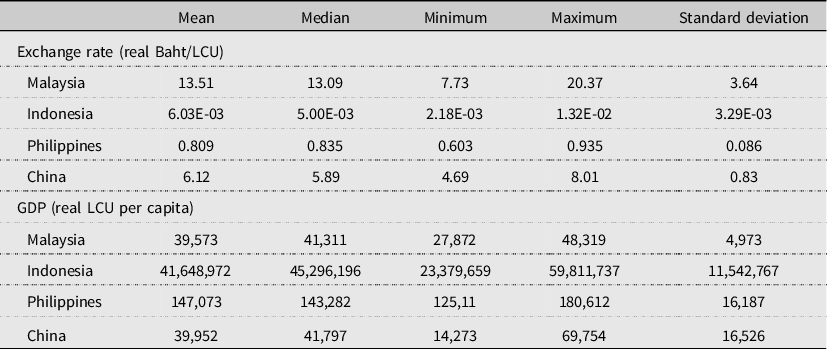

Figure 1. Exchange rates and partial sum decomposition.
We generate three indicator variables to account for (a) the Asian rice crisis, (b) outliers, and (c) zeros observed in the data. The rice crisis occurred from late 2007 through mid-2008 when prices tripled, and the highest ever world rice price was recorded (Lee and Valera, Reference Lee and Valera2016).Footnote 15 Consequently, we create an indicator variable that takes the value 1 for the rice crisis period and 0 otherwise. We see large spikes in Thai to Malaysia trade flows of all rice (HS 1006) and milled rice (HS 100630). An indicator variable is included to account for these two outlier months (June and July in 2008). Finally, an indicator variable is included to account for zeros in the import data. Because the zeros do not appear to be a part of an overall trend, they could result from months when either STEs in the importing country did not import rice or clerical errors occurred in reporting data. In some cases, the former is likely true because it appears the countries stopped importing spontaneously with no trend to zero, potentially providing further evidence of STEs controlling trade. In other cases, the latter is likely true because, for some observations, very small quantities were reported but trade values were zero. With a sample size of 205 monthly observations, there are 50 zeros in Malaysian import data for broken rice (HS 100640). Indonesian import data has 2 zeros for all rice (HS 1006), 29 zeros for milled rice (HS 10030), and 9 zeros for broken rice (HS 10040). There are no zeros in the Chinese rice import data.
5. Results
The analysis of exchange rate pass-through to trade values implements both ARDL and NARDL models for each country pair and rice variety. The ARDL models do not incorporate exchange rate asymmetries, whereas the NARDL models include the partial sum decompositions of the exchange rates. Based on exchange rate theory, fluctuations in exchange rates impact trade flows; appreciation of importers’ currency (Baht/LCU) will lead to a rise, while depreciation will lead to a fall, in rice imports.
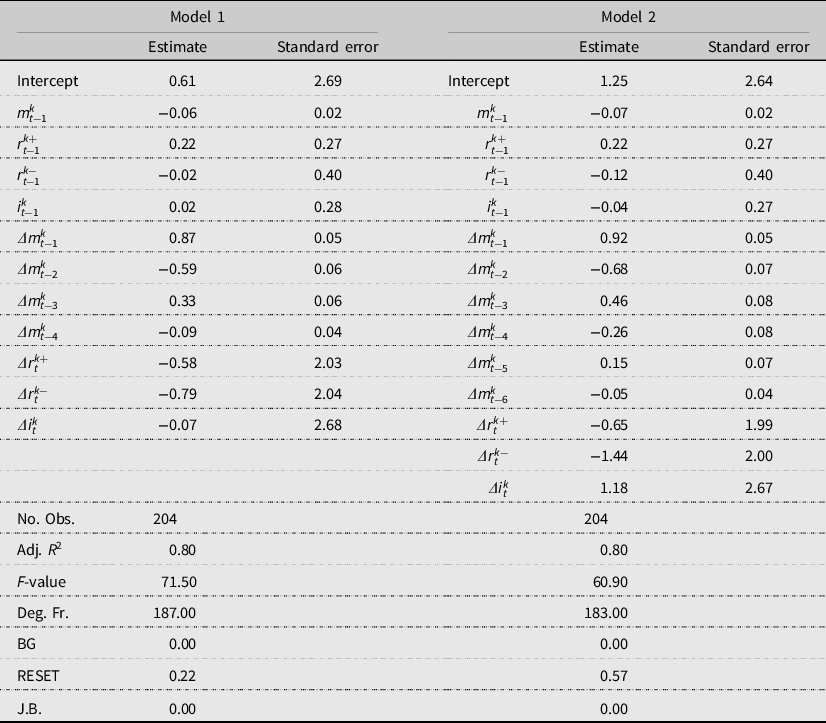
Tables 3–6 report the long-run exchange rate and income pass-through elasticity results for the ARDL and NARDL models for Malaysian, Indonesian, Philippines, and Chinese rice imports from Thailand, respectively. Appendix A, Tables A1–A18, presents the full regression results and specifies the indicator variables and the number of lags that were included in the models of each rice designations (all rice, milled rice, and broken rice) for each importing country.Footnote 16 We use Akaike Information Criterion (AIC) and Bayesian Information Criterion (BIC), along with the significance of coefficients, as a guide to choosing the optimal number of lags ( $N$
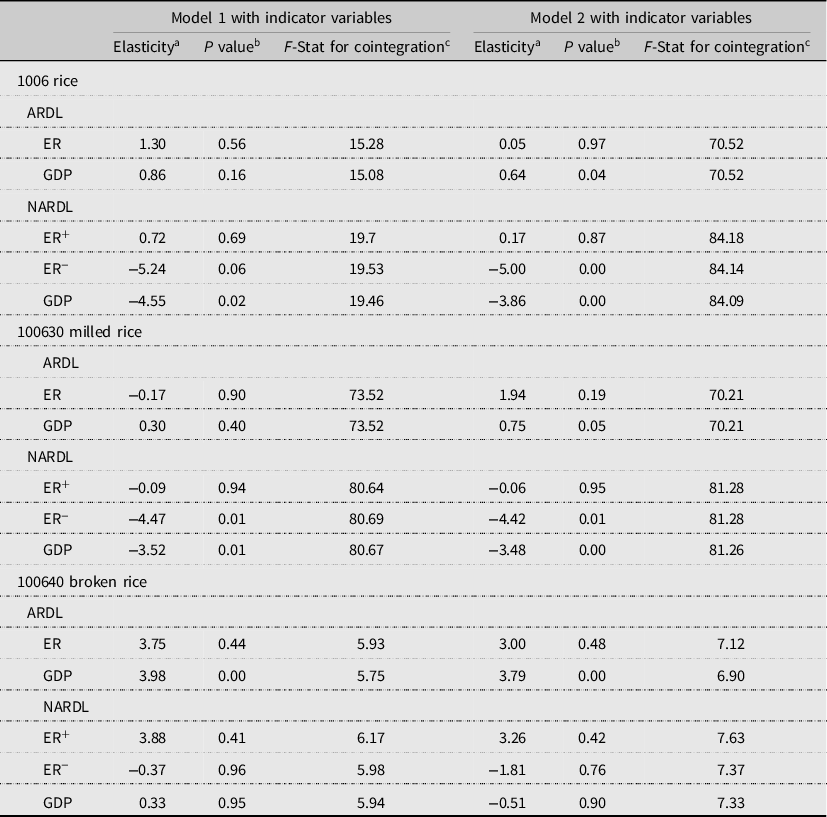
).Footnote 17 The optimal number of lags is highly correlated with the stated actions of STEs. For example, BERNAS typically buys rice on short-term (3–6 months) contracts (WTO, 2016), and the criterion suggests a 3-month lag is ideal for Malaysia. Also, the long-term contracts utilized by COFCO (WTO, 2018a) is reflected in the longer lags (5–7 months) for the Chinese models. We report findings both with indicator variables (Model 1) and without indicator variables (Model 2).
$N$
).Footnote 17 The optimal number of lags is highly correlated with the stated actions of STEs. For example, BERNAS typically buys rice on short-term (3–6 months) contracts (WTO, 2016), and the criterion suggests a 3-month lag is ideal for Malaysia. Also, the long-term contracts utilized by COFCO (WTO, 2018a) is reflected in the longer lags (5–7 months) for the Chinese models. We report findings both with indicator variables (Model 1) and without indicator variables (Model 2).
Table 3. Malaysia’s imports from Thailand: exchange rate and GDP elasticities

a The elasticities in this table are based on regression results presented in Tables A1–A6 in Appendix A.
b P values are calculated based on standard errors calculated using the delta method.
c For the cointegration test, the ARDL Model 1 critical value of 10% = 2.99, ARDL Model 2 critical value of 10% = 3.06, NARDL critical value of 10% = 2.94.
We do not apply the partial sum decomposition to GDP for Indonesia or China because of the strong positive trend.Footnote 18 Standard diagnostic tests are used for each model. The Breusch–Godfrey test found a serial correlation in both ARDL and NARDL models for the following importing countries and rice types: Malaysia, Indonesia, and China for broken rice; Indonesia for all rice; and China for all rice. We employ the Cochrane–Orcutt method to correct the autocorrelation in these models. The Ramsey RESET test for mis-specification shows the model is not mis-specified, and the Jarque–Bera test finds normality (see the tables in Appendix A for the diagnostic test results). The Pesaran, Shin, and Smith (Reference Pesaran, Shin and Smith2001) cointegration test method is also used to examine long-run equilibriums between the value of imports to the exchange rate and importing country GDP. (Note, as discussed in the data section, all exchange rates and GDPs are not stationary as they fail the unit root test.) The F-statistics for each model is all above the critical value, indicating a long-run equilibrium exists.
5.1. Malaysia’s Imports from Thailand
Table 3 reports the results for bilateral trade flows between Malaysia and Thailand. The results generally indicate that, for the ARDL regression, Malaysian imports are consistent with the null hypothesis; that is, the value of rice imports increases with appreciation of the local currency (higher Bath/LCU). However, when examining asymmetries through exchange rate decomposed in the NARDL regression, the trade elasticities no longer follow exchange rate theory. Specifically, for both ARDL all rice (HS 1006) models, the exchange rate elasticities are inelastic and statistically significant, indicating a 1% increase in the exchange rate leads to a 0.90% and 0.80% increase in trade values, respectively. The GDP elasticities estimated in Models 1 and 2 are statistically significant and indicate that imported rice is a normal good because a 1% increase in GDP leads to a 2.06% and 1.69% increase in import values, respectively.
For NARDL all rice, with the exchange rate decomposed, the results now reject the null hypothesis. This result provides evidence of asymmetric responses to exchange rate volatility. For example, with appreciation (ER+), the results show a 1% increase in the exchange rate leads to a 6.70% and 6.85% decrease in the value of trade for Models 1 and 2, respectively, and are statistically significant. The results are also inconsistent with theoretical expectations when depreciation (ER−) occurs—a 1% decrease in the exchange rate leads to a 1.92% and 1.97% increase in value of imports, both significant.
These counterintuitive results for the NARDL model suggest that BERNAS does not optimize import decisions with respect to exchange rate fluctuations. However, these results suggest key policy implications because this response to exchange rate volatility could be indicative of BERNAS advancing their domestic policy of price stability (Kim and Andres Ramirez, Reference Kim and Andres Ramirez2014). That is, appreciation (depreciation) in an importing country can lead to deflation (inflation);Footnote 19 however, reducing imports when exchange rates rise and expanding imports when the exchange rate falls will dampen the domestic price fluctuations associated with exchange rate volatility.Footnote 20 These atheoretical, but expected, results highlight the importance of the asymmetric analysis through the NARDL model to analyze exchange rate volatility.
As for GDP, according to both Models 1 and 2, a 1% rise in income in Malaysia leads to a 3.44% increase in imports; these elasticities are more elastic than in the ARDL models. This finding is consistent with those of Tey et al. (Reference Tey, Shamsudin, Mohamed, Abdullah and Radam2008), who find that rice is a normal good in Malaysia. Some possible explanations for this are that an increase in income allows people to purchase higher quality aromatic and fragrant rice varieties, often regarded as normal or luxury food items. BERNAS may be aware of these preferences and expands imports of higher quality rice as income increases.
Because milled rice accounts for 90% of traded rice, the results for ARDL and NARDL milled rice (HS 100630) are similar in direction, but slightly more elastic, than the models for all rice (HS 1006). Accounting for only 10% of rice trade, the estimated coefficients for broken rice (HS 100640) generally lack statistical significance. This result suggests that BERNAS does not alter broken rice imports when exchange rates fluctuate, or income rises.
5.2. Indonesia’s Imports from Thailand
Table 4 reports the results for bilateral trade flows between Indonesia and Thailand. In contrast to bilateral trade flows between Malaysia and Thailand, the results for Indonesia show that, while the directional effects confirm the null hypothesis for both the ARDL and NARDL estimations, only a few estimated coefficients are significant.Footnote 21 For example, the results show that, for milled rice (HS 100630) for ARDL Model 2, the exchange rate coefficient follows economic theory and is significant at the 10% level: a 1% appreciation leads to a 9.76% increase in imports. As seen by the NARDL results for milled rice, this result appears to be largely driven by depreciation as the estimated coefficient is positive and statistically significant. Therefore, a 1% decrease in exchange rate leads to a 13.14% and 11.39% decrease in imports for Model 1 and Model 2, respectively.
Table 4. Indonesia’s imports from Thailand: exchange rate and GDP elasticities
a The elasticities in this table are based on regression results presented in Tables A7–A12 in Appendix A.
b P values are calculated based on standard errors calculated using the delta method.
c For the cointegration test, ARDL Model 1 critical value of 10% = 2.99, ARDL Model 2 critical value of 10% = 3.06, NARDL critical value of 10% = 2.94.
The general lack of significance could imply that Indonesia’s STE, BULOG, does not take exchange rate volatility into account when making import decisions. Furthermore, this could occur because Indonesia allows both BULOG and private entities to participate in the rice market. The import data used in the analysis includes all types of importers, whether STE or private. Therefore, if BULOG attempts to stabilize price through imports (or disregards exchange rate volatility altogether) while private entities attempt to maximize exchange rate returns, then the net impact on imports when exchange rates move could be ambiguous, leading to the coefficient estimates and trade elasticities being insignificant.
The results also show that GDP does not play an important role in BULOG making rice import decisions. The implication could be that BULOG ensures that enough of this key subsistence commodity is available regardless of income levels. As with the other countries’ results, imports of broken rice (HS 100640) to Indonesia generally lack statistical significance.
5.3. Philippines’ Imports from Thailand
Table 5 provides the results for bilateral trade flows between the Philippines and Thailand. For the ARDL model for all rice, the results are insignificant, which is likely because all rice contains both milled and broken rice that responds differently to exchange rate volatility. The results for milled rice suggest NFA did not behave as a profit maximizer as the coefficient estimate on the exchange rate is negative, while broken rice is consistent with the null as the coefficient estimate for exchange rate is positive. Note that the data sample ends in 2019, the same year the Philippines passed the RTL, lessening the role of the NFA in rice imports.
Table 5. Philippines’ imports from Thailand: exchange rate and GDP elasticities
a1006 ARDL value, ER, and GDP lagged four times with indicator variable (IV) for zeros; 1006 NARDL value, ER, and GDP lagged three times with IV for zeros; 100630 and 100640 ARDL value, ER, and GDP lagged four times; 100630 NARDL value lagged five times, ER and GDP lagged once; 100640 NARDL value, ER, and GDP lagged four times; b1006 ARDL value, ER, and GDP lagged four times without IV; 1006 NARDL value, ER, and GDP lagged three times without IV; 100630 and 100640 all models value lagged four times, ER and GDP lagged once; c 100630 and 100640 ARDL Model 2 critical value of 10% = 2.99; all others critical value of 10% = 2.94.
The NARDL results for all rice between Model 1 and Model 2 are inconsistent, though the results from Model 2 are statistically insignificant, which could be a result of mixing milled and broken rice or because of the primary source country for the Philippines is Vietnam, not Malaysia. For milled rice, the NARDL results are consistent with those of Malaysia—the coefficient estimates show milled rice rejects the null as the imports decrease when exchange rates increase, and imports increase as the exchange rate declines. This suggests NFA price stabilization policies in response to exchange rate volatility. Milled rice imports from Thailand do not respond to GDP as the coefficient estimates are statistically zero. For broken rice, the coefficient estimates suggest that imports do not respond to appreciation. However, imports decline with exchange rate depreciation. Interestingly, while milled rice does not respond to GDP, broken rice imports rise as GDP increases.
5.4. China’s Imports from Thailand
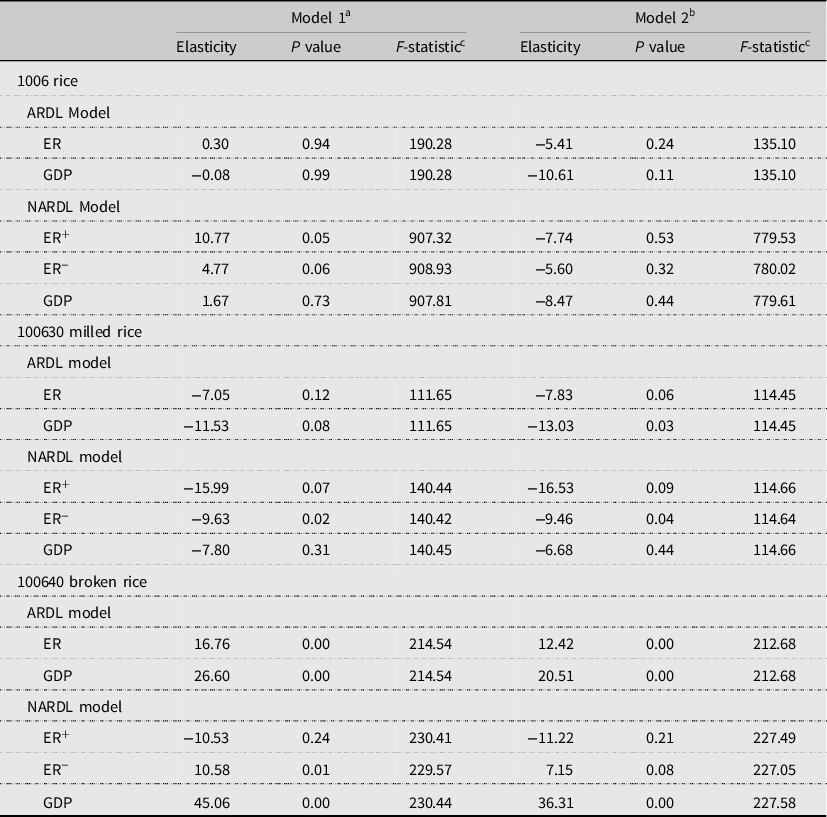
Table 6 reports the results for bilateral trade flows between China and Thailand. For Chinese imports, the signs of the coefficient estimates confirm the null hypothesis in five of the six ARDL models. However, the only significant estimated coefficients are for GDP for Model 2 for all, milled, and broken rice, and GDP for Model 1 for broken rice. Specifically, the results show an increase in income of 1% causes a 0.64% increase in imports in Model 2, showing that imported rice is a normal good. This result counters the finding by Peterson et al. (Reference Peterson, Jin and Ito1991) that suggests that rice is an inferior good in China.
Table 6. China’s imports from Thailand: exchange rate and GDP elasticities
a The elasticities in this table are based on regression results presented in Tables A13–A18 in Appendix A.
b P values are calculated based on standard errors calculated using the delta method.
c For the cointegration test, ARDL Model 1 critical value of 10% = 2.99, ARDL Model 2 critical value of 10% = 3.06, NARDL critical value of 10% = 2.94.
However, the asymmetric NARDL models tell a different story. The estimated elasticities for appreciation are statistically insignificant for all, milled, and broken rice, showing that COFCO does not respond to appreciation. However, for all and milled rice, depreciation leads to an increase in imports. For all rice, a 1% depreciation in the exchange rate causes imports to rise by 5.24% and 5.00% for Model 1 and Model 2, respectively. And, for milled rice, a 1% depreciation in the exchange rate causes imports to rise by 4.47% and 4.42% for Model 1 and Model 2, respectively.
The above results suggest that COFCO also does not focus on optimizing exchange rate returns and acts opposite of theoretical expectations. However, while COFCO does not respond to appreciation, the implications of the STE’s response to depreciation could be viewed as safeguarding against domestic price increases because higher imports could counteract inflationary pressures of depreciation. Taken together, these results could imply that COFCO is primarily concerned with providing a steady supply of rice and combating inflationary pressures.
For GDP, the coefficient estimates change signs from the ARDL to NARDL models. The elasticities are significant, and suggest rice is an inferior good in China (consistent with the findings in Peterson et al., Reference Peterson, Jin and Ito1991). The strong growth of the middle class, rising about 775% from about 80 million in 2002 to about 700 million by 2019 (Statista, 2019) and increasing urbanization could be the reason rice has become an inferior good (Chen and Lu, Reference Chen and Lu2019). Middle-class consumers may prefer meat over rice. For all rice, a 1% increase in income leads to a 4.55% and 3.86% decrease in rice imports. And, for milled rice, a 1% increase in income leads to a 3.52% and 3.48% decrease in rice imports.
For broken rice, exchange rate elasticity estimates are insignificant for both the ARDL and NARDL models, suggesting COFCO does not consider fluctuations in exchange rates when importing broken rice. The GDP elasticity estimates are the only significant results in the broken rice analysis, likely because broken rice is largely used for feed, not human consumption. However, the NARDL models suggest changes in GDP largely do not impact broken rice import decisions.
In summary, the results suggest that, while STEs appear to be heavily involved in the rice trade, there is no consistent pattern in how they respond to exchange rate volatility. In analyzing imports, generally, the best results are for the dominant rice category, milled rice. The results for all rice are muddled with the minimally traded and typically not used for human consumption rice category, broken rice. Generally consistent with our findings, the income elasticity of rice demand has been thought to be inelastic in Asian countries. International rice markets are thinly traded and highly influenced by STEs. Therefore, though our results often do not conform to economic theory, they show that STEs may follow other government goals when administering rice imports.
6. Conclusions and Discussion
Rice is an important staple crop in Southeast Asia. The thin nature of the international rice market results in highly volatile rice prices. Furthermore, government intervention in domestic rice markets may destabilize the international rice market. Price stability is a major focus of Asian governments since fluctuations in the price of rice impact self-sufficiency, food security, and political stability. With a shared concern in Southeast Asia of unfair rice prices, many governments have opted to create STEs to handle the trade of staple foods, particularly rice. In the Southeast Asian rice trade, STEs control a majority of trade in importing countries, as granted by their governments. Some of the goals of STEs are price stability, food security, farmer support, political stability, self-sufficiency, and maintaining cultural norms. The goals of STEs differ from profit-maximizing trade agents, and therefore may not react to market fluctuations in ways consistent with economic theory.
It is important to note that rice stocks are also an important policy tool in Malaysia, Indonesia, and China. For instance, rice stocks average 20%, 13%, and 48% of the annual rice consumption for Malaysia, Indonesia, and China, respectively. However, while the data used in the analysis is monthly, rice stock data are available only on an annual basis. Data reliability is also an issue as there are inconsistencies in stock data across sources. Given annual data does not capture month-to-month volatility, a potential limitation of our analysis is that we are not able to include stock in the analysis. Rice stocks would reduce the importance of STEs responding to exchange rate volatility. Therefore, despite the governments of these three countries using rice stocks as one of the several mechanisms to implement domestic rice policy, our results show that STEs’ response to exchange rate volatility also plays an important role.
This paper analyzes the impacts of exchange rate fluctuations on rice imports by Malaysia, Indonesia, Philippines, and China from Thailand. We utilize both ARDL and NARDL econometric models. The NARDL model allows for asymmetries in exchange rates using partial sum decompositions. The results show that STEs generally do not behave in a manner consistent with the exchange rate theory in importing rice when facing exchange rate volatility. The results suggest that Malaysia’s BERNAS imports more rice with depreciation, offsetting inflationary pressure, and imports less with appreciation, offsetting deflationary pressure. Taken together, this result would be consistent with BERNAS’s state goal of stabilizing domestic prices. In Indonesia, both the STE, BULOG, and private companies import rice and respond differently to exchange rate volatility because of different objectives. Since the data does not distinguish between the two types of importers, the coefficient estimates are largely insignificant for Indonesia. The results for the Philippines’ milled rice imports from Thailand are similar to those of Malaysia, suggesting that NFA prioritized price stabilization policies. The results show China’s STE, COFCO, does not respond to appreciation but increases imports when the exchange rate depreciates. These results are consistent with COFCO providing a steady supply of rice and combating inflation in rice price. We can conclude that rice trade in these key countries does not follow market signals as the STEs do not optimize rice imports as purchasing power fluctuates.
There are two key issues worth noting: First, over our sample, from 2002 to 2019, the goals of the STEs have evolved, leading to some of the insignificant results. Second, Southeast Asian countries have high storage costs due to lack of space and hot, humid climates that could prevent importers in South East Asia from responding optimally to exchange rate volatility. This research provides important information to policy makers as to the behavior of STEs. Findings here can support policy and trade decisions for rice-importing and exporting countries to operate with STE countries.
Author Contributions
Conceptualization, J.L.; Methodology, J.L.; Formal Analysis, T.W. and J.L.; Data Curation, T.W. and A.D.M.; Writing—Original Draft, T.W.; Writing—Review and Editing, J.L. and A.D.M.; Supervision, J.L. and A.D.M.
Conflict of Interest
Taylor Wiseman, Jeff Luckstead, and Alvaro Durand-Morat have no conflicts of interest to declare.
Financial Support
This research received no specific grant from any funding agency, commercial, or not-for-profit sectors.
Data Availability
The authors confirm that the data supporting the findings of this study are available within the article.
Appendix A. Regression Results for Bilateral Trade Flows
Table A1. Regression results for Malaysia from Thailand ARDL 1006 all rice
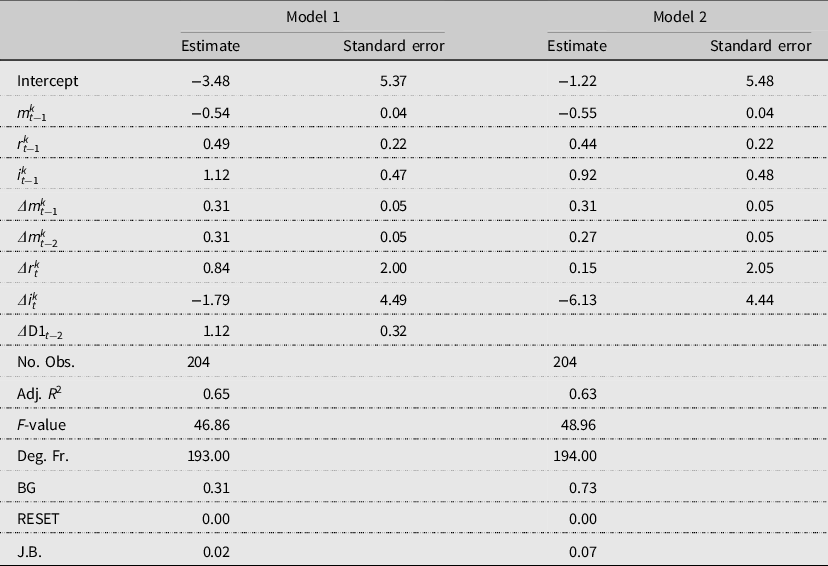
Table A2. Regression results Malaysia from Thailand NARDL 1006 all rice
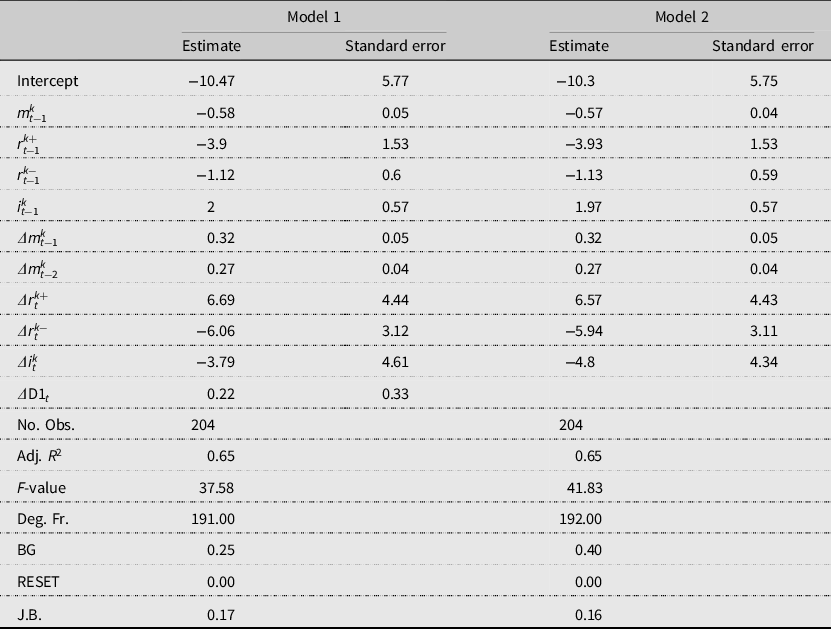
Table A3. Regression results for Malaysia from Thailand ARDL 100630 milled rice
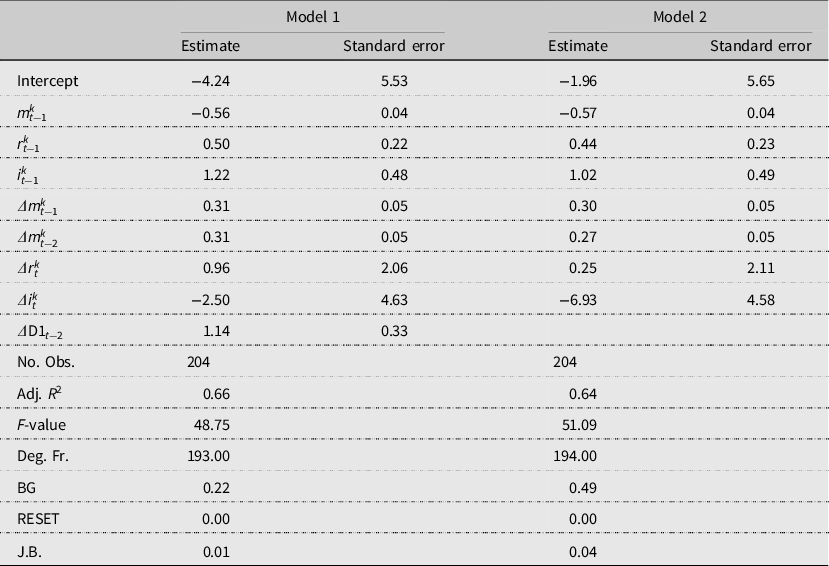
Table A4. Regression results for Malaysia from Thailand NARDL 100630 milled rice

Table A5. Regression results for Malaysia from Thailand ARDL 100640 broken rice
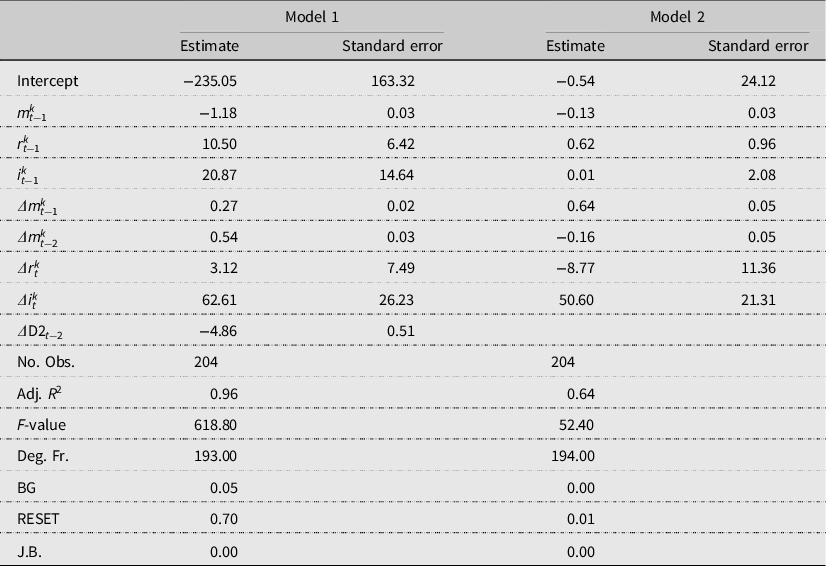
Table A6. Regression results for Malaysia from Thailand NARDL 100640 broken rice

Table A7. Regression results for Indonesia from Thailand ARDL 1006 all rice
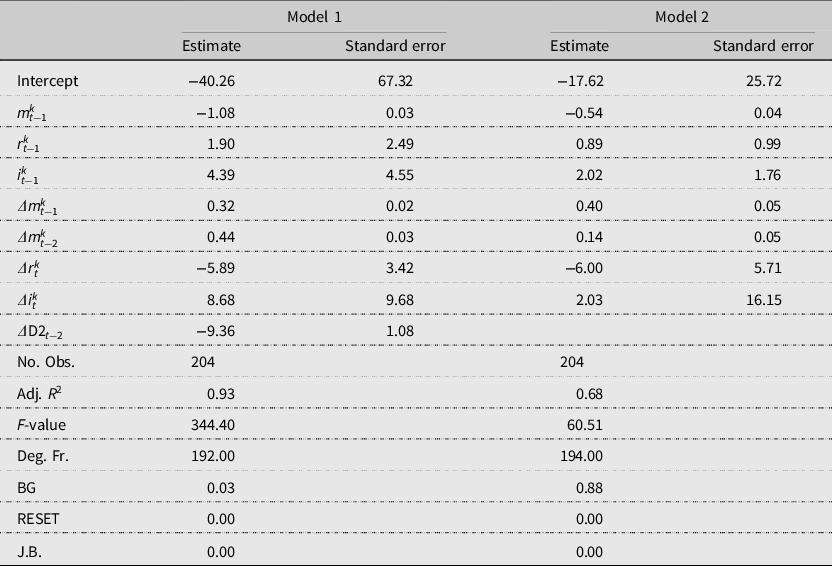
Table A8. Regression results for Indonesia from Thailand NARDL 1006 all rice
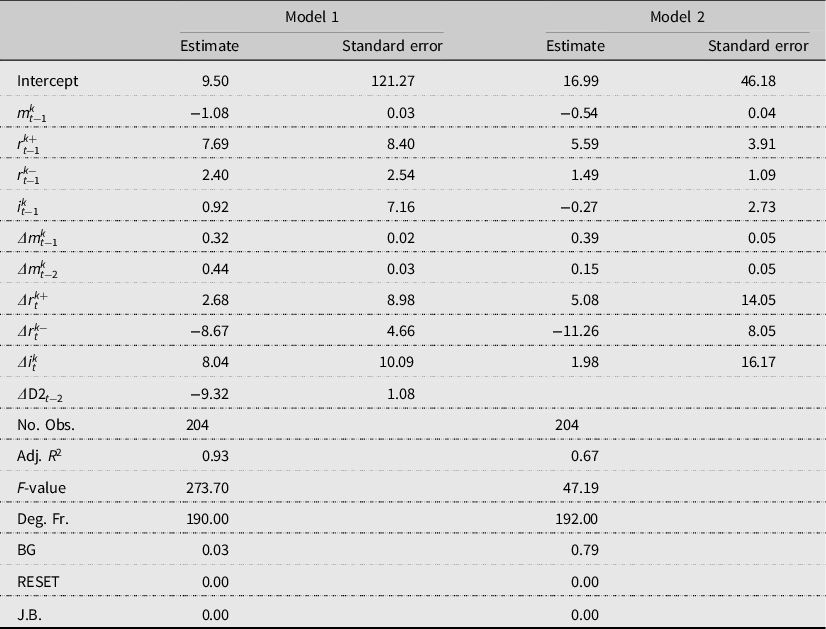
Table A9. Regression results for Indonesia from Thailand ARDL 100630 milled rice

Table A10. Regression results for Indonesia from Thailand NARDL 100630 milled rice
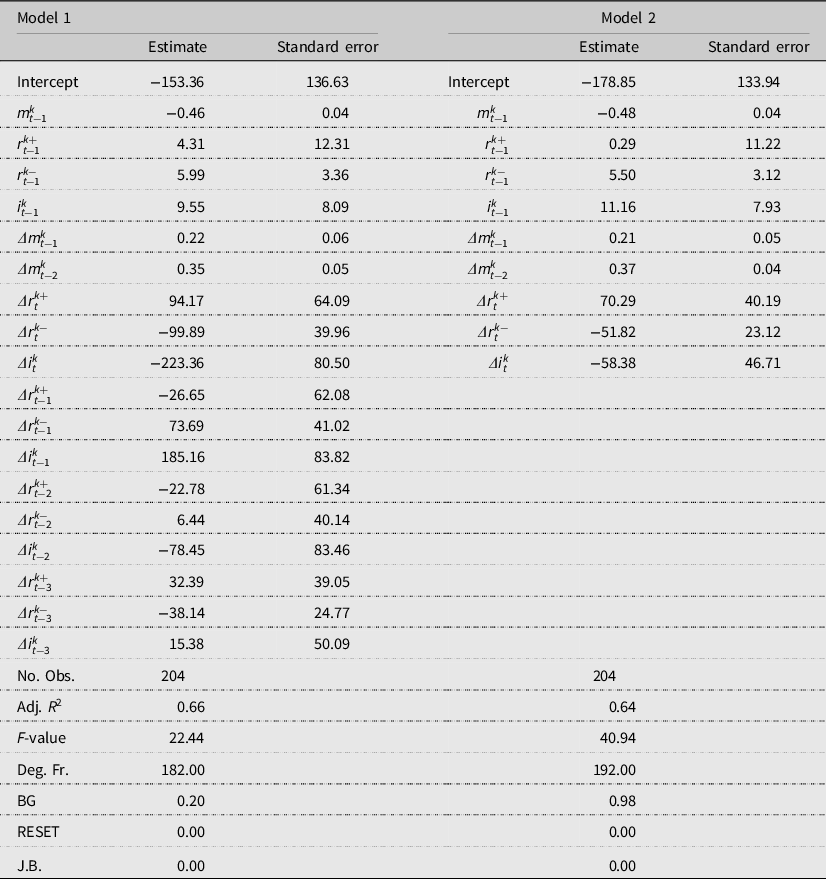
Table A11. Regression results for Indonesia from Thailand ARDL 100640 broken rice
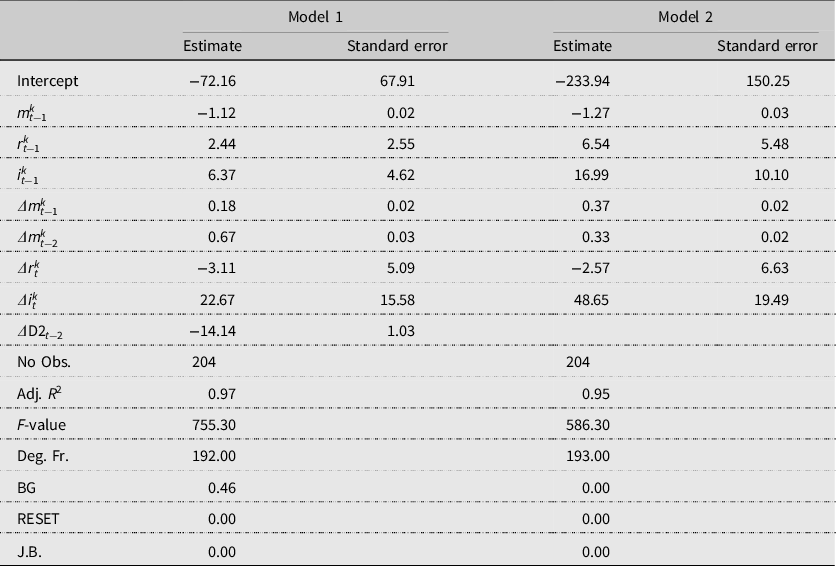
Table A12. Regression results for Indonesia from Thailand NARDL 100640 broken rice
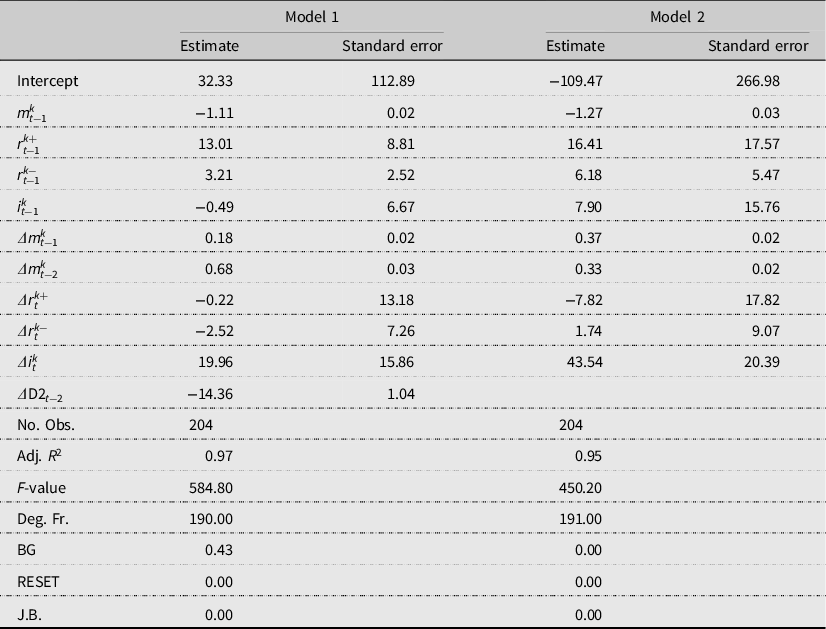
Table A13. Regression results for China from Thailand ARDL 1006 all rice
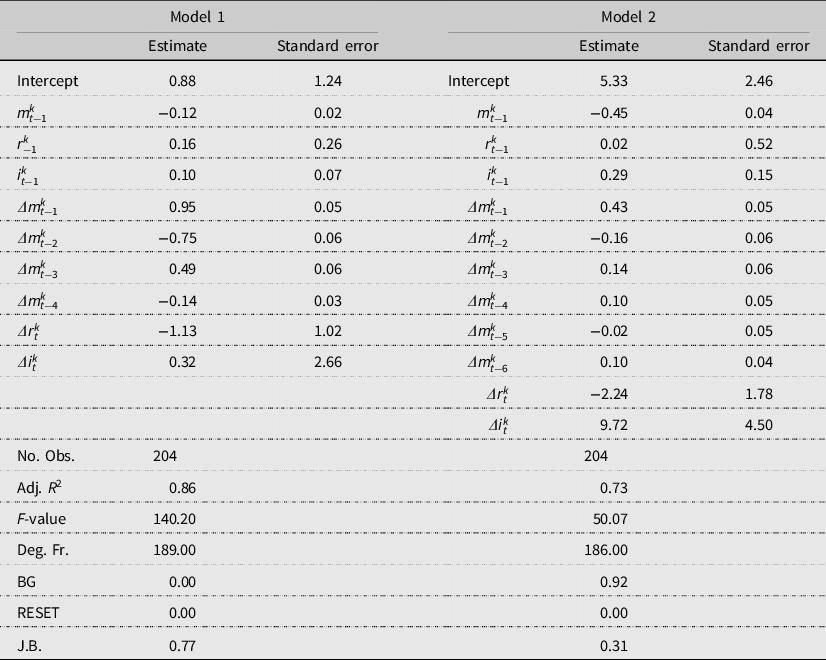
Table A14. Regression results for China from Thailand NARDL 1006 all rice
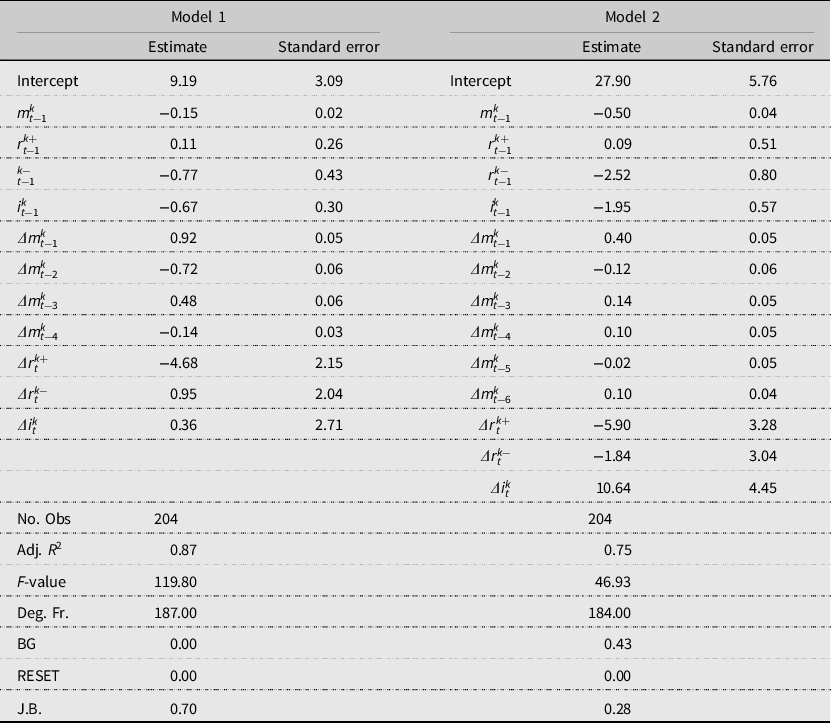
Table A15. Regression results for China from Thailand ARDL 100630 milled rice

Table A16. Regression results for China from Thailand NARDL 100630 milled rice
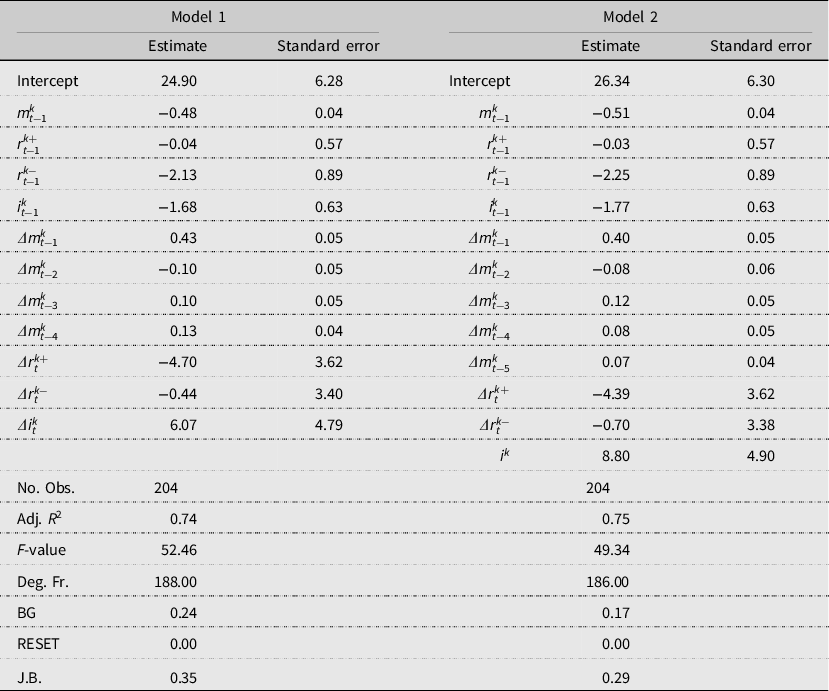
Table A17. Regression results for China from Thailand ARDL 100640 broken rice
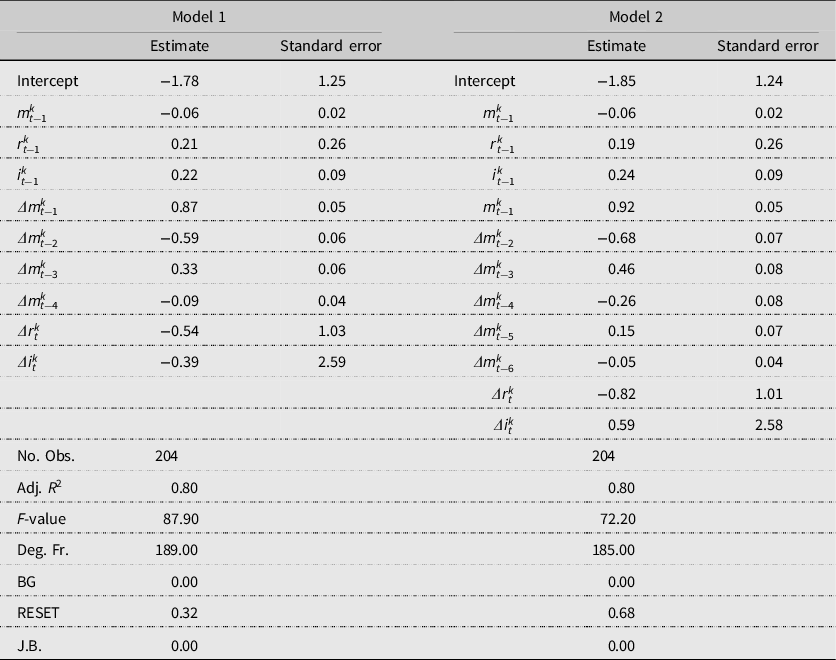
Table A18. Regression results for China from Thailand NARDL 100640 broken rice
Appendix B. Unit Root Tests


 Open access