


Introduction
Humanity is increasingly recognizing that for people to be healthy, ecosystems and animals (domestic and wild) also need to be healthy (United Nations, 2015; Whitmee et al., Reference Whitmee, Haines, Beyrer, Boltz, Capon, Dias, Ezeh, Frumkin, Gong, Head, Horton, Mace, Marten, Myers, Nishtar, Osofsky, Pattanayak, Pongsiri, Romanelli, Soucat, Vega and Yach2015; One Health Initiative, 2021). In 2015, United Nations Member States adopted the 2030 Agenda for Sustainable Development, with the aim of producing healthy, resilient and sustainable societies. The Agenda acknowledges the need to balance the economic, social and environmental components of development and includes 17 ambitious sustainable development goals (SDGs) and 169 targets (United Nations, 2015).
How we produce, consume, and monitor products and their nutrients derived from livestock value chains is pivotal in achieving sustainable development globally. Eradicating malnutrition (SDG target 2.2), ensuring sustainable food production (SDG target 2.4) and reducing food loss and waste (SDG target 12.3) directly rely on these actions. Optimizing nutrients harvested from each individual animal at the abattoir will assist the world in achieving SDG 2 and SDG 12.
To optimize nutrient harvest from livestock value chains, we first need to understand how nutrients are distributed across the edible components of the animal. Through this lens, we will explore the Australian lamb meat value chain as an example animal-source value chain that is an integral component of the Australian agrifood system. This value chain was chosen due to its significant contribution to sheep meat and wool production globally and the Australian economy. Australia is the second largest producer of sheep meat and wool in the world (FAOSTAT, 2021). The products of the industry were valued at approximately seven billion Australian dollars in 2021 (Australian Bureau of Statistics, 2022), and, there were more than 19,000 Australian sheep farming businesses in 2020 (Meat and Livestock Australia, 2021).
According to Spooncer (Reference Spooncer2014), edible offal accounts for approximately 7% of the economic value of all the products from processing an Australian lamb, assuming all offal pieces are sold for human consumption. Despite this economic value, there are constraints to offal collection at Australian processing facilities as food for people. These constraints include weak demand, better returns selling into non-human supply chains (e.g. pet food and rendering), availability of labour and having the infrastructure required to recover the offal (Spooncer, Reference Spooncer2014).
Currently, the research interest in offal quality and yield is low, both in Australia and internationally, largely due to the low economic value of offal compared with carcase meat (Sentance, Reference Sentance2011). Researchers are however recognizing that nutrient density is an important consideration when assessing the environmental impact of food production (Drewnowski et al., Reference Drewnowski, Rehm, Martin, Verger, Voinnesson and Imbert2014; Doran-Browne et al., Reference Doran-Browne, Eckard, Behrendt and Kingwell2015; Damerau et al., Reference Damerau, Waha and Herrero2019). Organ meats (when included) were assessed in these studies as one food group, separate to poultry and red meat.
To better assess the environmental and nutritional costs and benefits of livestock value chains, more detailed information on how nutrients are spread across the carcase and co-products (edible offal and slaughter fat) at the individual animal level is required. It is well recognised that offal is nutrient rich and that the nutrient profile of the different types of offal is highly varied. Going further and understanding the relative nutrient contribution of each edible product derived from an individual animal at the time of slaughter, will assist livestock value chains and public health services (including veterinary and environmental) better understand the impacts of downgrades/diversions of edible products at the abattoir on nutrient availability and food security. Downgrades may occur because of a condition that the individual has developed on-farm or due to contamination during processing, making the product unsuitable for human consumption; the constraints of offal production see products that are safe for people to eat being diverted to other markets (e.g., pet food).
This case study will explore the distribution of nutrients across the edible offal and carcase meat of a typical Australian lamb, developed by the authors. The model typical Australian lamb will be based on the preferred market specifications for Australian supermarket lamb meat (Meat and Livestock Australia, 2020). Changes to the breed, carcase composition (e.g., increasing or reducing fat scores) (Smith, Reference Smith2019), age of animal (Williams et al., Reference Williams, Droulez, Levy and Stobaus2007), and production system (de Bruyn et al., 2016) will influence the outputs of the model. Due to insufficient published data that address these factors, the model was restricted to using mean weight yield of carcase, edible offal and slaughter fat and mean nutrient composition data.
This deeper understanding of nutrient distribution will help livestock industries and governments to analyse the social, environmental and economic costs and benefits of animal production systems and facilitate more equitable comparisons of all food production systems.
Methods
Nutrient distribution across the food products derived from a typical Australian lamb was modelled. To begin with, the Lamb Carcase Value Calculator MkII (LVC) (Smith, Reference Smith2019) was used to calculate the yield of carcase meat from a typical Australian lamb. The LVC is an Excel-based calculator that uses grading inputs to predict the weight of wholesale carcase cuts. The raw weights of the derived carcase cuts were then converted into edible raw weights, using conversion factors from the Australian Food Composition Database (Food Standards Australia New Zealand, 2019a). Finally, the nutrient composition of each derived carcase cut was calculated using AUSNUT 2011–13 Australian Food Composition Tables (Food Standards Australia New Zealand, 2014).
A similar process was undertaken to determine the nutrient composition of co-products (edible offal and slaughter fat) harvested from a “typical” Australian lamb. Where possible, Australian data was used when calculating the nutrient composition of lamb co-products. When this was not available, data from Canada, USA and the UK were imputed. Raw offal weights were taken from most recently available published data (Hutchison et al., Reference Hutchison, Nga, Kuo and Greenfield1987; Spooncer, Reference Spooncer1992; McCutcheon et al., Reference Mccutcheon, Blair and Purchas1993; Sentance, Reference Sentance2011). Conversion factors to determine the edible portion of the raw offal (by weight) were taken from Hutchison et al. (Reference Hutchison, Nga, Kuo and Greenfield1987) and the international food composition databases. The nutrient composition of each piece of edible offal was calculated using AUSNUT 2011–13 Australian Food Composition Tables, the Canadian Nutrient File, National Nutrient database for Standard Reference Legacy Release and McCance and Widdowson’s composition of foods integrated dataset (Food Standards Australia New Zealand, 2014; Government of Canada, 2015; Public Health England, 2019; U.S. Department of Agriculture and U.S. Department of Health and Human Services, 2019).
Nutrients included in the model were total protein, total fat, vitamin A retinol equivalents, thiamine, riboflavin, niacin derived equivalents, dietary folate, dietary folate equivalents, vitamin B6, vitamin B12, vitamin C, iron, magnesium, phosphorus, potassium, selenium, sodium, zinc, cholesterol, tryptophan, total saturated fat, total monounsaturated fat, total polyunsaturated fat and energy. These nutrients were selected for the following reasons:
-
they were available in AUSNUT 2011–13 (Food Standards Australia New Zealand, 2014) and in the overseas food composition databases used in to create the model “typical” Australian lamb (Government of Canada, 2015; Public Health England, 2019; U.S. Department of Agriculture and U.S. Department of Health and Human Services, 2019) and
-
for micronutrients, a 100 g serve (raw) of at least one of the edible products provided 10% or more of the recommended daily intake of the vitamin or mineral for Australian adult men or women (not pregnant or lactating) (Australian Government and New Zealand Government, 2017) and
-
where data on multiple forms of the same vitamin were present, only the aggregated vitamin levels was included (e.g., preformed vitamin A (retinol), beta-carotene, provitamin A and vitamin A retinol equivalents were included in the model as vitamin A retinol equivalents).
A range of edible offal pieces were not included in the estimation due to a lack of published weight and nutrient composition data. The edible offal pieces for which there was insufficient data included blood, head meat, trachea, feet/tendons, omasum, abomasum and intestines.
The Food Composition Database AUSNUT 2011–13 (Food Standards Australia New Zealand, 2014), was used to calculate nutrient content of the edible carcase products and lamb liver, kidney, heart, tongue and brain. This database was developed to facilitate food and nutrient intake estimates to be made from the National Nutrition and Physical Activity Survey 2011–12, a sub-study of the 2011–13 Australian Health Survey. AUSNUT 2011–13 was selected as it contained nutrient composition data for some raw offal pieces, whereas the current Australian Food Composition Database (Food Standards Australia New Zealand, 2019a) contains no nutrient composition data for raw lamb offal.
Further detail on the modelling is available in supplementary material 1.
Results
A total of 22 food products were included in the model of the typical Australian lamb, 10 carcase primals, 5 pieces of each of red and white edible offal and two types of slaughter fat (Table 1).
Table 1. Food products included in the model of the typical Australian lamb, aggregated by body region and product type

Uncertainties in the estimation of nutrient distribution across the edible parts of a “typical” Australian lamb
Uncertainties in the calculation of nutrient distribution across the edible components of a “typical” Australian lamb were qualitatively rated on a five-point scale (very low, low, medium, high, very high, with a score of 1 for low up to 5 for very high) and a justification for the rating provided (Table 2). The ratings were assigned considering the age of the data, the type of data (analysed, imputed or modelled), the provenance of the samples and the number of samples. The sources of uncertainty were given equal weighting. Based on an average of these ratings, the overall level of uncertainty in the model is high. As such, only descriptive analysis of the nutrient distribution was performed. This level of uncertainty should be considered when interpreting these results.
Weight of edible products in the model
Based on the selected values, the LVC produced a typical Australian lamb carcase that had 20.03 kg of raw carcase meat, accounting for 80% of the total weight of food products. The weight of the raw, untrimmed offal and slaughter fat accounted for 10% each of the total weight of food products however, blood, trachea, omasum, abomasum, intestines, feet/tendons and head meat were excluded from the model.
When these weights were converted to edible weights, the carcase primal cuts accounted for 76% of all modelled edible product in the raw, untrimmed form distributed across the forequarter (27%), loin (22%) and hindquarter (27%). The shoulder and leg combined accounted for more than a third of the total edible product weight (20% and 17%, respectively) (Fig. 1).

Figure 1. (A) Edible weight, macronutrient and energy distribution across the carcase, red offal, white offal and slaughter fat modelled typical Australian lamb (A) and (B) distribution of edible weight, fat and cholesterol across the carcase, red offal, white offal and slaughter fat. Note, due to insufficient data the model excluded head meat, blood, trachea, feet/tendons, omasum, abomasum and intestines.
The red offal (liver, kidney, heart, tongue and spleen) and white offal (lungs, brain, thymus, pancreas, and tripe) each accounted for 6% of total edible product weight in the modelled “typical” Australian lamb. The slaughter fat accounted for remainder of the edible product weight i.e., 13% of total edible product weight in the modelled Australian lamb (3% body fat and 9% visceral fat) (Table 3).
Table 2. Uncertainties in estimating the distribution of nutrients across the edible carcase and co-products of a “typical” Australian lamb

Table 3. Weight of raw, untrimmed product and the edible portion of the product calculated from the model of a “typical” Australian lamb

* Due to rounding, data may not sum.
Nutrient distribution across the modelled edible products
For the remainder of this paper, all products are considered as the edible portion in a raw, untrimmed state. Comparisons are relative to weight of such products.
Macronutrients and energy
The carcase accounted for 68% of the total energy, 82% of the total protein and 63% of the total fat (Fig. 1). The red and white offal combined accounted for 5% of the total energy, 10% of total protein and 3% of the total fat. The slaughter fat accounted for the difference, i.e., 27% of the total energy, 7% of the total edible protein and 34% of the total fat in the modelled typical Australian lamb (Fig. 1(a)).
The white offal and slaughter fat had slightly lower protein levels, relative to weight. Conversely, the red offal and carcase primal cuts had similar or slightly higher protein levels, relative to weight in the modelled lamb (Fig. 1(a)).
Relative to edible weight, the co-products were fattier than the carcase products. This was due to the slaughter fat; the red and white offal pieces were relatively leaner than the carcase primal products. Energy distribution across the products was very similar to total fat distribution (Fig. 1).
The relative amounts of saturated fat, monounsaturated fat and polyunsaturated fat across the carcase products, edible offal and slaughter fat were similar to that of the distribution of total fat (Fig. 1(b)).
Micronutrients
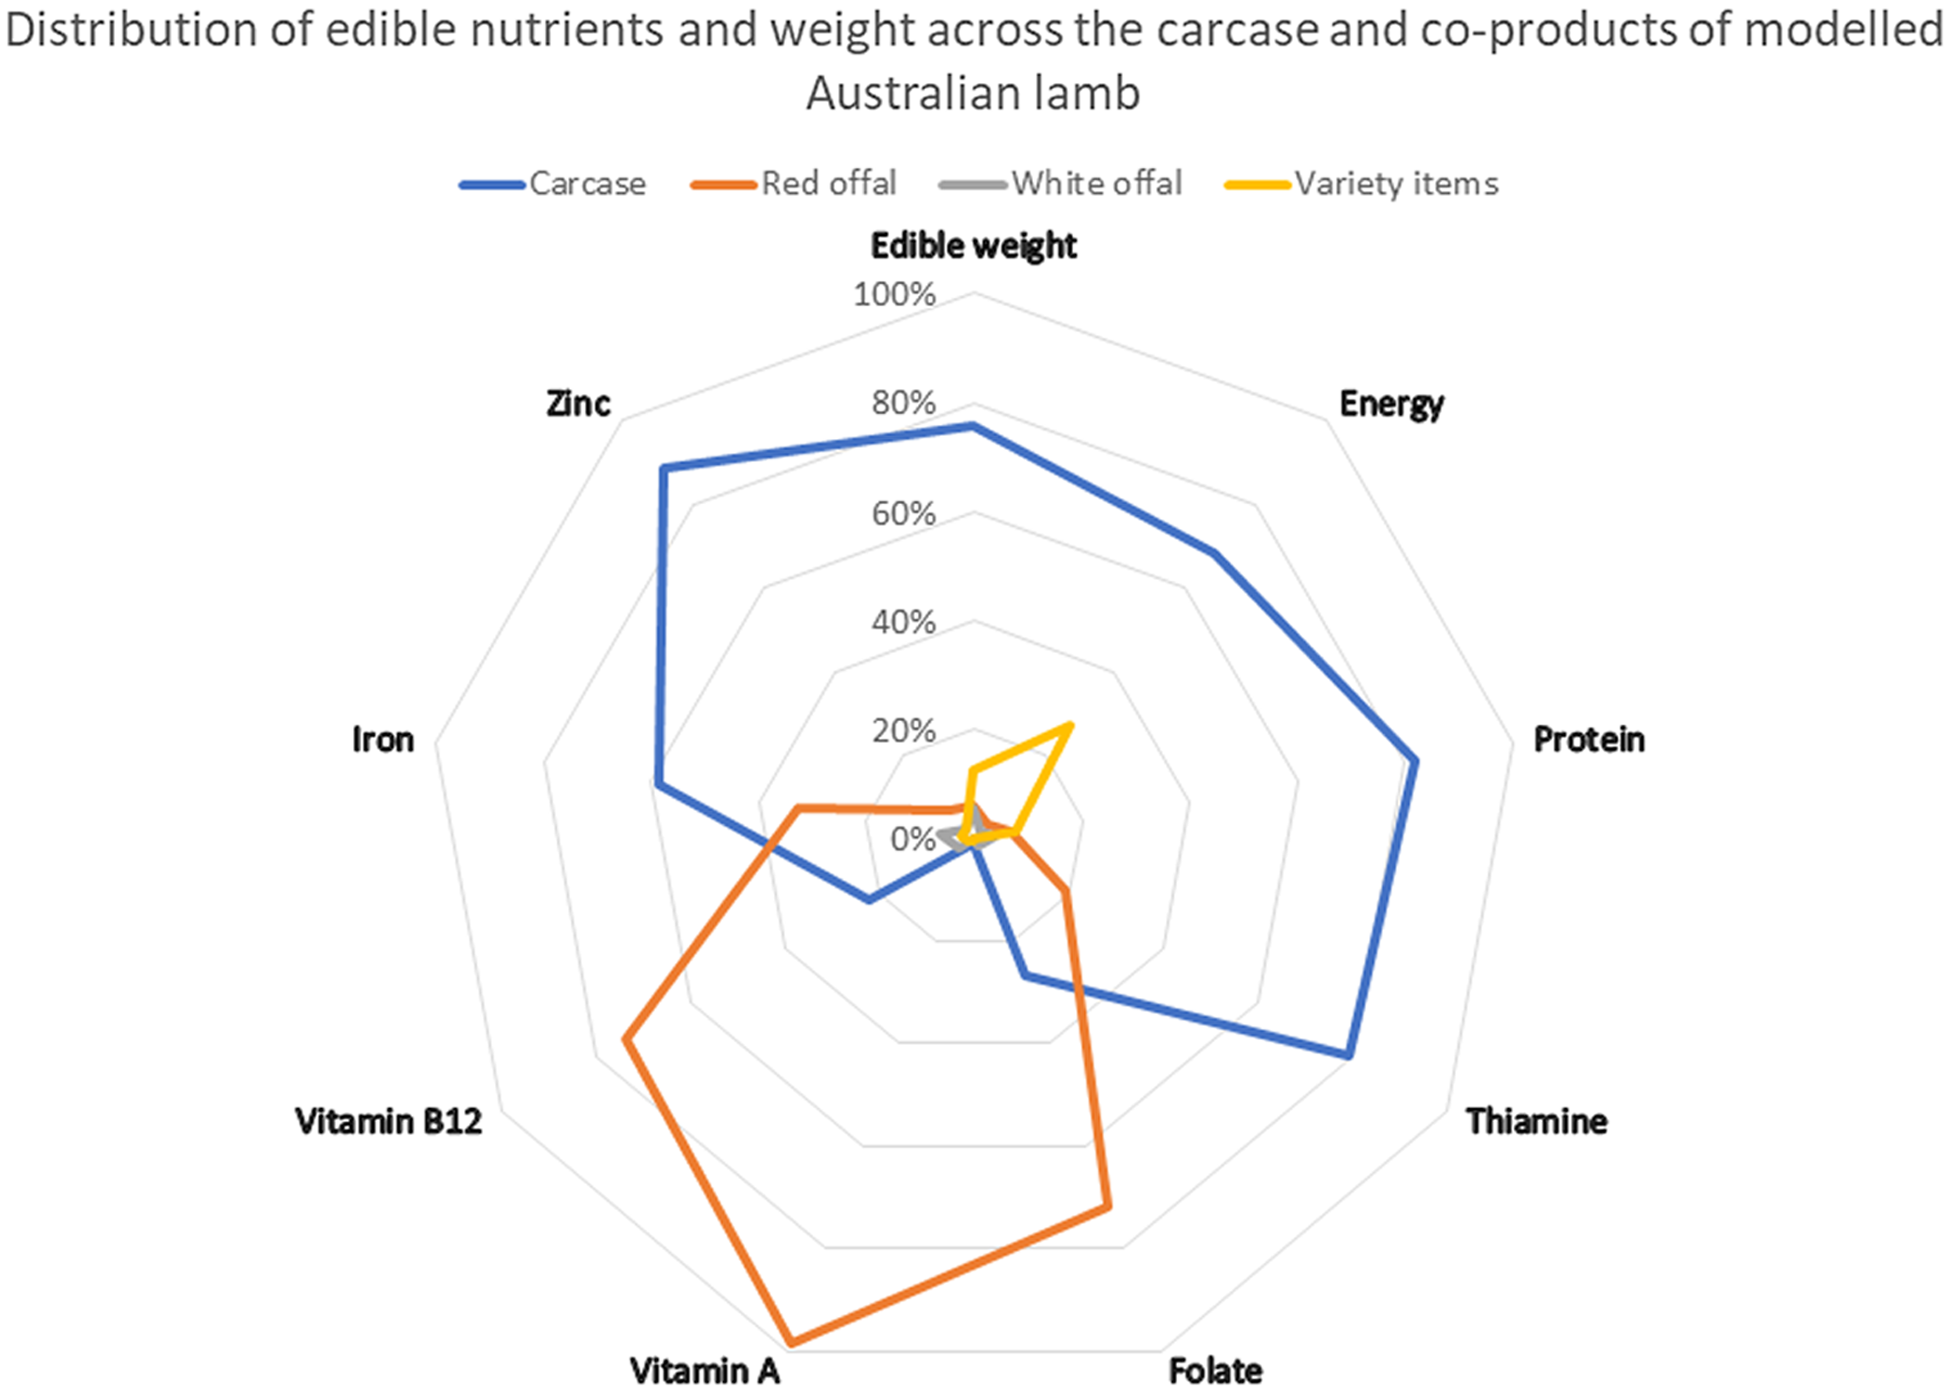
The carcase primals accounted for 0% (vitamin C) up to 79% (thiamine) of the total vitamins in the “typical” Australian lamb model. The red offal accounted for more of the total available edible vitamin A retinol equivalents (99%), vitamin B12 (74 %) dietary folate equivalents (72%) and vitamin C (56%) in the modelled lamb than all the other types of food product combined (i.e., carcase primals, white offal and slaughter fat). Also, relative to weight, the red offal accounted for greater amounts of thiamine (19%), riboflavin (43%), niacin derived equivalents (12%) and vitamin B6 (21%) (Fig. 2(a)).

Figure 2. Distribution of vitamins across a modelled typical Australian lamb (A) the carcase, red offal white offal and slaughter fat and (B) the carcase and edible offal pieces and slaughter fat types. The liver accounts for a significant proportion of vitamin A, dietary folate equivalents, vitamin B12, vitamin C and riboflavin.
The range in the distribution of minerals across the carcase products of the “typical” Australian lamb (58% for iron up to 88% for magnesium and zinc) was narrower than the range in distribution of vitamins across the carcase products. Relative to weight, red offal accounted for moderately greater amounts of iron and selenium (33% and 24%, respectively). The white offal accounted for mildly greater amounts of sodium (9%) in the modelled lamb compared with weight (Fig. 3(a)).

Figure 3. Distribution of minerals across the modelled typical Australian lamb (A) the carcase, red offal white offal and slaughter fat and (B) the carcase and edible offal pieces and slaughter fat types. There are relatively greater amounts of iron in the red and white offal compared with the carcase, due to the iron content in the liver, spleen, kidneys and lungs. The liver and kidneys are also relatively rich in selenium compared with the carcase.
Nutrient distribution in edible offal
The distribution of macronutrients, vitamins, minerals and fats across the edible offal pieces included in this model was markedly variable, as it was for the distribution across the carcase and co-products. It is well known that liver as a food is nutrient dense and the results of this model demonstrate the extraordinary nutrient content of liver, in the context of the whole animal. The liver alone contained 99% of total vitamin A, 71% of total dietary folate equivalents, 63% of total vitamin B12, 41% of the total vitamin C and 34% of the total riboflavin (Fig. 2(b)). With respect to minerals, the liver accounted for 17% of the total iron and 14% of the total selenium in the products of the “typical” Australian lamb model (Fig. 3(b)).
Relatively to edible weight, higher amounts of cholesterol were found in the liver, accounting for 15% of the total available cholesterol (Fig. 1(b)). The Australian Dietary Guidelines state “eating cholesterol does not necessarily increase cholesterol in human blood plasma” (National Health and Medical Research Council, 2013). There is no upper limit set for cholesterol intake in Australia (National Health and Medical Research Council, 2006). The liver has significantly lower levels of total fat, saturated fat, and monounsaturated fat, relative to edible weight.
Other areas of interest identified in the analysis were the relative richness of iron in the spleen, kidneys and lungs. The spleen accounted for 0.5% of the modelled total weight and approximately 11% of the modelled total iron. The kidneys were also relatively rich in selenium (approximately nine times greater compared with edible weight). The kidneys and lungs had relatively high sodium levels, contributing 7% of the total sodium combined, compared with 2% of total edible weight (Fig. 3(b)). The kidneys accounted for 7% of the total vitamin B12 while accounting for less than 1% of total edible weight. The lungs accounted for 31% of total vitamin C while accounting for 2% of total edible weight (Fig. 2(b)).
Conclusions
This case study demonstrates the remarkable contribution of offal to the total nutrient content in the edible products of the modelled Australian lamb. In particular, lambs’ liver is a highly valuable source of nutrients key to public health globally and in Australia, including vitamin A, iron (World Health Organization, 2020), folate and thiamine (Food Standards Australia New Zealand, 2019b), not only as a food, but also in the context of nutrient yield from an individual animal. The spleen and kidneys were also shown to be valuable sources of iron, in the context of the whole animal. In addition, animal-sourced foods are recognized as having greater bioavailability of many nutrients, including iron, vitamin A and folate. Failing to harvest offal for human consumption would greatly reduce the nutrient yield from this modelled “typical” Australian lamb. This is particularly true for vitamin A, as the liver contains 99% of this vitamin.
As stated earlier, edible offal from the Australian sheep meat value chain accounts for 7% of the total economic value of all products harvested for human consumption (Spooncer, Reference Spooncer2014) and offal is being diverted to other markets due to the constraints on offal collection.
Considering the results of this modelling regarding nutrient content of edible offal relative to the nutrient content of the entire “typical” Australian lamb, it appears there may be a market failure in the Australian sheep meat value chain. Australia is not alone here; there is a lack of current information globally on edible offal production (Food and Agricultural Organization, 2022) and edible offal nutrient composition. This is evident in the absence of edible offal in the Food and Agricultural Organization’s Global Livestock Environmental Assessment Model (GLEAM) database (Food and Agricultural Organization, 2021). Collaboration between government (veterinary public health, food safety and public health agencies) and livestock industries will be required to address the issue of edible offal being of relatively low economic value in context of an individual animal but being relatively rich in micronutrients key to public health.
To enable optimal nutrient harvest from the Australian lamb value chain, it will be important to have current knowledge of nutrient composition. The need to better understand offal yields from Australian sheep and cattle value chains has already been recognized by Sentance (Reference Sentance2011).Understanding edible offal nutrient composition as well as offal yields will reduce the uncertainty in the output and enable a more proportionate assessment of the benefits and costs of animal production systems when considering natural resource management.
Currently, there is no recommended intake of edible offal in the Australian Dietary Guidelines (National Health and Medical Research Council, 2013). This is because the guidelines are based on what Australians eat, rather than what is grown and harvested from Australian soils. The lack of guidance on offal consumption as part of a healthy diet is particularly important for women of reproductive age, due to the risk of teratogenic effects of excessive vitamin A intake (National Health and Medical Research Council, 2022). Australia does not have a position on the consumption of liver while pregnant and advice from other high income countries is contradictory (Wingett and Alders, 2018).
To support sustainable agriculture, it is suggested Australia develops recommended dietary intakes for not only what is eaten, but also what is grown and harvested, including each type of edible offal. This is one step in creating a market for healthy animal-source food products that contain edible offal, such as offal enhanced minced meat and sausages. At the same time, government and livestock industries will be able to better understand nutrient flows along animal-source value chains. Optimizing human consumption of edible offal will increase nutrient availability and help to directly achieve four of the 17 SDGs.
Supplementary material
To view supplementary material for this article, please visit https://doi.org/10.1017/one.2023.1
Data availability statement
Data set available at: Wingett, K. and Alders, R. (2023). Distribution of nutrients across the edible components of a modelled typical Australian lamb: A case study. Cambridge Open Engage. https://doi.org/10.33774/coe-2022-5d0kf-v2
Acknowledgments
The authors would like to acknowledge David Hopkins and Chris Smith for assistance with access to the Lamb Carcase Value Calculator MkII and the time taken to explain how to use calculator – your assistance is greatly appreciated.
The authors would like to acknowledge AUS-MEAT for allowing the publication of information from the Handbook of Australian Meat.
The authors would like to acknowledge Julia de Bruyn for kindly taking the time to review and comment on an earlier version of this paper.
Funding statement
The authors would like to acknowledge Bequest Funding from the Faculty of Veterinary Science, University of Sydney and the Post Graduate Research Support Scheme, University of Sydney.
Conflict of interest
Kate Wingett declares that the research was conducted in the absence of any commercial or financial relationships that could be construed as a potential conflict of interest.
Robyn Alders declares a potential conflict of interest in that she owns a merino sheep farm (which is not her primary source of income), however, her farm does not produce prime lambs.


 Open access
Comments
No accompanying comment.