


Color is a fundamental attribute that archaeologists and others use to describe and categorize their research universe. In particular, color has been identified as a primary characteristic for identifying and recording soils and sediments in archaeological contexts, and it is used to match strata across a site or to identify diagnostic pedological or anthropogenic features (e.g., Barba Reference Barba1989). Soil color also has demonstrable links to microscopic composition, such as organic content, iron richness, and oxygenation (Holliday Reference Holliday2004:193–196). In addition, archaeologists routinely record color for many types of artifacts and archaeological finds (Gerharz et al. Reference Gerharz, Lantermann and Spennemann1988), including pottery (e.g., Frankel Reference Frankel1994; Ruck and Brown Reference Ruck and Brown2015), beads (e.g., Delvaux Reference Delvaux2018; Robertshaw et al. Reference Robertshaw, Wood, Haour, Karklins and Neff2014), bones (e.g., Devlin and Herrmann Reference Devlin, Herrmann, Schmidt and Symes2008; Nicholson Reference Nicholson1993), shell (e.g., Pérez et al. Reference Pérez, Sanchis, Hernández, Galván, Sala and Mallol2017), and rock (e.g., Bentsen and Wurz Reference Bentsen and Wurz2019; Oestmo Reference Oestmo2013). There is also increasing acknowledgment of the aesthetic use of color in the past and its significance to broader cultural practices and beliefs (e.g., Munson and Hays-Gilpin Reference Munson and Hays-Gilpin2020).
Archaeologists have generally used color data descriptively, but recently, the application of color data has changed—archaeologists have begun to consider the ways quantitative methods of color analysis can uncover patterning in the archaeological record that more subjective assessments cannot. For example, studies of red slipped pottery in the American Great Plains have identified source differences in specific shades of red paint (Beck et al. Reference Beck, Trabert, Hill and Hill2016; McGrath et al. Reference McGrath, Beck and Hill2017), and researchers have used color analyses to distinguish fire-cracked rock from nonthermally altered rock (Bentsen and Wurz Reference Bentsen and Wurz2019). For color-focused studies such as these, it is important to standardize data, thus increasing the objectivity of measurements.
It is considered customary to use the Munsell Soil Color Charts (MSCC) as a standardized method for recording color in archaeological contexts. Often, this “standard” use of the MSCC is neither explicitly problematized nor justified as a method of analysis necessitating description of use, biases, and relevance to hypothesis testing or data collection. Yet, as is the case in several other scientific fields and uses of color, the recognition and description of color in archaeology can present significant challenges, especially in terms of consistency. Observer color perception is inherently subjective. Individuals interpreting colors from a set of charts will produce differing results (Milotta, Stanco, et al. Reference Milotta, Stanco, Tanasi and Gueli2018; Post et al. Reference Post, Bryant, Karim Batchily, Huete, Levine, Mays, Escadafal, Bigham and Ciolkosz1993; Rabenhorst et al. Reference Rabenhorst, Matovich, Rossi and Fenstermacher2014). This is especially the case in field settings, where light source and intensity impacts soil or sediment color. For example, early morning light may enhance chroma (Turk and Young Reference Turk and Young2020). Moisture and texture of soils and sediments also impact how we perceive color. Furthermore, color blindness is common, affecting as many as 8% of people with XY sex chromosomes (Hunt Reference Hunt, Maloy and Hughes2013). Large field projects are likely to include color-blind participants. Such challenges in the subjectivity of color observations may significantly impact the consistency of the data collected and its usability. For all of these reasons, a digital solution that produces more quantitative and precise measurements without relying on user subjectivity is desirable to generate high-quality data.
Benchtop instruments such as spectrophotometers have been available for many years, but the necessity for sample preparation, lack of portability, and instrument cost have limited their adoption by archaeologists (but see Chenoweth and Farahani Reference Chenoweth and Farahani2015; Giardino et al. Reference Giardino, Miller, Kuzio and Muirhead1998). Instead, innovation in archaeology and related fields has focused on adapting everyday equipment, mainly digital cameras (e.g., McGrath et al. Reference McGrath, Beck and Hill2017; Milotta, Stanco, et al. Reference Milotta, Stanco, Tanasi and Gueli2018; Milotta, Tanasi, et al. Reference Milotta, Tanasi, Stanco, Pasquale, Stella and Gueli2018; Viscarra Rossel et al. Reference Rossel, Raphael, Fouad and Walter2008) and flatbed scanners (e.g., Kirillova et al. Reference Kirillova, Kemp and Artemyeva2017), for color identification. These rely on establishing calibration standards and algorithms to extract specific color data from 2D images. This typically requires processing outside of the field, making it more suitable for lab-based analyses. The advent and accessibility of field-ready handheld devices to measure color has presented a new option. The X-Rite Capsure is, to our knowledge, the only such device to be marketed to archaeologists. Described as a spectrocolorimeter, the Capsure measures the dominant color of a sample and presents the result within the nomenclature of a given color system—for example, Munsell.
Although we are accustomed to thinking that automation improves consistency by removing human errors and subjectivity, the tools must be field and laboratory tested to establish the baseline of performance and its appropriateness or applicability to any given archaeological project or methodology. This is particularly crucial given that, as a commercial, “black box” device, the Capsure provides no guarantees:
the color matches given by the instrument are meant to serve as guidelines only. You should always visually confirm that the color specified by the instrument is an acceptable match to the sample. X-Rite is not liable and assumes no responsibility for inaccurate color identification by the instrument [X-Rite 2020:9].
We have found very few published archaeological studies incorporating Capsure data thus far (e.g., Roosevelt et al. Reference Roosevelt, Cobb, Moss, Olson and Ünlüsoy2015). Here, we present a systematic evaluation of the functioning of the device—its advantages and disadvantages for scientific data recording across three trial use scenarios. Fundamentally, we asked whether our color data would be more analytically useful if captured with the device's digital eye or by human eye. We initiated a series of three trials to judge the suitability of the device for archaeological applications, under (1) ideal sample conditions, (2) typical laboratory conditions, and (3) typical field conditions. For the first trial, we tested the device's ability to identify known colors by measuring the colors of all unique color chips in the MSCC (n = 436). In the second trial, we recorded colors of 140 fired pottery briquettes with both the instrument and with a trained observer using the MSCC. In the final trial, we analyzed colors of sediments in field conditions (n = 126), again recording both instrument and observer determinations via MSCC.
We addressed three main questions:
(1) How well does the instrument identify items of known color?
(2) How consistent or replicable are Capsure color readings of the same object or material?
(3) How do color readings by Capsure compare with those obtained by a trained observer using MSCC?
Through these trials, we looked for patterns in the data that would signal both instrument and human bias. We found that the results from the Capsure trials were not uniformly superior to methods traditionally considered “subjective.” Although in some ways the instrument produced more objective results with high consistency, it was also subject to bias that we cannot fully explain, and for which we cannot reliably compensate. These mismatches, predominantly of hue, were found across all three trials. Our data suggest that (1) the device may have biases toward certain color ranges and (2) results are also impacted by how much the sample matched the Capsure's ideal conditions. In the discussion, we provide guidance on which method of color determination may be best for a given project, and we offer recommendations on best practices. Ultimately, whether using the MSCC, the Capsure, or another technique, it is important for archaeologists to provide the same rigor, explanation, and justification for methods of color identification and quantification as expected for other methodologies (e.g., excavation strategies, artifact analyses, radiocarbon dating). Doing so is key to recognizing and mitigating the potential effects of human subjectivity or incongruent mechanical consistencies inherent in color assignment.
BACKGROUND
Munsell Color System
Albert Munsell, inventor of the Munsell system, equated color to music, arguing that if we were able to develop a scale and notation for sound, the same should be true for color (Munsell Reference Munsell1905). Munsell used numerous models to explain his system, ultimately settling on a solid cylinder-like form, representing all possible colors (Figure 1) and three variables. The first of these variables is hue. The solid is divided radially into five dominant (red, yellow, blue, green, purple) and five intermediate (yellowish red, greenish yellow, bluish green, purplish blue, and reddish purple) hues. Each can be further subdivided between 0 and 10, most commonly in steps of 2.5. The second variable, value, is represented by the spine of the solid, and it indicates the lightness or darkness of a color along a scale of 0–10. Zero represents the darkest possible color, and 10 the lightest. Moving outward from the center of the solid is the third variable, chroma, which represents the intensity or purity of color. The maximum possible chroma varies, depending on the hue and value. A tripartite notation consisting of [hue value/chroma] is used to identify a Munsell color. For example, 2.5YR 4/6 denotes a yellowish red with a value of 4 and chroma of 6.
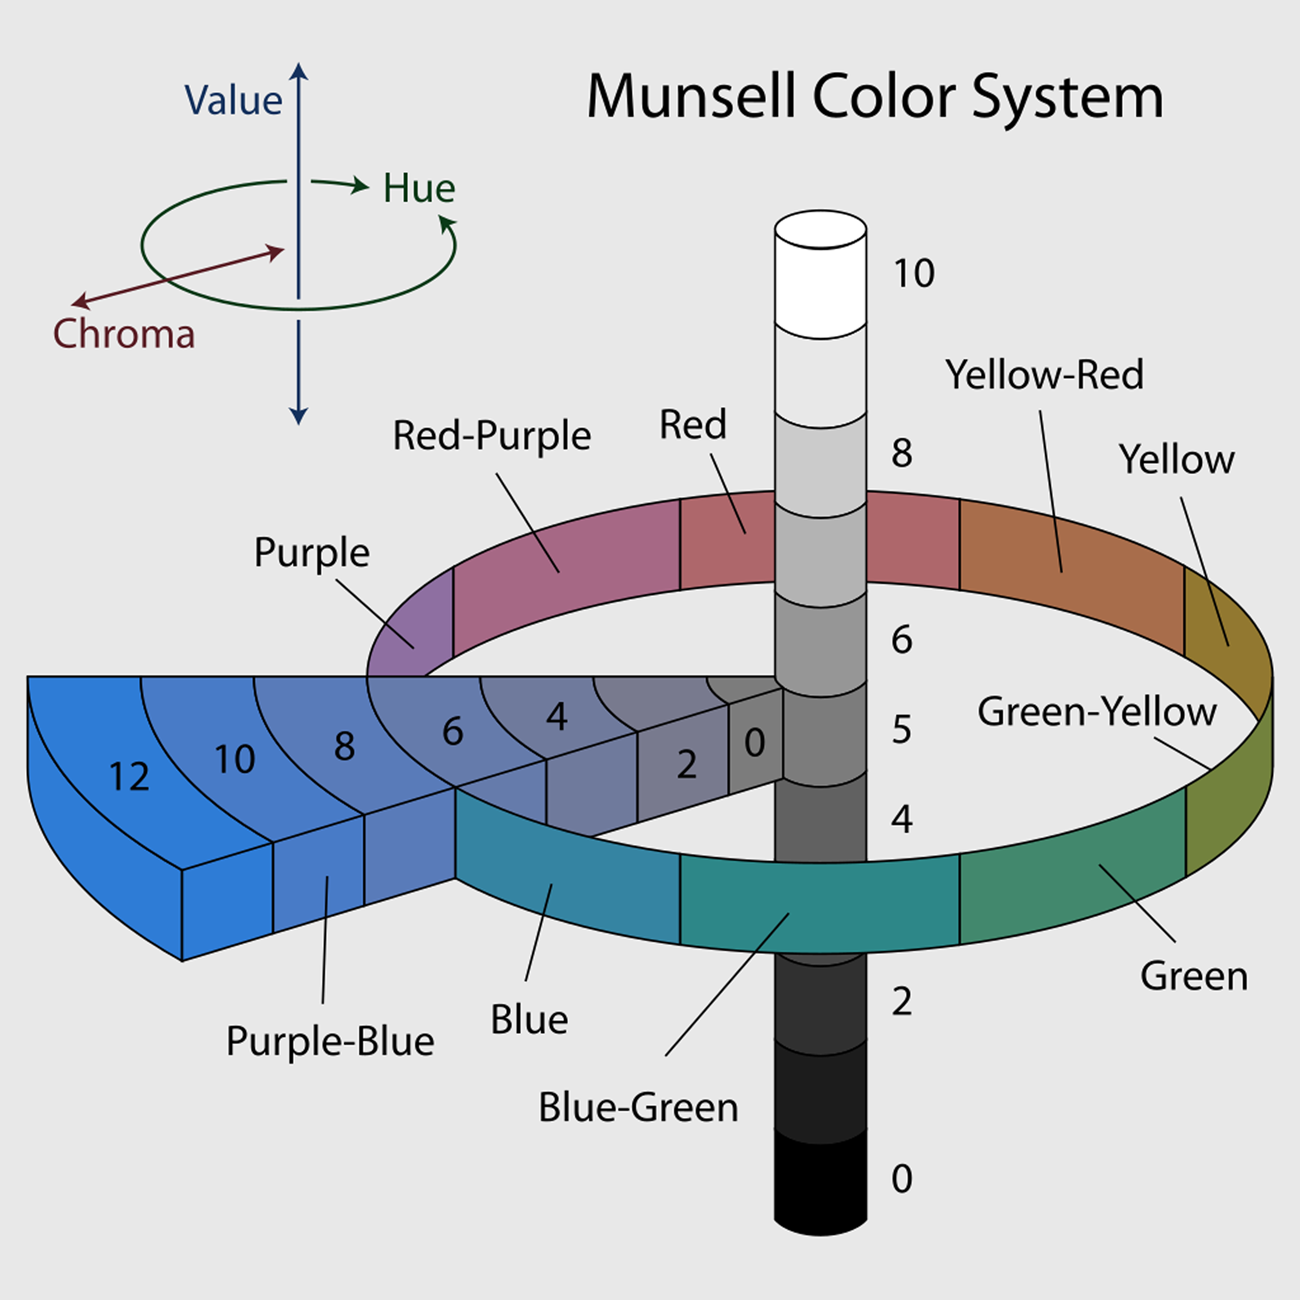
FIGURE 1. Schematic of Munsell color system. Illustrated by Jacob Rus, CC BY-SA 3.0 (https://commons.wikimedia.org/wiki/File:Munsell-system.svg).
Munsell in Archaeology
Until the early twentieth century, U.S. soil scientists and archaeologists had no system of color naming. They relied on simple binaries of light and dark, and basic descriptions such as yellow and red—when colors were described at all. In 1914, the U.S. Bureau of Soils published a guide suggesting 22 color names (Simonson Reference Simonson, Bigham and Ciolkosz2015). For the next 30 years, attempts at standardization continued, culminating with the adoption of Munsell terminology. In 1949, after lengthy testing and discussions largely overseen by the U.S. Department of Agriculture, the Munsell Soil Color Charts were first made available. They consisted of a small binder of colored chips, organized in the Munsell color system and focused on naturally occurring colors of soil. They were adopted by the International Society of Soil Science, and they continue to be the standard soil color classification scheme (National Soil Survey Center 2002). Over time, additional hues and color chips have been added to better represent the global range of soil colors. The most recent edition of the MSCC consists of 443 color chips (436 are unique), divided among 13 pages (Figure 2).
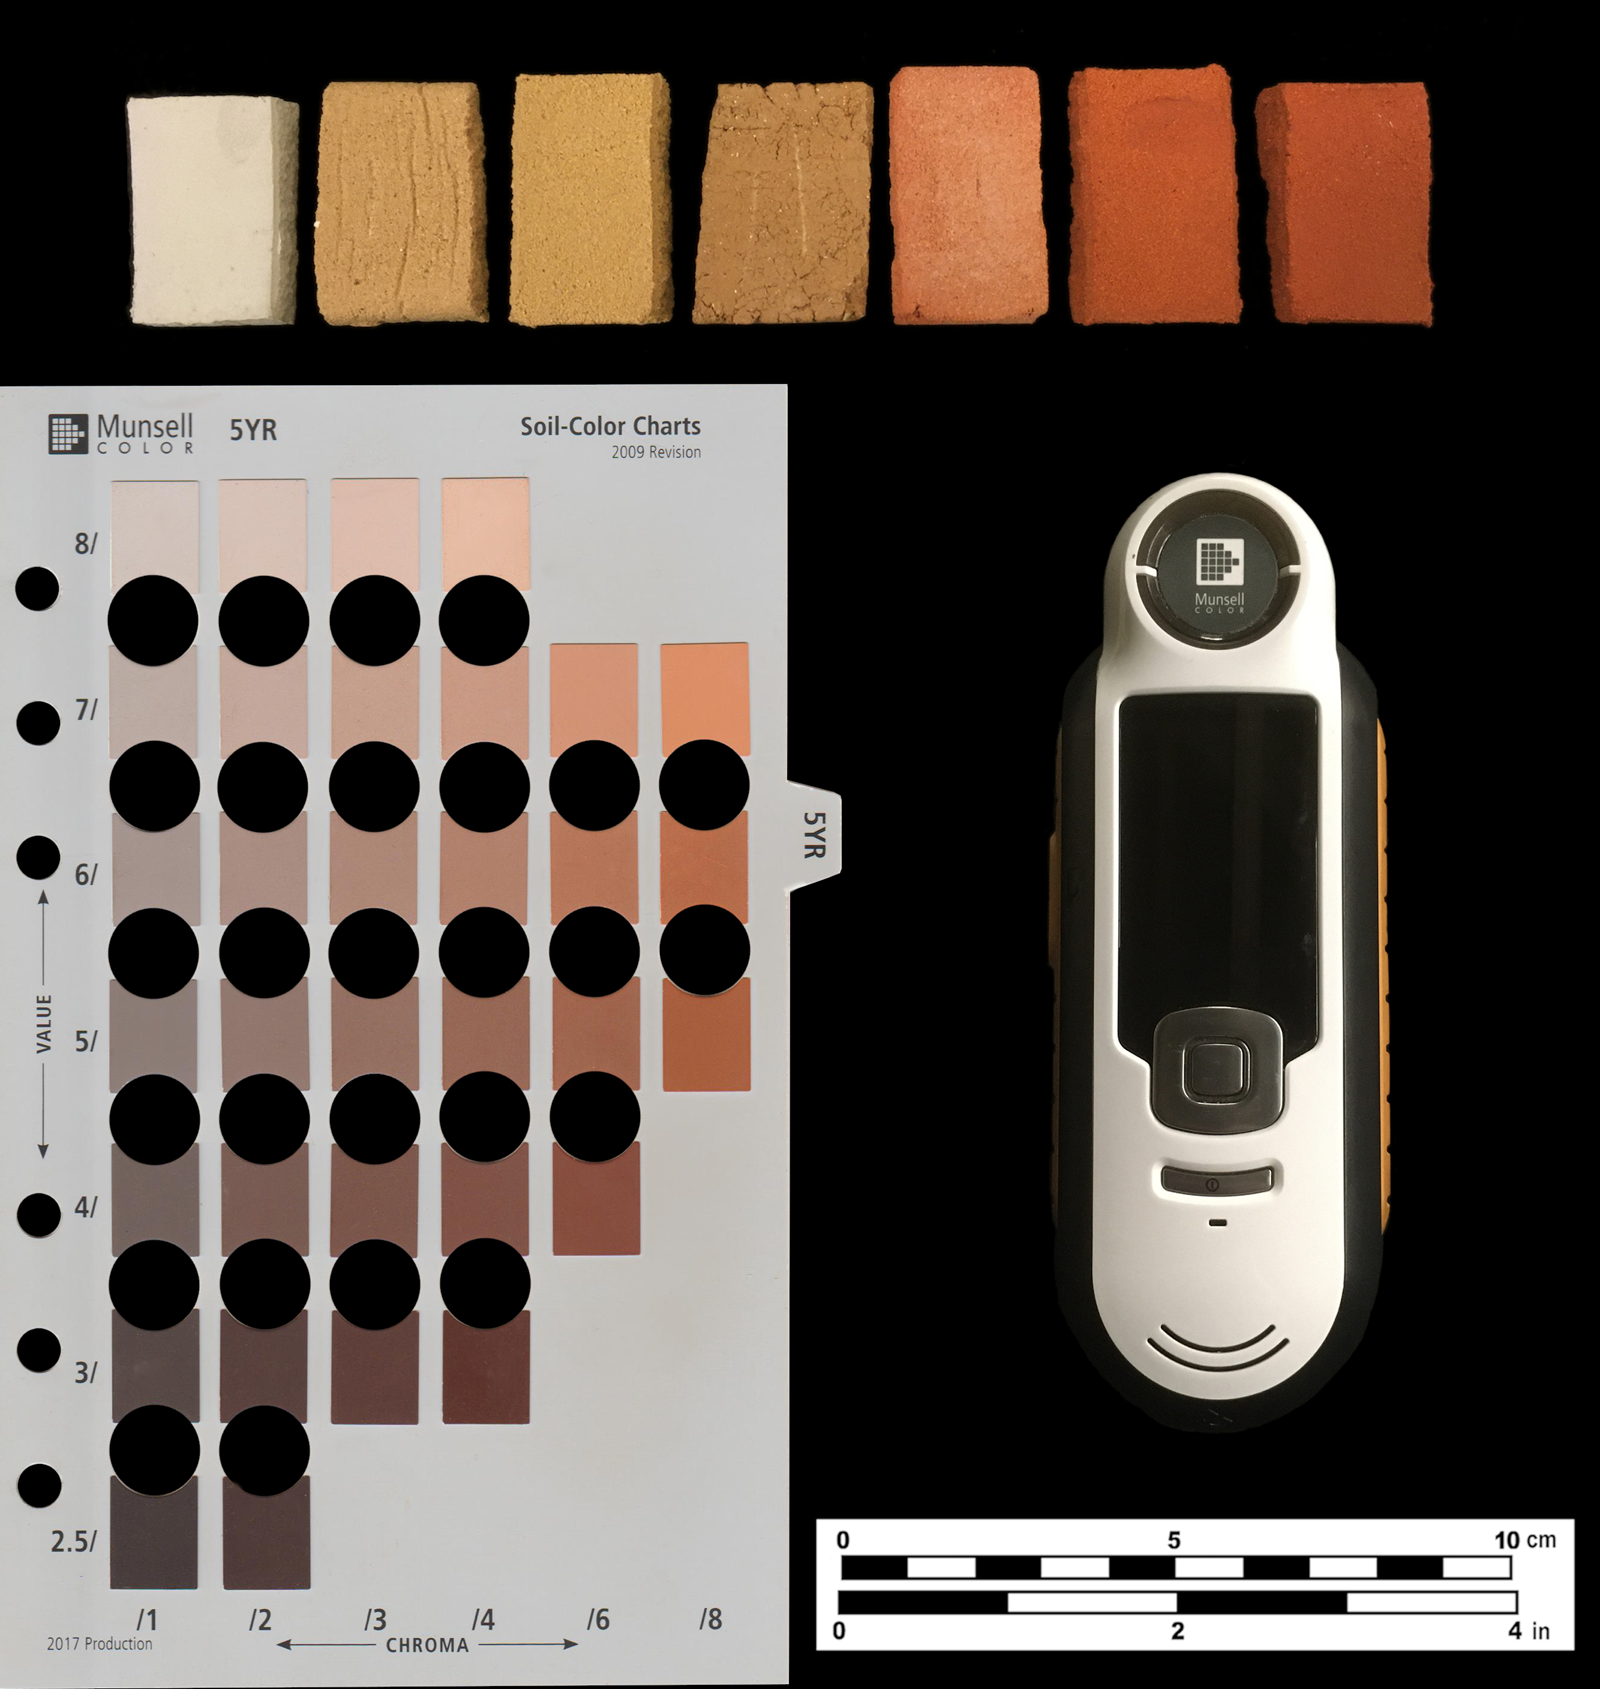
FIGURE 2. Page from the Munsell Soil color book, an X-Rite Capsure, and fired clay briquettes from Trial 2. Photograph by Lindsay C. Bloch.
In the MSCC, each page generally represents a single hue subset. For example, the hue yellowish red is divided in the MSCC into four pages: 2.5YR, 5YR, 7.5YR, and 10YR. Windows placed within the page facilitate direct comparison of a sample by aligning it to a chip. Each chip is denoted by a Munsell notation as well as a color name. Officially, Munsell color codes have no formal prose or vernacular name, although names have been adopted for the MSCC and suggested for other Munsell collections to aid in adoption of the system (e.g., Ferguson Reference Ferguson2014). The MSCC documentation indicates that the color name should always be provided alongside the notation (Munsell Color 2009). There are 82 unique color names, representing common vernacular names for soil color. Color names generally form clusters of chips on individual pages and many span multiple pages/hues.
Color Measurement Instrumentation
The Capsure is a handheld commercial spectrocolorimeter (Figure 2). It has point-and-click operation, requiring no special training. This device has been marketed not only to archaeologists but across a range of fields for which color is important, including interior design, marketing, and cosmetics. For each application, different color systems, such as Pantone and Munsell, and “fan decks” (i.e., color ranges within a color system) are loaded onto the instrument. These become the universe of colors that the specific instrument can identify and match.
The internal mechanism of the Capsure is a camera with a ring of 25 light-emitting diodes (LEDs; Wegmuller and Frick Reference Wegmuller and Frick2013). These are positioned to focus on different wavelengths and angles of light. When a measurement is initiated, a series of images is taken, illuminated using the LEDs. The images are processed internally using an algorithm to correct for sample optical properties—specifically, roughness—and then the dominant colors of the image pixels are determined and converted to a coordinate system. Iterative cluster analysis is conducted to reduce the results to a single dominant color, which is presented on screen in the nomenclature of the loaded color system (Wegmuller and Frick Reference Wegmuller and Frick2013). This entire process is completed in a matter of seconds. It operates with a default camera aperture of 8 mm, but this can be adjusted. The small digital display provides a preview image of the area under the detector and returns the color results.
One of the main issues of color perception is metamerism—the effect of different kinds of light sources on the way color is perceived. The Capsure accounts for this by operating flush against a sample, removing the interaction of ambient light, and producing different spectra of light internally through the LED array. The device for archaeologists is set to the default representation of noon indirect sunlight (D65/10°). Other iterations of the device have options to change the illumination to incandescent or fluorescent light settings. The covering for the instrument aperture is fitted with a white reference tile, which is used to calibrate the instrument before initiating readings, and at regular intervals (Frick et al. Reference Frick, Feri and Knechtle2012; X-Rite 2020).
The ideal samples for Capsure are dry, smooth, opaque, flat, and matte. Samples with curvature, metallic or pearlescent inclusions, and wet samples are nonideal. Given that many archaeological soils and sediments are moist and textured, and they contain reflective particles, archaeological samples are not ideal for the Capsure, or colorimeters in general. Our third trial examines how typical field archaeological materials work as Capsure samples.
METHODS
Trial 1: MSCC versus Capsure
We first tested the accuracy and precision of the instrument to identify Munsell Soil Color chips (MSCC; Munsell Color 2009). These chips present ideal subjects: each is flat, matte, and monochromatic. Every chip has a known Munsell notation, allowing us to verify the instrument's accuracy with a high degree of confidence. For soils, the X-Rite Capsure has been factory set to match its readings to three preloaded fan decks: Munsell Soil Colors, Munsell Matte, and Munsell Glossy, which we believe to be equivalent to items M50215B, M40291B, and M40115B, respectively (Pantone 2020). For these experiments, Munsell Matte and Glossy fan decks were deactivated so that only Soil Colors could be returned. The MSCC book used for testing was a clean copy of a 2009 edition, produced in 2017. It contained 13 individual pages and 436 unique color chips.
The instrument was calibrated using the white reference tile before starting every page, and by default, after every hour of instrument run time. The Capsure was set to the default aperture size of 8 mm. The internal camera was used to preview the testing area, ensuring that the instrument was positioned fully over the chip. We analyzed each color chip five times, shifting the location of the analyzer over the chip slightly to account for potential irregularities.
We assessed the results in several ways to determine the accuracy and consistency of the Capsure readings. For chips without matching instrument readings, we investigated the nature of these mismatches—whether of hue, value, chroma, or a combination of the three—and developed a tally of correct and incorrect readings. We scored the degree of mismatch in two ways. First, we scored distance within the Munsell system, treating the MSCC as a complete universe of possible soil colors. Given the hue ordering of the book from red to blue, we assessed direction of hue mismatch by MSCC page. Value and chroma mismatches were assessed numerically, as either higher or lower than expected.
Second, in order to conduct statistical tests based on a continuous linearly scaled metric, we converted the Munsell nomenclature to CIELAB values. The International Commission on Illumination (CIE) developed this color space in 1976, and it has been widely adopted (Westland Reference Westland, Chen, Cranton and Fihn2016). It is based on three numerical variables that can be plotted in Cartesian space: L* = lightness, a* = green → red, and b* = blue → yellow. Although the Capsure converts spectral data into numerical renderings as part of the matching process, those data are not made available to the end user. Only the matching tripartite Munsell notation is provided. To convert Munsell notations to CIELAB codes, we used the “aqp” package (Beaudette et al. Reference Beaudette, Roudier and O'Geen2013) in R (version 3.6.0). This conversion generated three continuous color variables that could be plotted. We also used CIELAB conversions to compute Mahalanobis distances (MDs) between expected color reading (MSCC) and dominant obtained color reading (Capsure). These distance calculations represented how far apart the two readings were in three-dimensional space. A Mahalanobis distance of zero represented an exact match. As MD increased, colors were less similar.
Trial 2: Fired Clay Color Determinations
For this test, we evaluated the colors of fired clay objects by observer and Capsure. We selected 140 briquettes from the Florida Museum's Ceramic Technology Laboratory's clay collection of Florida, representing a range of colors and textures commonly found in clay resources of the southeastern United States (Cordell et al. Reference Cordell, Wallis and Kidder2017). Each clay sample was formed into a briquette of uniform size when wet (3 × 4 × 1 cm) and fired to 600°C. This resulted in an object with a smooth, dry, matte surface, which presented desirable conditions for Capsure use (Figure 2).
First, one trained researcher used the MSCC to identify the color for each briquette. Samples were analyzed directly under a natural light lamp to provide the recommended viewing conditions for the MSCC (Munsell Color 2009) and approximate the internal lighting conditions of the Capsure. Due to laboratory constraints, ambient fluorescent light could not be fully excluded. For user consistency, Lopez completed all MSCC color determinations. Next, Bloch analyzed each briquette using the Capsure, following the procedures described for the chips in Trial 1. Five measurements were taken for each sample. Consistency of Capsure readings as well as matches and mismatches with MSCC were then assessed.
Trial 3: Field Specimens
The third test, comparing the instrument and MSCC readings, was undertaken during the course of fieldwork in December 2019, in Long Island, The Bahamas (Figure 3). This project at the Wemyss site (LN-8) has focused on the excavation of domestic spaces and activity areas of the Lucayans, the first settlers of the Bahama archipelago. Generally known only from low-density surface scatters of artifacts, the Wemyss site is one of the best-preserved Lucayan sites in the archipelago, with stratification and features providing evidence for multiple occupations around AD 1184–1552 (2σ extremes for six AMS dates spanning the occupation; Beta 514248-514253).
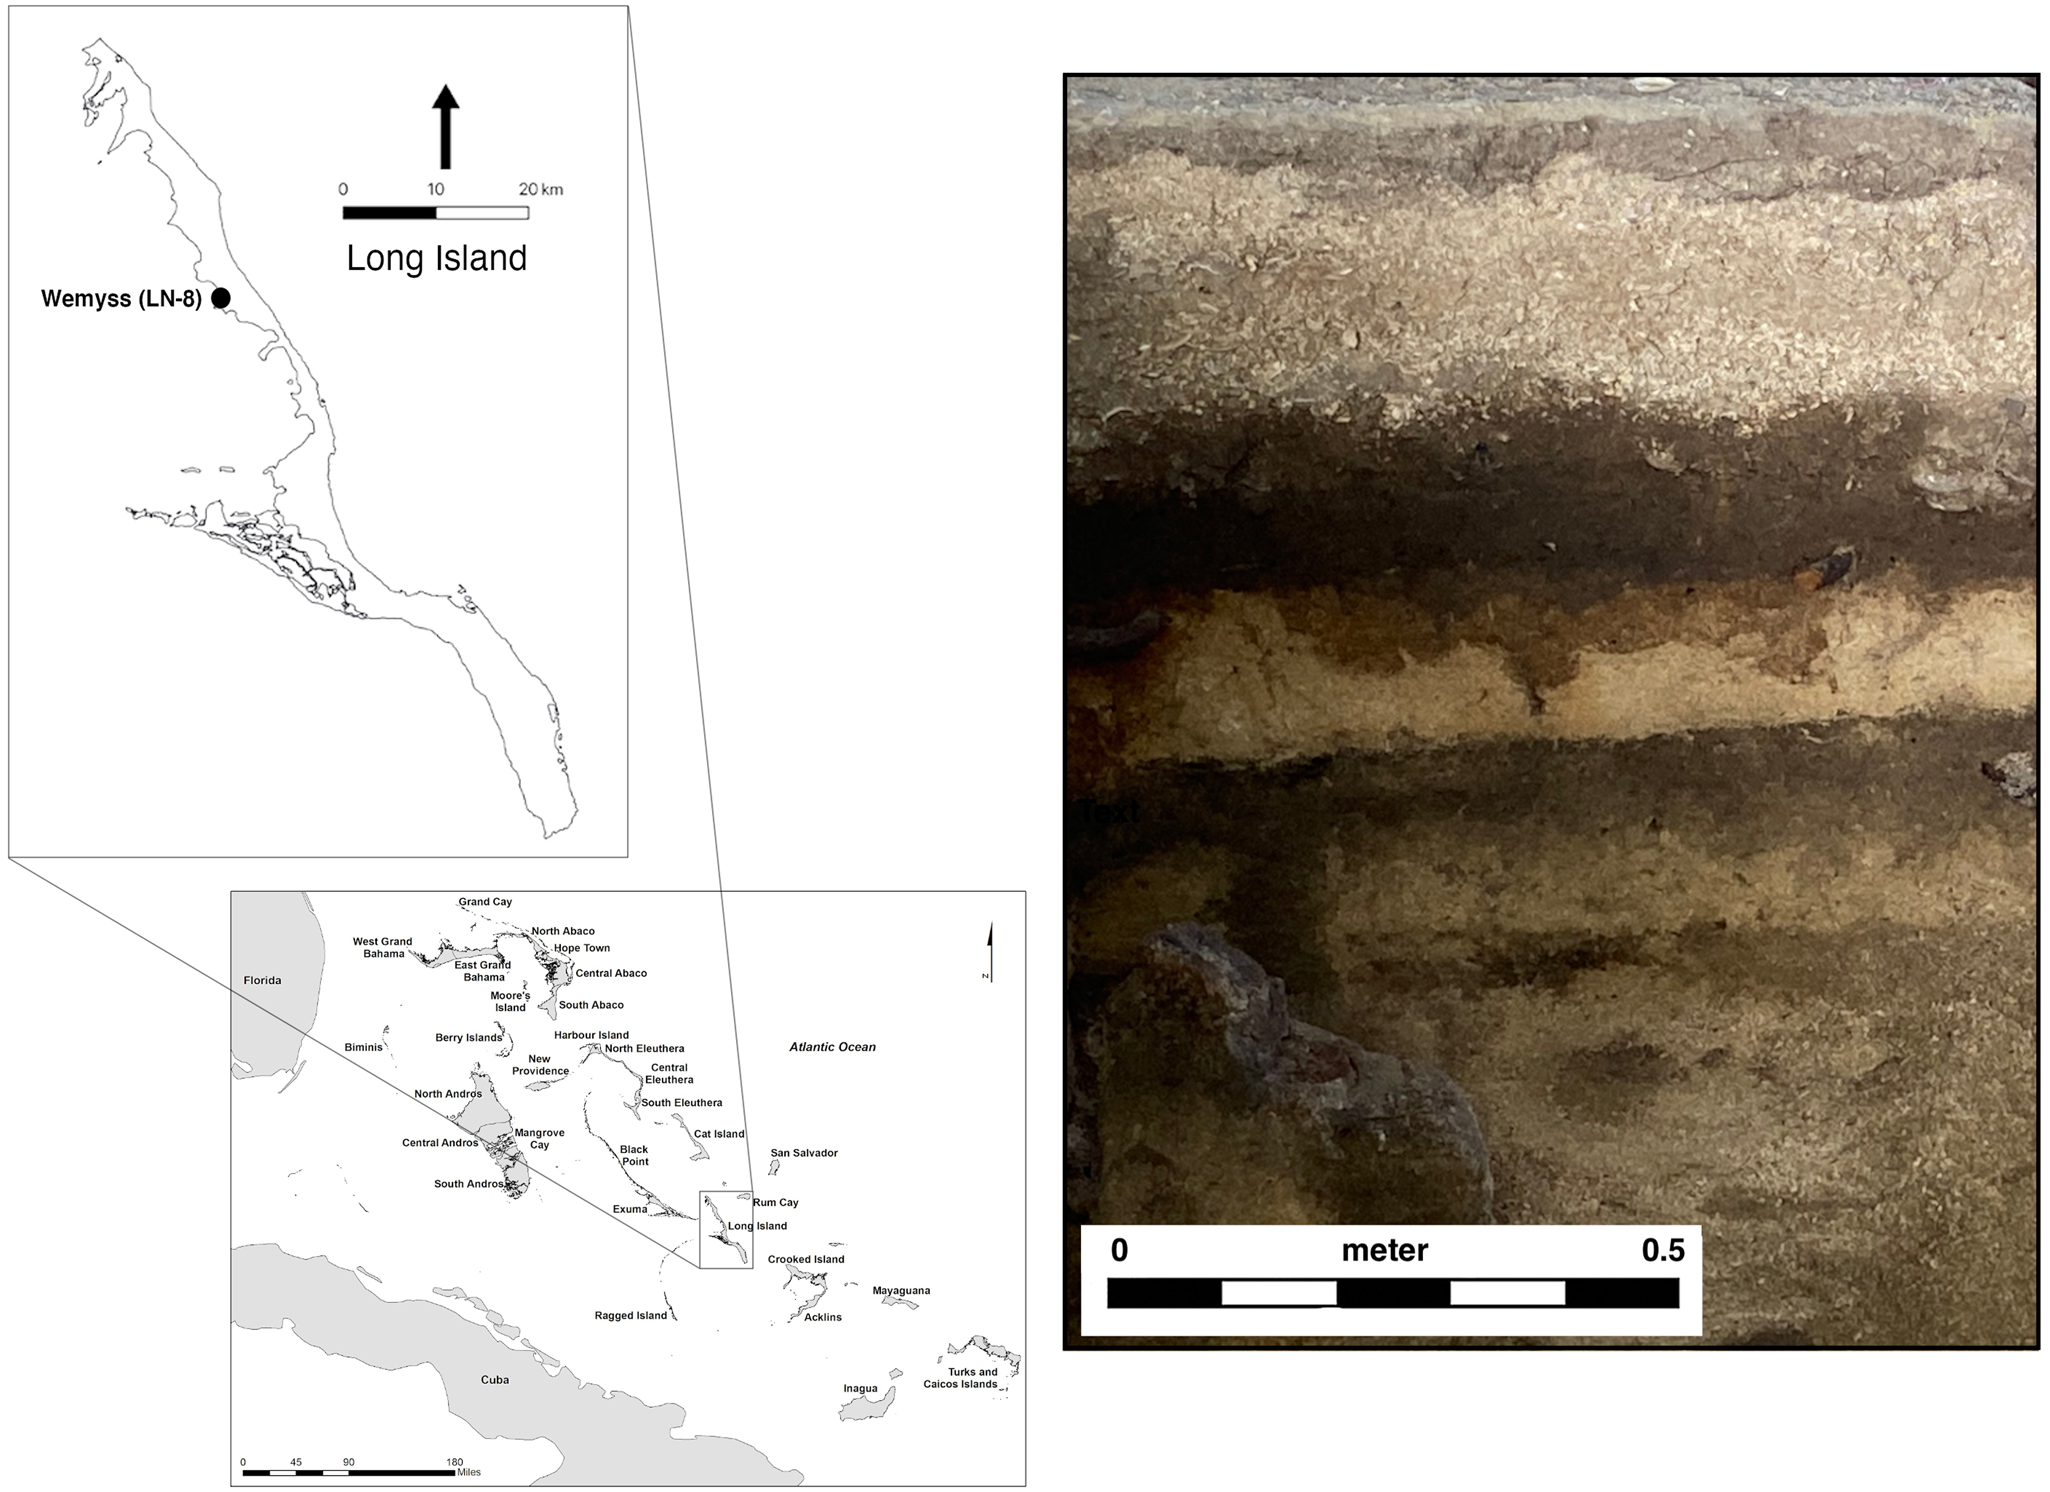
FIGURE 3. (left) Location of Wemyss site on Long Island, The Bahamas; (right) excavation profile at Wemyss showing alternating strata of dark organic midden and light beach wash. Photograph by William F. Keegan.
In tandem with unit excavations, 39 shovel tests were excavated along a grid at the site. The shovel tests consisted of 50 cm round holes, excavated to bedrock, which ranged from 15 cm to 78 cm below surface. Natural boundaries were recorded within shovel tests, resulting in the description of 1–5 distinct strata for each test. A total of 126 strata were individually observed across the 39 shovel tests, which could be correlated to sitewide natural and cultural levels. Natural strata included layers such as beach wash of sand and unsorted sediments from storm events, and cultural strata included dark midden deposits with abundant shell and other food remains.
Two observers conducted all shovel test recording, including color determination for the soils and sediments. The deposits were field moist when tested. Readings were taken under sunny conditions throughout the field day (8:00 a.m.–3:00 p.m.). Scraping sediment from the side of the pit onto a trowel, Kracht and Woodcock first recorded the color for each stratum using the MSCC and then measured the color with the Capsure. Each sample was measured with the Capsure from two to five times, until a duplicate reading was achieved. Only the final reading was recorded. Consistency of readings, matches, and mismatches were then assessed.
RESULTS
Trial 1: MSCC versus Capsure
We established that in order to be designated correct, the Capsure readings had to match the chip color exactly in at least three instances out of five. This resulted in a total of 274 correct (62.8%) and 162 incorrect (37.2%) readings (Supplemental Table 1). For 149 of those incorrect chips (34.2%), the instrument provided 0 exact matches. We defined consistency based on whether the Capsure returned identical readings when analyzing the same sample, regardless of whether the readings were correct in terms of chip color. Overall, the Capsure was very consistent, returning five identical readings for 387 of the 436 chips (88.6%).
Hue was by far the most common point of mismatch (Table 1). Of the 162 incorrect or mismatched chips, the instrument returned an incorrect hue reading 75.3% of the time, significantly more than value and chroma according to χ2 test post hoc comparisons (p < 0.0001; Benjamini and Hochberg Reference Benjamini and Hochberg1995; Supplemental Table 2). There was notable directionality to this mismatch. When measurements of hue were reported incorrectly, a higher hue reading—that is, one or more pages forward in the MSCC—was returned for 82 samples (50.6%), significantly more than hue readings returned that were lower (27.4%; p < 0.0001). Given the hue order of colors from red → yellowish red → yellow, this means that the Capsure routinely identified more yellow in color chips (Figure 4). Furthermore, the probability of obtaining a matched reading was greatest within the midpoint of hue families, with a hue prefix of 5-. The chips in the center of each hue range represent the purest examples of the hue, with the least amount of gradation into adjoining hues.
TABLE 1. Type of Mismatch for Capsure Readings, Compared to Munsell Soil Color Charts (MSCC).
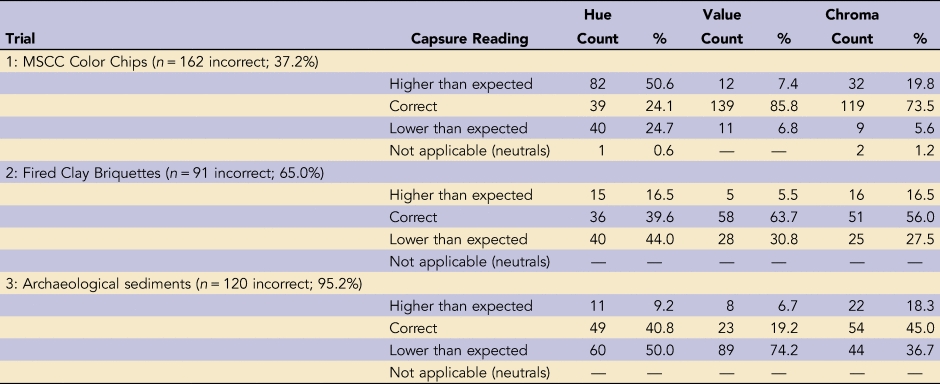

FIGURE 4. Trial 1: Mahalanobis distances between MSCC chip color and color assignment made by Capsure, organized by book-assigned hue of each chip. Only distances for nonmatching samples are plotted (n = 162). Letters indicate the group assignment by using Tukey post hoc comparisons of the LM comparing distance by hue. Each point is plotted with sample MSCC chip color.
The majority of samples had low mismatch according to color value, with a few outliers (Figure 5). Colors with a value of 4/ were most likely to match (n = 63; 79.4%), whereas less than 50% of colors with a value of 7/ or greater (n = 142) matched, indicating instrument difficulty in detecting lighter colors. Overall, the majority of mismatches were in only one variable (138; 85.2%). There were only two mismatches of all three variables (1.2%).
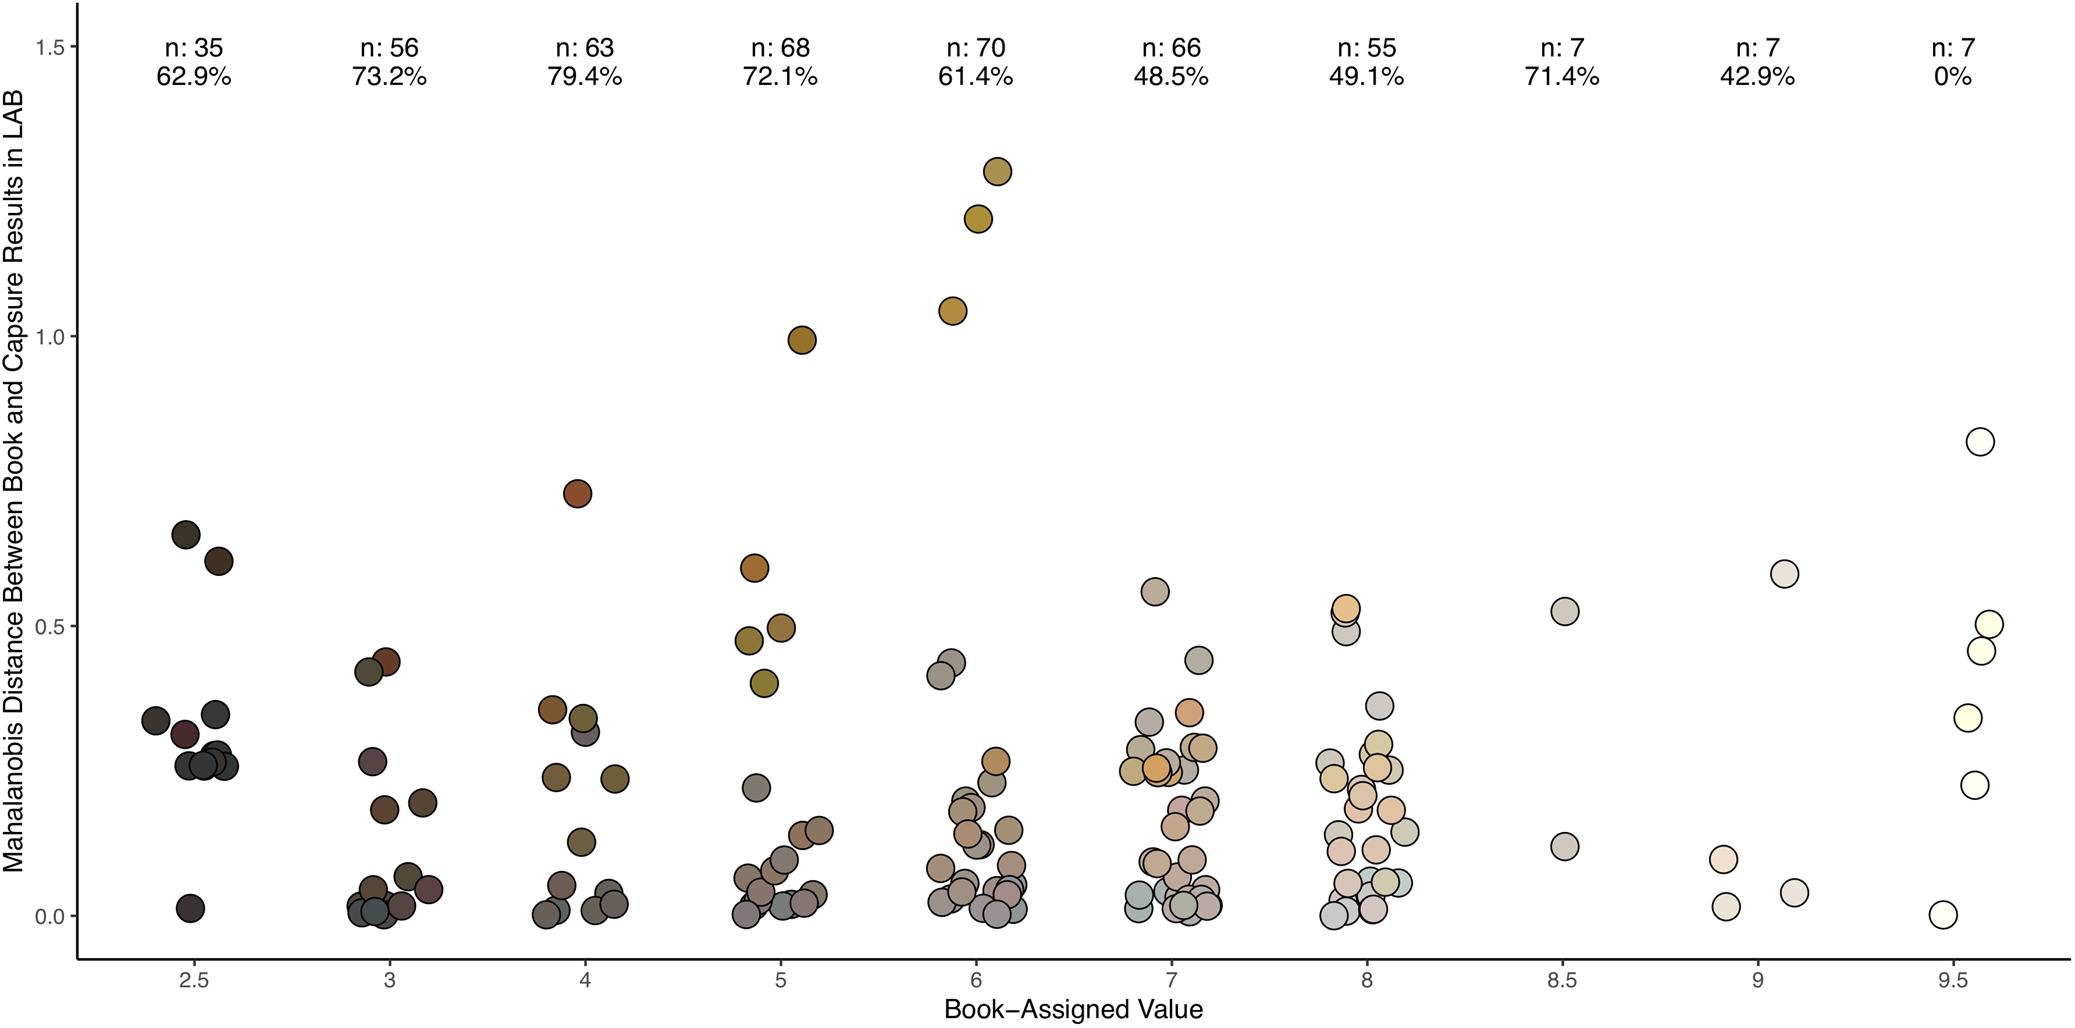
FIGURE 5. Trial 1: Mahalanobis distances between MSCC chip color and color assignment made by Capsure, organized by book-assigned value of each chip. Only distances for nonmatching samples are plotted (n = 162). For each level of value, the total number of samples analyzed and the percentage of these samples that were correctly identified by the Capsure device are presented. Samples with mid-range values had the highest percentage of matches, but also the largest MDs. Each point is plotted with sample MSCC chip color.
Kirillova and colleagues (Reference Kirillova, Grauer-Gray, Hartemink, Sileova, Artemyeva and Burova2018) converted Munsell values for 415 MSCC chips into CIELAB values using reference illumination of D50 and assessed their difference. Using the difference formula ΔEab* = ([L1* − L2*]2 + [a1* − a2*]2 + [b1* − b2*]2)1/2, they determined that 196 of the color chips had at least one duplicate within the MSCC, which means that the differences between the two chips may not be perceptible to the human eye (ΔEab* < 3). We considered whether our mismatches between MSCC and Capsure reading could be due to these duplicates, representing instances where the instrument returned a functionally identical color. When we converted Munsell colors for all 436 chips to the CIELAB system—using a reference illumination of D65 to match the reference illumination of the Capsure—and calculated their difference, 182 chips had functional duplicates with ΔEab* < 3. Most duplicates were low chroma (chroma ≤ /3; n = 170), indicating perceptual difficulties in distinguishing colors of low intensity.
Considering the mismatched chips specifically, fewer than half of the 162 mismatches were functional duplicates (n = 73; 45.0%). All duplicates were identical in value and chroma. In part, this is because lightness, the variable equivalent to value in the CIELAB color space, is expressed in intervals that exceed the numerical threshold for duplicates. For the remaining 89 chips, the Capsure did not return any accepted duplicates, instead identifying a color chip with ΔEab* > 3. Contrary to expectations, when the Capsure provided an incorrect color, it was more likely to provide an alternate color that was significantly different from the expected color, which means that the colors should be readily distinguished by the human eye. We consider alternate explanations for these instrument mismatches below.
Trial 2: Fired Clay Color Determinations
The recorded colors via Capsure spanned eight MSCC pages, with the majority falling within the 2.5YR to 10YR hues (Supplemental Table 1). The colors determined by the observer spanned seven MSCC pages, also with the majority falling within the 2.5YR to 10YR pages. When comparing color assignments made by Capsure to those made by manually referencing the MSCC book, only 49 of 140 samples were matches (35.0%) with at least 3/5 instrument readings identical to observer results; 91 were nonmatches (65%).
Of the mismatches, hue was again the most common mismatch (Table 1). Unlike in the case of the chips, however, it was far more common for the device to report redder hues rather than yellower hues (Figure 6). Value was the least common mismatch, and the instrument tended to report darker values. Chroma mismatch was significantly higher than in Trial 1, and the Capsure tended to report lower intensity of color than the human observer.
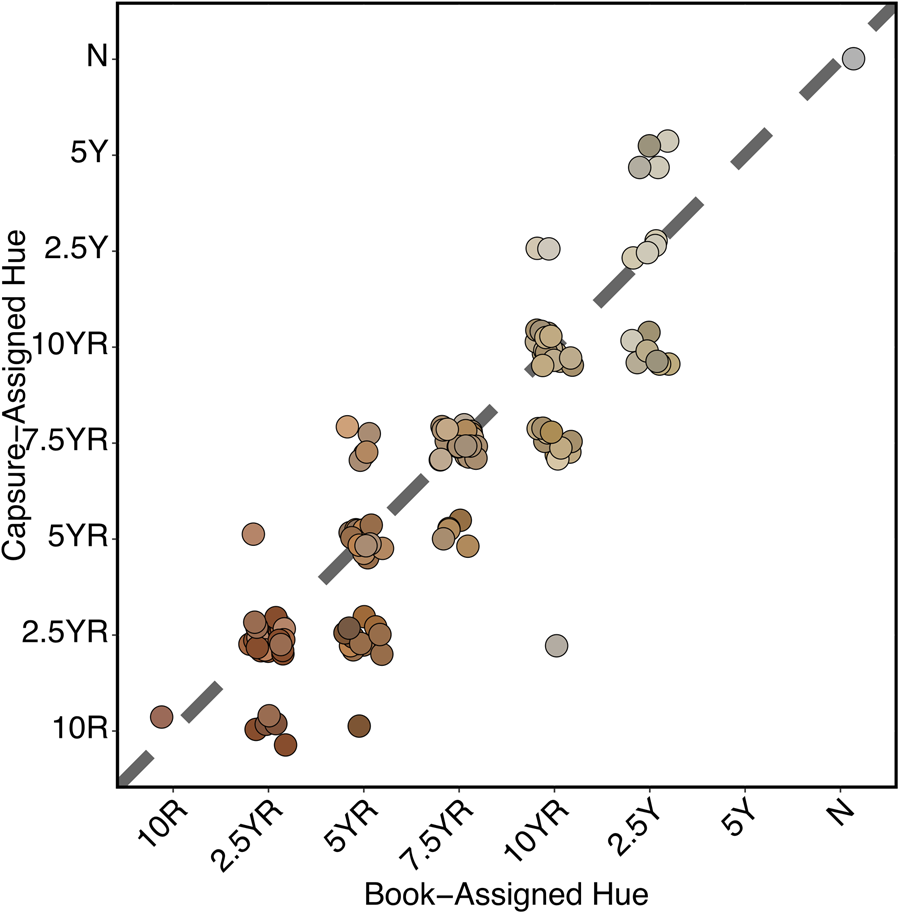
FIGURE 6. Trial 2: Scatterplot of MSCC sample hue reading by Capsure reading. Colors represent MSCC readings. Capsure readings tend toward redder hues. This was supported by a significant overall test (χ2 = 30.9, df = 12, p = 0.0020). For book-assigned hues of 5YR (p = 0.0423) and 10YR (p = 0.0384), Capsure-assigned hues were significantly more likely to be misassigned as more red than yellow according to post hoc exact tests conducted with Benjamini and Hochberg (Reference Benjamini and Hochberg1995) corrections for multiple comparisons. Each point is plotted with sample MSCC chip color.
Notably, estimates by Capsure and MSCC reading showed 100% agreement on prose color name for all fired clay briquettes identified as “red” (n = 28). This color name is associated with eight separate Munsell notations. The specific Munsell notation differed between device and MSCC determination for all “red” briquettes except for 2.5YR 5/8 (n = 5), for which there was complete agreement. This suggests that identification of the red color range is generally consistent between instrument and observer, and in particular, that perception of high chroma red is less ambiguous for both instrument and human eye compared to colors with lower chroma.
Given the low level of agreement between methods, we questioned whether the presence of inclusions may have influenced the color determinations of fired clays via Capsure. The manufacturers specify that prismatic surfaces are not ideal because they reflect the light in ways that are difficult for the instrument to correct. We hypothesized that the density of inclusions, particularly reflective quartz sand grains, may impact Capsure readings, perhaps explaining the larger discrepancies in hue and chroma results between the Capsure and human observer. For 66 of the samples, we had grain size data, which quantified the proportion of sand-sized particles and other inclusions compared to silt and clay-sized particles that produce a very fine-textured briquette. Quartz sand is a very common inclusion in soils and sediments generally, but especially in the sedimentary geological deposits of Florida. It ranged from 10% to 80% of the total weight for the sampled sediments. However, we found no correlation between the density of quartz sand or other inclusions and the Mahalanobis distance between MSCC and Capsure readings (Supplemental Table 3). Although the presence of prismatic inclusions may impact Capsure color determination, it is not a predictable relationship.
There was overlap in which colors were misidentified in Trials 1 and 2. Of the 47 unique colors identified via MSCC in Trial 2, 22 of them were identified incorrectly by Capsure in Trial 1 and mismatched in Trial 2. All shared high value ≥6, and most had a low chroma ≤4. Only four colors were matched correctly in all instances in both trials.
Trial 3: Field Specimens
All of the Munsell color determinations for shovel-test sediments had a hue of 10YR (Supplemental Table 1). When working in a region with fairly simple geology, it is not uncommon for sediment color to be consistent in this manner, but we acknowledge that observer bias may have contributed to the reported homogeneity. Long Island, like the rest of The Bahamas, is composed of limestone bedrock with a thin layer of incipient soil developing atop it. Aside from isolated pockets of red Saharan dust that are deposited by Atlantic winds (Sealey Reference Sealey2006:113–115), soils and sediments across the island tend to be pale in color (high value) and lack chroma (Figure 3). In stark contrast to the MSCC readings, the Capsure reported colors of five different Munsell hues.
The Capsure and observer determinations matched in only six instances (4.8%). Of the remaining 120 samples, although 10YR was the single most common hue (49 samples, 40.8%), 60 samples were reported from redder hues. The same color value was reported in less than 20% of instances, with most of the values via Capsure falling in the darker range (74.2%; Table 1). Chroma was the most consistent variable in this trial, and it matched between MSCC assignment and Capsure reading for nearly half of samples (n = 54).
Given the wide disparity of these readings, we were curious to know what factors may have been affecting both the observers’ perception and the instrument operation. Kracht and Woodcock noted that for samples that were wetter, it was difficult to obtain consistent Capsure readings. As the Capsure documentation indicates, ideal samples should be dry. This is in direct contrast to MSCC guidelines, which recommend moist samples (Munsell Color 2009).
Compaction and composition may also have been an issue. These Long Island deposits tended to be loose, with abundant carbonate sand and small shells. In particular, the beach wash deposits from storm events consisted of approximately 90% finely crushed shell and small marine gastropods. These deposits are notably paler in color than layers deriving from incipient soil formation or human deposition, both of which have higher quantities of dark organic material and finer particle size. In Figure 7, shovel-test strata are presented according to level interpretation. The MD values were notably higher for beach wash deposits, indicating more mismatch. The Capsure reported much darker values for most of these levels than they appeared to observers.
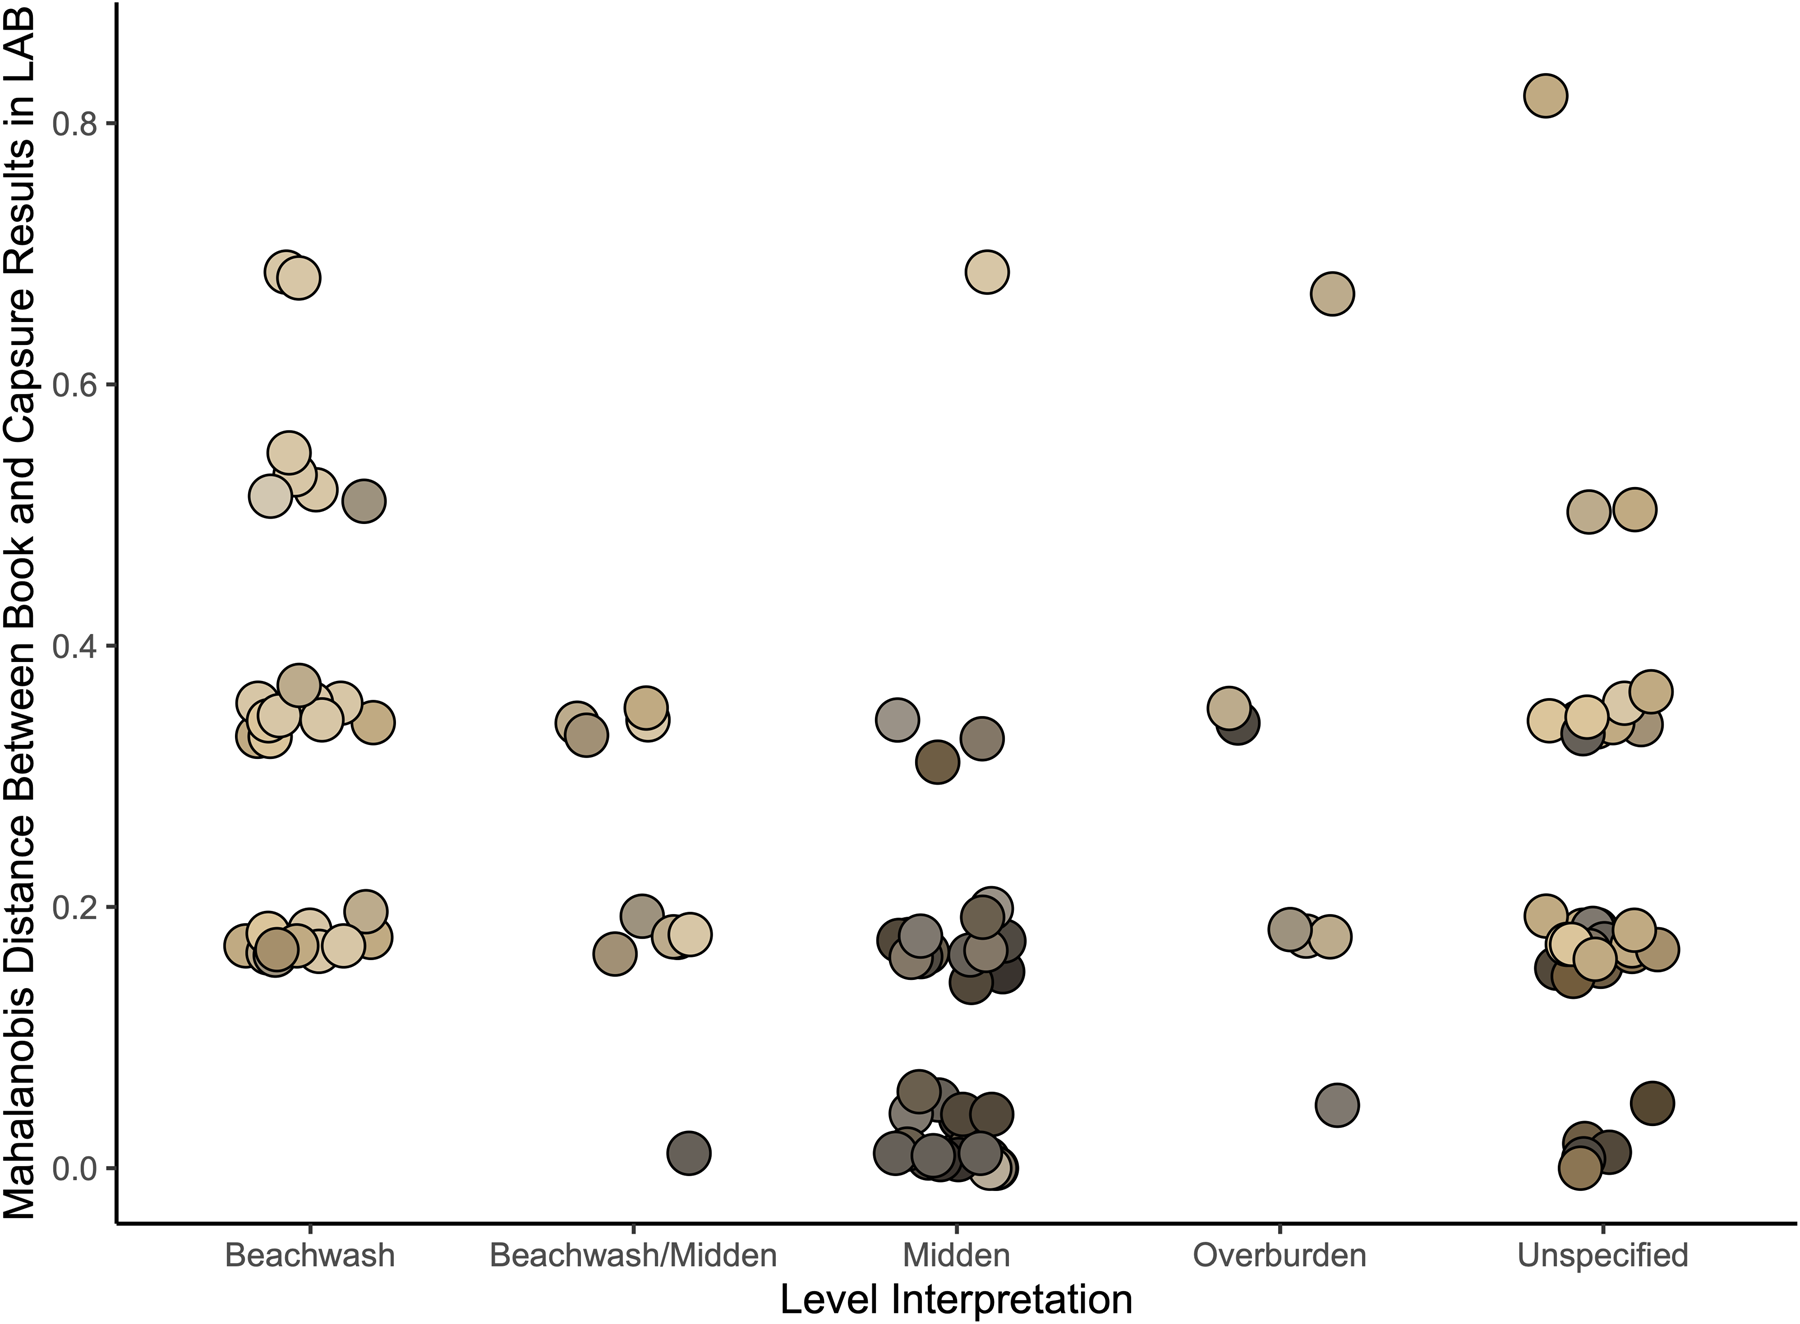
FIGURE 7. Trial 3: Excavation level type by MD of MSCC readings to Capsure readings. Color determinations for beach wash deposits (n = 29) were all mismatched in at least one variable. Generally, Capsure reported darker values. Compact, darker middens had lower MDs. Each point is plotted with sample MSCC chip color.
DISCUSSION
Through this series of trials, we tested the capacity of the Capsure to return quality archaeological data. By some metrics, such as consistency, the device was very successful, yielding the same result for a sample in repeated assays. Replicability is an important feature of scientific testing. In Trial 1, the Capsure returned 5/5 consistent readings for 88.6% of chips, and over 70% of samples in Trial 2. This is an indication that the camera eye was consistently recording the same information and that information was being processed in the same way by the device for these uniform samples. This device was successful at recognizing that multiple assays were the same color, although it was not always identified as the correct color.
Users and potential users should note, however, that although significantly better than random (Supplemental Table 2), the accuracy of the color assignments generated by the instrument in Trial 1 was inconsistent when tested against known colors for which it was likely specifically calibrated. This may be due to detector bias, systematic processing errors, or calibration limitations that result in deviations from expected color matching. Specifically, we found that in Trial 1, the Capsure tended to overreport yellower hues but became more accurate when the hue of the known color was yellow (Figure 4). This bias toward the yellow end of the spectrum must be (a) a calibration problem of the Capsure, or (b) a quality control issue of the Munsell Color chips (Sánchez-Marañón et al. Reference Sánchez-Marañón, Huertas and Melgosa2005). Without having access to the instrument calibration settings or materials, we are unable to determine the source of the error at this time.
In Trials 2 and 3, comparing Capsure readings to observer determinations, the bias went the opposite way: the Capsure presented fired briquettes and sediment samples as more red than human observations. In a detailed study of light conditions using a spectroradiometer, Sánchez-Marañón and colleagues (Reference Sánchez-Marañón, García, Huertas, Hernández-Andrés and Melgosa2011) found that different daylight conditions could either redden or yellow Munsell color chip determinations. This suggests that perhaps observer light conditions were substantially different from the internal Capsure conditions, resulting in yellower readings. Alternately, the mismatch may be due to the attributes of the samples varying from ideal Capsure conditions. Further research is needed, using alternate color determination methods such as a spectrophotometer to determine the source of the discrepancy. Regardless of the source of these mismatches, they indicate that the two methods are not directly equivalent.
It is notable that in Trial 1, the Capsure reported significantly fewer unique colors than are represented by color chips—351, even though a total of 436 unique color chips were analyzed. Although the discrepancy is partially explained by the presence of functionally duplicate colors, that resolves slightly less than half of the incorrect readings. This lumping of unique colors reduces the working range of the MSCC universe and may result in the instrument failing to provide unique colors for similar sediments that would be visibly different to the naked eye, just as the color chips are visibly different. This was the case in Trial 2, in which the observer noted 47 individual colors within the 140 samples, and the instrument detected only 39 individual colors. The result was different for Trial 3, where the Capsure identified twice as many unique colors as observers (44 vs. 22), although our results indicated that at least some of these readings were based on instrumentation issues from nonideal samples.
Our findings emphasize that in choosing between the MSCC and the Capsure, there is unavoidable trade-off between accuracy and consistency. The Capsure is a less flexible instrument than the human eye, unable to overlook irregularities such as moisture or loosely compacted sediments. Our eyes also benefit by having the full range of a hue on a single page. Although we may have difficulty selecting a color in isolation, we can generally recognize when we are literally on the right (hue) page and narrow down from there. The color-matching algorithm of the Capsure cannot conduct these coarser-grained assessments. Yet, the instrument was able to provide consistent color assignments. Such consistency might be possible if color assignments with MSCC were done by only one person, but it is unlikely to be attained if multiple workers are responsible for making color assignments (e.g., Ruiz and Pereira Reference Ruiz and Pereira2014).
CONCLUSIONS
Given our findings, we advocate for increased critical evaluation, description, and justification of color identification methods and methodology in archaeological practice. As advances in color recognition technology increase, including the rapid development of artificial intelligence pattern recognition relevant to archaeology (Barceló Reference Barceló and Elewa2010), archaeologists may need to reconsider the nature of “standard” approaches to color identification in both field and laboratory settings of data collection. Specific to our study and three trials, we recommend that archaeologists consider the following questions when determining whether to adopt the Capsure or MSCC for color recording:
(1) Will your samples fulfill most or all of the ideal conditions for Capsure? In particular, dry and compact samples performed better than moist and loose samples. Very dark or very light samples (value) may also be problematic.
(2) Is accuracy or consistency your primary goal? Using the MSCC or another method may still be best if accuracy of color is important, given how poorly field samples tend to match the ideal Capsure specimens. If colors are being used only for general purposes, however—such as to broadly differentiate highly visible strata—Capsure results are likely to be consistent.
Furthermore, we strongly suggest that practitioners complete an entire project either using only one method for color determination or with complete duplication. Our trials have shown that results between the two tested methods are not directly comparable or interchangeable. If one is using the Capsure, it is also preferable to take multiple readings per sample in order to establish a median reading. Given the speed of analysis, this should not present a time constraint.
There are other devices available—spectrometers and colorimeters that can be taken into the field. These instruments may be able to provide more accurate results, but at this point, the cost is likely to be much higher than either Munsell product. Their use would also necessitate a shift from the Munsell color notation system to a more quantitative but less intuitive system. If color assignment does not need to be referred to in the field using a readily intelligible code such as the tripartite Munsell notation, then one of these instruments or a photographic method may be an appropriate choice.
The results of our Capsure trials demonstrate that this instrument is not a simple replacement for human observation. The Capsure is a tool that may be used by archaeologists, but it is not a tool made for the practice of archaeology. By this, we mean that the instrument has not been optimized for the types of samples we may wish to analyze, nor can it provide the raw data and flexibility we may desire. Nevertheless, there are still instances in which the Capsure may be preferable—for example, in an environment where ambient lighting conditions are very poor and consequently not conducive to MSCC readings. Investigators must carefully consider their research objectives and their field or laboratory situation to determine which method for color identification will produce the results they require.
Acknowledgments
We are especially grateful to our long-term volunteer Michael Dion, who gave us the instrument as a gift. Meghan Marley (Ohio History Connection) assisted with its initial use. We are indebted to James and Sharalyn Knowles for allowing us to dig up their property and for their invaluable assistance. Michael Pateman and Vanessa Forbes-Pateman collaborated on the excavations. Omar Adderley, Thomas Hamilton, Sylvia Chappell, and Chris and Cheryl Kierst assisted in field. Ms. Kim Outten-Stubbs and Dr. Grace Turner of the National Museum of the Bahamas / Antiquities, Monuments, and Museum Corporation (Nassau) granted permission to conduct this research. The Wemyss project was supported by funding from the Caribbean Archaeology Fund (University of Florida) and participant contributors. We thank the three anonymous reviewers for their helpful feedback. Open access publishing was supported by the Caribbean Archaeology Fund.
Data Availability Statement
Data are archived in the University of Florida Institutional Repository, available to view and download via the following permalink: https://ufdc.ufl.edu/IR00011296/00001. Supplemental materials for this article are also archived in the University of Florida Institutional Repository.
Supplemental Materials
Supplemental Table 1. MSCC and Capsure Matching (https://ufdcimages.uflib.ufl.edu/IR/00/01/12/96/00001/Supplemental 1-MSCC_Capsure_Matching.xlsx).
Supplemental Table 2. MSCC and Capsure Matching Significance (https://ufdcimages.uflib.ufl.edu/IR/00/01/12/96/00001/Supplemental 2-MSCC_Capsure_Matching_Significance.xlsx).
Supplemental Table 3. Trial 2 Inclusions in Fired Clay (https://ufdcimages.uflib.ufl.edu/IR/00/01/12/96/00001/Supplemental 3-Trial2_Inclusions_Fired_Clay.xlsx).


 Open access