


Introduction
Predicting shapes and thicknesses of ice accretions as a function of meteorological data is becoming increasingly important. Nowadays, for example, the design of high-voltage overhead transmission lines is increasingly optimized for minimum cost. This requires the load to be predicted accurately, including possible ice and wind loadings whenever applicable. Since icing occurs in remote areas and at irregular intervals this has created the need to simulate icing either numerically (Ackley and Temple-ton 1979, Lozowski and others 1979, Reference McComber and TouzotMcComber 1981) or in wind tunnels. In order to relate the simulation variables to natural icing conditions, meteorological parameters must be measured and compared as accurately as possible.
Two parameters are particularly difficult to obtain accurately, namely the collection efficiency of the iced object and the liquid water content of the air flow. The collection efficiency can be evaluated numerically by solving the droplet equations of motion (Langmuir and Blodgett 1960, McComber and Touzot 1981). It is primarily a function of the object reference length, droplet diameter, and wind velocity.
The liquid water content is difficult to measure accurately. Whenever it is used to predict the thicknesses of ice accretions, it is usually obtained from icing measurements (Rush and Wardlaw 1957, Reference StallabrassStallabrass 1978). This implies that the icing is measured for conditions of dry growth, usually on a small rotating cylinder, and that the liquid water content is calculated from the amount of ice collected. This requires the use of the calculated collection efficiency and a measured ice density. This explains the reason why a numerical calculation of the collection efficiency is essential to this method, i.e. if the icing is used to determine the liquid water content, it cannot be used at the same time to measure the collection efficiency. Instead of using the numerical solution, some authors assume the collection efficiency to be 100% {Ashworth and Knight 1978), which is accurate only for a small object size and a large droplet velocity. The use of icing to measure the liquid water content is used by most authors doing research on aircraft and helicopter icing. For this application, the air velocity is larger than 25 m s−1 (Reference StallabrassStallabrass 1978) and a small rotating cylinder 0.25 cm in diameter is used, making the collection efficiency almost constant and equal to 1. Unfortunately, in the case of wind velocities on power-line conductors with diameters of 3.5 cm, the effect of the calculated collection efficiency on the liquid water content measurements becomes more important. For similar conditions, the accuracy of the calculated collection efficiency was verified for spheres but was also shown to be inaccurate for cylinders at low velocity (Macklin and Bailey 1968, Carras and Macklin 1973). However, an accurate prediction of the icing rate on a cylinder is essential to the eventual determination of ice shapes and loads on transmission lines. Indeed, this appears to be a prerequisite to the use of simulation, in this case either in a wind tunnel or by a numerical model.
The object of the present work was to verify the accuracy of measurements of rates of icing on fixed cylinders. For this purpose icing measurements were made on fixed and rotating cylinders of various sizes in an icing wind tunnel. Rotating cylinders were used as a basis for comparison since extensive data have been gathered for this case (Reference StallabrassStallabrass 1978).
Apparatus and Experimental Procedure
Icing wind tunnel
Samples of ice accretions were obtained in a refrigerated wind tunnel having a test section of 0,61 × 0.61 m. Figure 1 shows a diagram of the contracted section of the icing tunnel downstream of the spray nozzles and of the location of the test section. The contraction reduces the tunnel area from 4.55 to 0.37 m2 and the test cylinders are located 0.3 m downstream of the end of the contraction.

Fig. 1. Diagram of icing wind tunnel showing the contracted and test sections and the relative locations of water spray nozzles and ice accretion.
Icing procedure and measurements
Samples of ice accretions were obtained on four aluminium cylinders of different diameters: 0.63, 1.28, 3.36 and 5.94 cm. These cylinders were 12 cm long. The samples were inspected visually to verify that the end effects were small. Figure 2 is a photograph of an accretion obtained on the largest cylinder in rotation. Rotation at 1 rpm was achieved using a constant speed motor. The wind tunnel was first refrigerated until it reached a steady temperature. The cylinders were cleaned and pre-refrigerated. Tests were made on one cylinder at a time. Wind velocity was measured with a Pi tot tube and was maintained at 7,75 m s−1 for all the tests. The nozzles were then permitted to generate the droplets for a certain time, after which the ice-covered cylinder was transferred into the cold room for measurements. The measured rate of accretion or icing ji is defined by:
where V-¡ is the ice accretion volume (in m3), A i is the cross-sectional area (in m 2) of the iced cylinder in a direction perpendicular to the wind velocity and t is the accretion time (in s). The volume is obtained from the accretion weight and density. These two parameters were obtained by weighing the iced cylinder and taking a second reading when the iced cylinder was suspended in an oil bath (oil density 0.841 g cm−3 at -11˚ C). The red colour of the oil showed visible infiltrations due to ice porosity. However, since hard rimed samples were obtained in the tests, the infiltration is small. A; was measured, first by taking a photograph of the iced sample in the right direction, and then measuring the cross-sectional area with a planimeter. In the case of fixed cylinders, because of the existence of a maximum angle of collection, the cross-sectional area remains that of the ice-free cylinder.

Fig. 2. Photograph of an ice accretion obtained on a rotating cylinder.
Supercooled droplets
Six spray nozzles were used in the wind tunnel to produce the supercooled droplets 3 m upstream of the test section before the contraction. Pressures of air and water were adjusted in the nozzles to give varying liquid water contents and droplet, diameters. The droplet spectrum was obtained with a silver-colloid film method (Reference Langmuir, Blodgett and SuitsGodard 1960). These measurements were made in the test section close to the ice accretion sample. Figure 3 gives a histogram of one of the water droplet distributions, where the mean diameter was calculated to be 14.8 um. Also shown in this figure is the one-parameter distribution suggested by Shapiro and Erickson (1957) to describe diameter distributions obtained by spray nozzles. For each distribution, the volume median diameter was also calculated and used in the estimation of the collection efficiency.

Fig. 3. Histogram of water droplet distribution (nozzle setting no.2).
Collection efficiency
The collection efficiency E can be calculated numerically as a function of two dimensioniess parameters K and ф
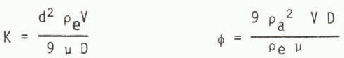
where D is the diameter of the cylinder (in m), d the diameter of the droplet (in m), p e the density of the water (in kg m−3), pa the density of the air (in kg m−3), μ the absolute viscosity of the air (in kg m−1s−1), and V the air speed (in m s−1).
Results for these calculations can be found in Langmuir and Blodgett (1960). Since the droplet diameters appear in the inertia parameter K, the droplet diameter spectrum must be considered in these calculations. In the usual procedure (Reference StallabrassStallabrass 1978), the median volume diameter is used to calculate the collection efficiency for a droplet distribution. However, at the air velocity at which the tests were made and at the short distance from the contraction of the tunnel, this procedure was not accurate. Shapiro and Erickson (1957) have shown that, in the case of a short distance from a contraction, droplets were affected in two ways. The first effect was to change the droplet distribution when compared with the one obtained after a longer constant cross-section, by an increase in the number of larger drops. The second effect was that the droplets do not reach air velocity in the short distance available within the wind tunnel. This effect is not uniform. The smaller droplets will have a larger velocity and the larger ones, due to their inertia, will have a smaller velocity.
Both of these effects would have to be taken into consideration when calculating an accurate collection efficiency. Even though a droplet distribution spectrum was obtained, no measurements of the droplet velocities in the test section were made. The mean droplet diameter was therefore calculated for each distribution and is shown in Table I, but it was not used in the following results.
Table 1. CHARACTERISTICS OF THE SPRAY-NOZZLE SETTINGS

Estimated liquid water content
One way to measure the water content is by the use of a single rotating cylinder (Rush and Wardlaw 1967, Stallabrass 1973), Since rotating cylinders were used for the tests, accretions on the smallest of the cylinders were used to estimate the liquid water content. The water content w is estimated by the following equation:
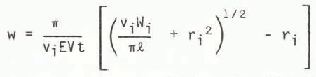
where t is the accumulation time (in s), V i is the specific volume of the rime (in cm 3 g−1), Wi is the mass of accumulated ice (in g), and r. ¡, l and E are the radius and lengtn (in cm) and the collection efficiency of the cylinder, respectively. V has already been defined.
The above equation shows that the liquid water content estimated is based on the correct evaluation of the collection efficiency. Considering that the collection efficiency is not measured and is difficult to calculate accurately, the estimated water content was used only as an indication of the relative order of magnitude of the different nozzle settings given in Table I. It may be argued that the values of liquid water content are somewhat high, compared to most natural icing conditions. But it must be remembered that for a given spray-nozzle flow, the water content increases for lower wind velocities. Since one of the objectives of the study was to make tests at a fairly low velocity, the higher liquid water contents had to be accepted. If conditions for dry growth are maintained, a higher liquid water content results only in a faster accretion when compared with natural icing conditions.
Conditions of freezing at the accretion surface
Care was taken during these experiments to provide conditions for dry growth at the accretion surface, resulting in hard rime. This was verified by inspection of the ice-covered cylinders. Only at the highest liquid water contents and lowest cylinder diameters were there indications that freezing was close to the limit for wet growth. Hence, the effects of water runback did not have to be taken into consideration in the analysis of the results.
Calculated accretion rate
The rate of icing obtained from Equation (1) corresponds to a volume flux of icing j-i and can be evaluated by
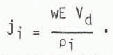
This expression contains wE, which is already difficult to estimate, but it also contains Vd, which represents the droplet velocities. Since we could not assume that all droplets reached the air velocity V, it became almost impossible to use Equation (4) accurately. This will be illustrated in some of the results obtained.
Results and Discussions
Accretion rate on cylinders of different sizes
Tests were made for five different liquid water contents presented in Table I. Accretions were obtained on four different sizes of fixed and rotating cylinders. In each case three tests were made. Ice was accreted for 2 min, the temperature was kept constant at -15.7°C to permit dry growth of the samples, and the wind velocity was also kept constant at 7.75 m s−1 and measured with a Pi tot tube. Figures 4 to 8 present the results for increasing liquid water contents. In each figure the rate of icing as obtained by Equation (1) is shown as a function of the cylinder diameters for both fixed and rotating cylinders. The curves shown were obtained from the data using a least squares curve fitting procedure.

Fig. 4. Rate of icing as a function of fixed and rotating cylinder diameters (nozzle setting no.3).

Fig. 5. Rate of icing as a function of fixed and rotating cylinder diameters (nozzle setting no.2).

Fig. 6. Rate of icing as a function of fixed and rotating cylinder diameters (nozzle setting no.4).

Fig. 7. Rate of icing as a function of fixed and rotating cylinder diameters (nozzle setting no.5).

Fig. 8. Rate of icing as a function of fixed and rotating cylinder diameters (nozzle setting no.l).
Accretion rate on fixed cylinders
For the results at lower water contents and smaller droplet diameters, the accretion rate is seen to decrease as the diameter of the cylinder increases. This corresponds to the effect of the collection efficiency. For the larger liquid water contents the accretion rate became independent of cylinder diameter, as shown in Figures 7 and 8. As expected, the rate of icing increased with the estimated liquid water content.
Effect of the varying diameter on the rotating cylinder results
The rotating cylinder has an increasing diameter while the ice is formed. Rush and wardlaw (1957) take this effect into consideration by using

where De is the diameter of the iced cylinder and D-¡ is the diameter of the cylinder itself, t has already been defined. This equation is used to derive Equation (3) for evaluation of tne liquid water content. It is based on the fact that the collection efficiency remains constant while the accretion forms. If Da is the average diameter (De + Di)/2 then the measured accretion in Equation (1) needs to be corrected:

If the corrected rate of accretion is jc and ji is obtained using Equation (1), then:

Figure 9 shows the value of this correction factor as a function of the rate of accretion for the four sizes of cylinders used. Since this correction factor seemed to be the cause of some difficulty in using Equation (3) to obtain the accretion thickness on rotating cylinders, a comparison was made including the correction factor De/Da.

Fig. 9. Correction factor for the rate of accretion on rotating cylinders of different diameters.
Figure 10 shows the results of the rate of accretion on a fixed cylinder as compared with the corrected rate on the rotating cylinder. It can be seen that the correction factor seems to increase the accretion rate too much, especially for the smaller cylinder. This effect, however, can be explained as follows. The correction factor is found using a constant collection efficiency. However, it becomes important when De is significantly larger than Da. In such a case, the collection efficiency is affected by the change in size but rather in the opposite direction, since the collection efficiency is higher for a smaller cylinder. In fact, if a first correction is taken into account for De/Da then a second correction for the collection efficiency has to be included. However, a second correction factor is more difficult to calculate since it involves a numerical simulation of ice accretion on a rotating cylinder. In summary, the use of rotating cylinders and of Equation (3) becomes inaccurate whenever there is a significant variation of the collection efficiency with diameters.

Fig. 10. Comparison of the rate of accretion for fixed cylinders and corrected rotating cylinders (Equation (7)).
Figures 7 and 8 show that for larger values of liquid water contents the accretion rate seems to be almost constant on the fixed cylinders. At these nozzle settings, the larger droplets give a collection efficiency close to 100%. The accretion rate measured on the rotating cylinder is shown to increase and then decrease with the cylinder size. This could be explained by the opposite effect of the two correction factors necessary for the case of rotating cylinders.
Effect of the liquid water content on the accretion rate
Figure 11 shows the average rate of accretion as a function of the estimated liquid water content for the different sizes of fixed cylinders. As expected, the rate of accretion for each cylinder size increases almost linearly with the liquid water content. Also in Figure 11, it can be observed that for a given liquid water content a larger cylinder always results in a decrease in the accretion rate, due to the drop in the collection efficiency. The results show less scatter at higher liquid water contents, because for these values the collection efficiency is close to 1 and it has only small variations with diameters.

Fig. 11. Rate of accretion of fixed cylinders as a function of estimated liquid water content.
Comparison of the accretion rate on fixed and rotating cylinders
A comparison of the accretion rate on fixed and rotating cylinders indicates that for lower liquid water contents (see Figs.4, 5 and 6) the rotating cylinder measurements seem to underestimate the accretion rate whereas for higher liquid water content (see Figs.7 and 8) the opposite effect is observed.
In the first instance (Figs.4, 5 and 6), the observation might be explained by the fact that a smaller mean droplet diameter was obtained for the nozzle settings giving the lower water content. Furthermore the correction factor De/Oa would be applicable in this case for the accretion rate, as measured on the rotating cylinder.
For the higher liquid water contents, a larger accretion volume is obtained since the accretion time is kept constant (t = 2 min). The difference in shape obtained for the fixed cylinder is therefore most important in these cases and it can influence the amount of water collected. For the same cross-section, a circular shape has a larger collection efficiency than an elongated shape. Hence, special care should be taken to keep the accretion small on fixed cylinders in order to avoid an effect due to a change in shape.
Effect of the ratio of cylinder length to diameter
Results show that for larger cylinder diameters a decrease in the rate of accretion is obtained. Such a decrease is predicted by the two-dimensional collection efficiency calculations. However, it is likely that for the smaller cylinder length/diameter ratios, there is a three-dimensional effect and that some water droplets are lost on the sides of the cylinders. If the measurements are intended to be used for icing prediction on transmission line conductors (infinite length/diameter ratio) measurements should be made with smaller cylinders. More results would be needed to assess the effect of the length to diameter ratio on the larger cylinders.
Conclusions
For the low wind velocities at which the tests were conducted (7.75 m s−1) the conventional method of measuring the liquid water content with a small rotating cylinder appears to overestimate systematically the rate of icing of fixed cylinders by as much as 30% in the worst case tested.
For the prediction of icing rates on different structures, it is more accurate to use a measurement of the accretion rate itself rather than the liquid water content and collection efficiency. The fixed cylinder measurements appear to be more accurate than the rotating cylinder ones as long as the accretion thickness is kept small in comparison with the cylinder diameter. Because of the variation of the cross-section and the collection efficiency, accretion on rotating cylinders would necessitate the use of correction factors which are difficult to determine accurately.
Measurements of accretion rate on fixed cylinders should be obtained on at least two sizes of cylinder whenever droplet sizes indicate that the rate would vary significantly with cylinder diameter. Measurements on two cylinders would in this case permit extrapolations of the accretion rate to other sizes of cylinder.
The most accurate method for measuring the rate of icing appears to be the simplest. It is based on measurements of the accretion volume and the cross-sectional area of the structure. The accretion volume is obtained by weight and density measurements while the cross-sectional area for a fixed cylinder is accurately determined by the product of the diameter and length of the cylinder.
Acknowledgement
This work was supported by the Conseil National de la Recherche en Science et en Génie du Canada and by the Ministère de l’Education du Québec.


