


1. Introduction
Flow past multiple wall-mounted cylinders is of importance in many engineering applications such as buildings, chimney stacks, cooling towers, offshore structures, and fuel rods in nuclear reactors. A simplified configuration of multiple cylinders is two cylinders in a tandem, staggered or side-by-side arrangement. Though simplified, the two-cylinder configuration exhibits most of the salient features of flow past multiple cylinders including flow separation and reattachment, recirculation bubbles, vortex impingement, proximity and wake interference and quasi-periodic vortex shedding. In engineering applications, flow separation and vortex shedding can lead to undesirable effects such as vortex-induced vibrations, resonance, noise generation and fatigue failure. Accordingly, the two-cylinder configuration is routinely used in both experimental and numerical studies to gain insight into the flow physics of multiple cylinders and develop effective flow control strategies (Lee, Lee & Park Reference Lee, Lee and Park2004; Zhou & Mahbub Alam Reference Zhou and Mahbub Alam2016). While extensive studies have been conducted for two finite wall-mounted cylinders with identical heights, the literature on cylinders with unequal height (figure 1) is limited although prevalent in diverse environmental and engineering applications. Examples include flow over a cluster of low- and high-rise buildings, offshore structures and turbulent boundary layer (TBL) control using roughness elements of varying heights to reduce drag and delay flow separation (Yang & Meneveau Reference Yang and Meneveau2016; Sadique et al. Reference Sadique, Yang, Meneveau and Mittal2017; Hamed, Peterlein & Randle Reference Hamed, Peterlein and Randle2019).
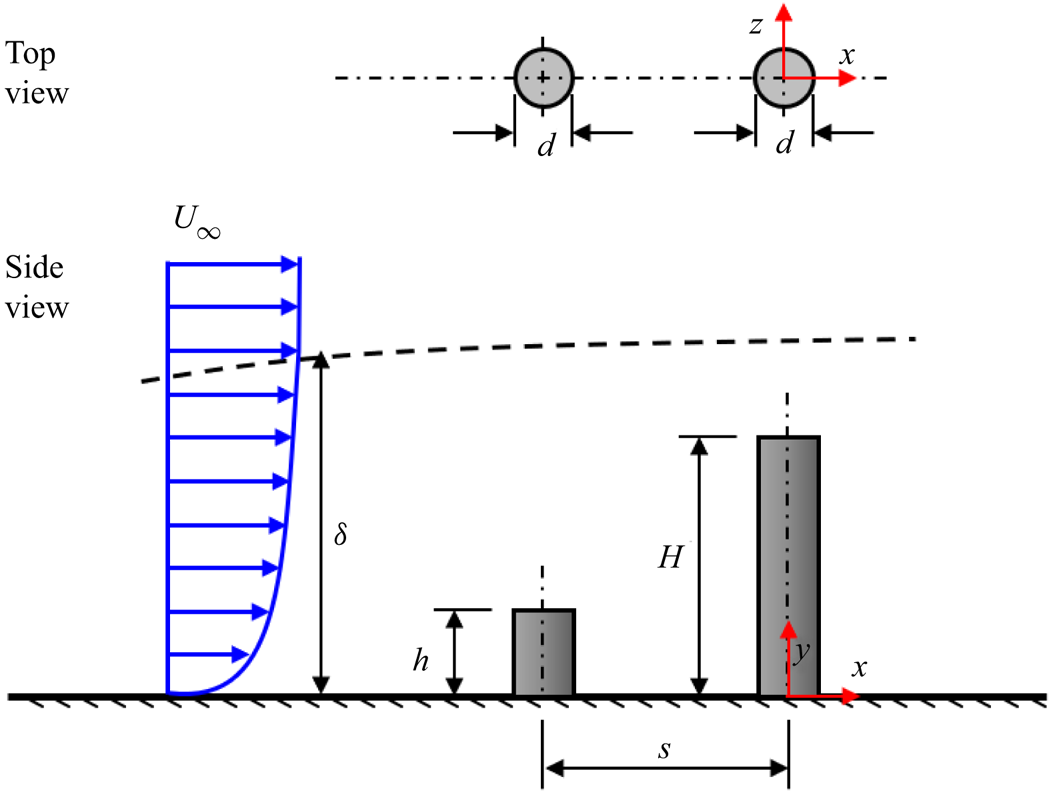
Figure 1. Schematic of two finite wall-mounted cylinders of unequal height arranged in tandem. Each cylinder has the same diameter, d, and separated by a centre-to-centre streamwise distance, s. The height of the upstream cylinder is denoted,  $h$, and the downstream cylinder, H. Both cylinders are fully immersed in a turbulent boundary layer of free stream velocity,
  ${U_\infty }$, and boundary layer thickness,
  $\delta $. The left-handed Cartesian coordinate system adopted has the origin of the streamwise (x), wall-normal (y) and spanwise (z) directions at the centre of the cylinder on the bottom wall.
The flow regimes of two wall-mounted cylinders with infinite height can be classified into proximity interference, wake interference and proximity-wake interference (Zdravkovich Reference Zdravkovich1997). The proximity interference refers to the arrangement where the cylinders are located close to each other but not within the wake of the other. However, wake interference occurs when the downstream cylinder (hereafter referred to as the DC) is placed in the wake of the upstream cylinder (hereafter referred to as the UC), which is a typical configuration of tandem (inline) cylinders. A combination of the proximity and wake interference is often referred to as proximity-wake interference. For tandem cylinders, three main flow regimes have been identified based on the spacing ratio ( $s/d$, where s is the centre-to-centre spacing between the cylinders and d is the cylinder diameter): (i) extended-body regime; (ii) reattachment regime and (iii) co-shedding regime (Zdravkovich Reference Zdravkovich1997; Papaioannou et al. Reference Papaioannou, Yue, Triantafyllou and Karniadakis2006; Zhou & Yiu Reference Zhou and Yiu2006; Chen et al. Reference Chen, Ji, Alam, Williams and Xu2020). The extended-body regime occurs for small spacing ratios
  $(s/d\; < \; 2)$ where the two cylinders are close to each other such that the separated shear layers from UC overshoot the downstream one, leaving a near-stagnant flow in the gap between the cylinders (Hetz, Dhaubhadel & Telionis Reference Hetz, Dhaubhadel and Telionis1991; Sumner Reference Sumner2010). The wake of the extended-body flow is akin to that of a single bluff body. In the case of the reattachment regime, the spacing ratio
  $(s/d \in [2,5])$ promotes the reattachment of the separated shear layers from the UC onto the frontal
  $(s/d \in [2,3])$ or rear
  $(s/d \in [3,5])$ surface of the DC, thereby creating a quasi-steady gap flow between the cylinders. For the co-shedding case, the spacing ratio is sufficiently large
  $(s/d\; > \; 5)$ such that the separated shear layers from the UC fail to attach on the downstream one, resulting in a highly unsteady gap flow and vortex shedding from both cylinders. It should be noted that the critical spacing ratio that differentiates the various flow regimes are dependent on flow parameters such as the Reynolds number based on the cylinder diameter and freestream velocity
  $(Re)$, and turbulence intensity of the approach flow (Ljungkrona, Norberg & Sundén Reference Ljungkrona, Norberg and Sundén1991; Sumner Reference Sumner2010; Alam Reference Alam2014).
Finite wall-mounted cylinders of identical heights and arranged in tandem also exhibit the three main flow regimes of infinite cylinders, however, the wake interference and demarcation of the various regimes are influenced by additional parameters: the aspect ratio of the cylinders ( $L/d$, where L is the height of the identical cylinders) and the relative boundary layer thickness
  $(\delta /d)$ or submergence ratio
  $(\delta /L)$ (Luo, Gan & Chew Reference Luo, Gan and Chew1996; Palau-Salvador, Stoesser & Rodi Reference Palau-Salvador, Stoesser and Rodi2008; Sumner & Li Reference Sumner and Li2014; Kim & Christensen Reference Kim and Christensen2018; Sumner & Reitenbach Reference Sumner and Reitenbach2019). For
  $\delta /L > 1$, the cylinders are fully submerged in the TBL, therefore, the entire span of the cylinders encounter stronger mean shear and higher turbulence intensity than cylinders in a thin TBL
  $(\delta /L \ll 1)$ or uniform flow. Based on a recent review by Sumner & Reitenbach (Reference Sumner and Reitenbach2019), the effects of submergence ratio on the unsteady separation and wake dynamics of cylinders in tandem is not well understood. Kim & Christensen (Reference Kim and Christensen2018) investigated the effects of spacing ratio (
 $s/d = 2$, 3, 5 and 7) on the wake dynamics of two finite wall-mounted cylinders submerged in a TBL using a particle image velocimetry (PIV) system. Two aspect ratios of the cylinders were tested,
  $L/d = 1.33$ and 2.37, and the submergence ratios were
  $\delta /L = 7.1$ and 5.3, respectively. They found that the separated shear layer from the free end of the UC reattached on the surface of the DC for
  $s/d = 2$ and 3, which mimic the reattachment regime of infinite cylinders. However, for larger spacing ratios (
 $s/d = 5$ and 7), the downwash from the free end of UC reattached on the gap bottom wall and a separate recirculation bubble was formed behind each cylinder resembling a co-shedding flow. The critical spacing ratio for the reattachment regime increased as the aspect ratio increased and submergence ratio decreased. Palau-Salvador et al. (Reference Palau-Salvador, Stoesser and Rodi2008) performed large-eddy simulations of flow past two finite cylinders in tandem (
 $L/d\; = \; 2.5$,
  $\delta /L\; = \; 1.2$ and s/d = 2) and found that the presence of the DC suppressed vortex shedding from the UC. In the experimental study by Sumner & Li (Reference Sumner and Li2014), the three flow regimes were investigated for finite wall-mounted cylinders using spacing ratios,
  $s/d = 1.125$, 2 and 5,
  $L/d = 9$ and
  $\delta /L = 0.4$. The extended-body and reattachment flow regimes (
 $s/d = 1.125$ and 2) showed the presence of a pair of tip vortices and base vortices associated with the UC; however, additional pairs of vortices and stronger downwash flow were observed behind the DC for the co-shedding case.
For tandem cylinders with different heights, the flow physics are further complicated with the influence of height ratio ( $h/H$, where h and H denote the height of the UC and DC, respectively (figure 1)). The height difference between the cylinders introduces the phenomenon of ‘sheltering’ where part or the whole span of the DC is sheltered or blocked from direct interaction with the approach flow (Millward-Hopkins et al. Reference Millward-Hopkins, Tomlin, Ma, Ingham and Pourkashanian2011; Sadique et al. Reference Sadique, Yang, Meneveau and Mittal2017; Hamed et al. Reference Hamed, Peterlein and Randle2019; Kumar & Tiwari Reference Kumar and Tiwari2019; Hamed & Peterlein Reference Hamed and Peterlein2020). Although sheltering reduces drag (Hamed et al. Reference Hamed, Peterlein and Randle2019; Sumner & Reitenbach Reference Sumner and Reitenbach2019), the phenomenon is not well understood, especially for cylinders of relatively large aspect ratio and fully submerged in a TBL,
  $\delta > H$. Furthermore, to the best of the authors’ knowledge, no past studies have examined the spatio-temporal wake characteristics of tandem cylinders of unequal height. Hamed et al. (Reference Hamed, Peterlein and Randle2019) investigated the effects of height ratio (
 $h/H = 0.5$, 0.75 and 1.0) and spacing ratio (
 $s/d = 2$, 4 and 6) on the time-averaged wake characteristics of two circular finite cylinders arranged in tandem. The study used a relatively small aspect ratio (i.e.
  $H/d = 2.5$ for DC) and a large submergence ratio,
  $\delta /H = 5.0$, thereby categorizing the cylinders as roughness elements. As the height ratio increased, the sheltering by UC reduced the size of the recirculation bubble and the downwash flow behind the DC. However, increasing the spacing ratio reduced the degree of sheltering as the downwash from the free end of the UC reattached on the bottom wall before interacting with the DC. It was concluded that the impact of sheltering on the wake of the DC is highly dependent on both the spacing ratio and the height ratio (Hamed et al. Reference Hamed, Peterlein and Randle2019; Hamed & Peterlein Reference Hamed and Peterlein2020).
The objective of this study is to investigate the effects of sheltering on the unsteady wake dynamics of two circular finite wall-mounted cylinders arranged in tandem and fully submerged in a TBL. The Reynolds number,  $Re = 5540$, spacing ratio,
  $s/d = 4$, and height of the DC
  $(H/d = 7)$ were kept constant but the height of the UC was varied from h/d = 0.7 to 7.0, corresponding to upstream submergence ratios of
  $\delta /h = 12.4\; - 1.2$, respectively. Detailed spatio-temporal measurements were conducted with a time-resolved PIV system for the tandem cylinders and a reference single cylinder of
  $H/d = 7$. The rest of the paper is organized as follows: § 2 presents the experimental procedure and test conditions while § 3 discusses the effects of sheltering on the unsteady three-dimensional (3-D) wake characteristics of the unequal-height tandem cylinders. The major conclusions are summarized in § 4.
2. Experimental set-up and procedure
2.1. Test facility and test models
The experiments were conducted in a recirculating open water channel in the Turbulence and Hydraulic Engineering Laboratory (THEL) at the University of Manitoba. The transparent test section of the channel was 6000 mm long, 600 mm wide and 450 mm deep. The flow was driven by a 30 kW variable-speed drive motor pump through a flow conditioning unit before entering the test section. The flow conditioning unit consisted of perforated plates, hexagonal honeycombs, and mesh screens of different sizes and had a contraction ratio of 4.88:1. A schematic drawing of the experimental setup of the tandem cylinders is shown in figure 2. The cylinders were vertically mounted using screws on the flat acrylic plates that line the floor of the test section. Each cylinder model was a smooth round acrylic rod of diameter, d = 12.7 mm. The centre of the DC, set as the origin of the coordinate system used, was positioned at a streamwise distance of 315d from the channel's inlet and the mid-span (z/d = 0) of the channel. The upstream replaceable cylinder was positioned at a fixed spacing ratio of s/d = 4 and arranged in line with the DC. The spacing ratio was chosen to promote interaction between the two cylinders similar to the reattachment regime of infinite cylinders. To minimize surface glare from the laser illumination, the cylinders and the top surface of the bottom plate on which they were mounted were painted with a non-reflective black spray. The incoming boundary layer was tripped with a 16-grit sandpaper strip to facilitate the transition to turbulent flow. The sandpaper had an average roughness height of 1.5 mm, a strip length of 80 mm and spanned the entire width of the channel.
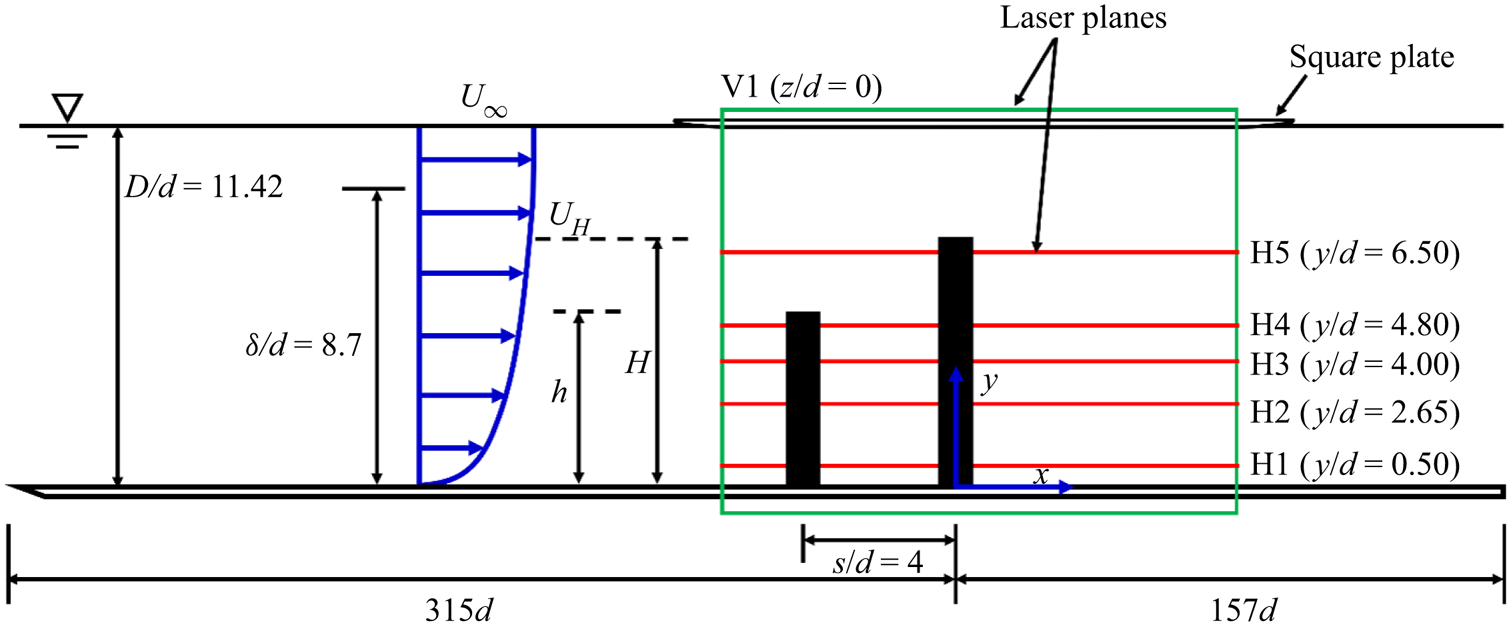
Figure 2. Schematic of experimental set-up and nomenclature used in the present study. V1 denotes measurements in the x–y plane at the symmetry (z/d = 0) of the cylinders and H1–H5 denote measurements in the x–z planes. The streamwise velocity at the height of the downstream cylinder is denoted UH. Not drawn to scale.
Five different height ratios (h/H) were tested by varying the aspect ratio of UC while keeping the aspect ratio of the DC fixed at H/d = 7.0. The aspect ratios of the UC were selected to correspond to a sheltering degree of 10 %, 25 %, 50 %, 75 % and 100 % of the DC (i.e. h/H = 0.10, 0.25, 0.50, 0.75 and 1.00). For simplicity, these test cases are denoted as HR10, HR25, HR50, HR75 and HR100, respectively. Also, measurements were conducted for a reference single cylinder case (i.e. no sheltering) where the UC was completely removed, and this test case is denoted as the SC. For each experiment, the water depth of the channel was kept constant at D = 11.42d (145 mm) and the maximum blockage ratio of the cylinders was 1.3 %. The approach flow was characterized before installing the cylinders in the channel. The freestream velocity was  ${U_\infty } = 0.436\;\textrm{m}{\textrm{s}^{ - 1}}$ and the Reynolds number,
  $Re = {U_\infty }d/\nu = 5540$, where the kinematic viscosity of the working fluid (water) at room temperature (20 °C),
  $\nu = {10^{ - 6}}\;{\textrm{m}^2}\;{\textrm{s}^{ - 1}}$. The Froude number
  $({U_\infty }/\sqrt {gD} )$ was 0.37, where
  $g = 9.81\;\textrm{m}{\textrm{s}^{ - 2}}$ is the acceleration due to gravity. The boundary layer thickness, based on the wall-normal location of
  $0.99{U_\infty }$ from the bottom wall, was
  $\delta = \textrm{8}\textrm{.7}d$ and the resulting submergence ratios based on the height of the UC were
  $\delta /h = 12.4$, 4.8, 2.5, 1.6 and 1.2 for HR10, HR25, HR50, HR75 and HR100, respectively.
2.2. PIV measurements
A planar time-resolved PIV system was used to measure the velocity fields of the cylinders, while a standard double-frame mode of the system was used to measure the approach flow without the cylinders installed. The flow was seeded with silver-coated hollow glass spheres of mean particle diameter, $\; {d_p}\; = \; 10\;\mathrm{\mu }\textrm{m}$, and density,
  ${\rho _p} = 1400\;\textrm{kg}\;{\textrm{m}^{ - 3}}$. The Stokes number of the particles was determined as
  $7.6 \times {10^{ - 5}}$ (Essel, Tachie & Balachandar Reference Essel, Tachie and Balachandar2021), which is orders of magnitude lower than the threshold value of 0.05 (Samimy & Lele Reference Samimy and Lele1991) for the particles to follow the flow faithfully. The flow field was illuminated with a dual-cavity high-speed pulsed Nd:YLF laser with each pulse delivering a maximum energy of 30 mJ at a sampling frequency
  $({f_{sp}})$ of 1000 Hz and wavelength of 527 nm. Using a combination of spherical and cylindrical lenses, the laser sheet was set to 1 mm thickness. The illuminated flow field was captured using a high-speed 12-bit CMOS camera with a 10 μm pixel pitch and a resolution of 2560 × 1600 pixels. The camera and laser were mounted on a traverse mechanism which allowed simultaneous streamwise movement of both devices at accurate locations. The data acquisition and post-processing to acquire the instantaneous velocity vectors were performed with the LaVision Inc. software DaVis 10.
The double-frame measurement of the approach flow was performed at the mid-span of the channel (z/d = 0) in the streamwise-wall-normal (x–y) plane denoted as V1 (figure 2). The flow field was illuminated from the free surface with the camera capturing the images through the transparent sidewall of the channel. Based on a convergence test, 9000 instantaneous image pairs were acquired at a sampling frequency of 4 Hz to obtain statistically independent samples to quantify the turbulent statistics. The field-of-view of the camera was set to 20.5d × 13.0d in the x- and y-directions and the resulting magnification factor was 10 pixels mm−1.
For each cylinder configuration, the time-resolved PIV measurements were conducted in the vertical plane (V1) with the same laser-camera orientation as that of the double-frame measurement. To further understand the unsteady 3-D vortex dynamics of the unequal-height tandem cylinders, additional measurements were performed in five horizontal (x–z) planes (H1 to H5) along the height of the test case, HR75. The horizontal planes were selected at 0.5d from the bottom wall (H1), mid-height of the UC (y/d = 2.65) (H2), wall-normal location within the region where the downwash from the UC attached to the frontal area of the DC (y/d = 4.0) (H3), and 0.5d from the free end of the UC (H4) and DC (H5). For the horizontal plane measurements, the laser illumination was from the sidewall and the images were captured with the camera above the channel (as used by Essel et al. Reference Essel, Tachie and Balachandar2021). Here, a thin square acrylic plate of length 600 mm was positioned beneath the camera and partially immersed in the water to a depth of 2 mm to minimize free surface distortions of the images captured in these planes. The leading edge of the plate was rounded to further reduce its influence on the flow. Based on preliminary x–y measurement conducted to investigate the effect of the plate, the boundary layer thickness formed on the plate was found to be very thin ( ${\delta _p} = 6.5\;\textrm{mm}$ (
 $0.5d$), where
  ${\delta _p}$ is based on the wall-normal location of
  $0.99{U_\infty }$ from the plate). Therefore, it was concluded that the plate has no significant influence on the bulk flow beneath it and was used for both the x–y and x–z measurements for consistency.
The vertical and horizontal planes were captured with the same field-of-view of the camera which spans approximately  $x/d \in [ - 3.5,13.5]$ and
  $y/d \in [ - 0.5,12.5]$ in the x–y plane and
  $z/d \in [ - 6.5,6.5]$ in the x–z plane. Based on a convergence test, a sample size of 48 000 instantaneous vector frames was acquired in each plane at a sampling frequency of 1000 Hz. This sample size was obtained in eight sets of 6000 images/set. The ratio of the sampling frequency to the spanwise vortex shedding frequency at the mid-height of the reference single cylinder (SC),
  $f_{sp}^\ast={f_{sp}}/{f_s} = 182$ cycles, and the number of cycles per set of images acquired was 33 cycles/set, resulting in a total of 264 cycles for the entire sample size. These large total cycles of the flow ensured statistical convergence of the mean velocities, Reynolds stresses and spectral quantities reported herein. During the experiments, it was ensured that the particle image diameter was approximately 2–4 pixels to minimize pixel-locking-induced errors (Raffel, Willert & Kompenhaus Reference Raffel, Willert and Kompenhaus1998; Adrian & Westerweel Reference Adrian and Westerweel2011). The initial interrogation area was set to 128 × 128 pixels with 50 % overlap and the final size was 32 × 32 pixels with 75 % overlap in each direction. The resulting vector spacing was 0.064d in each direction. A detailed description of the PIV uncertainty of the present measurements is available in Essel et al. (Reference Essel, Tachie and Balachandar2021). For the double frame measurement, the uncertainty in the streamwise mean velocity at 95 % confidence level was less than
  ${\pm} 1.0\,\%$, while the uncertainty in the Reynolds normal stresses and Reynolds shear stress were
  ${\pm} 3.0\,\%$ and
  ${\pm} 2.3\,\%$, respectively. In the case of the time-resolved measurements, the uncertainty in the mean velocities across the height of the cylinders ranged from
  ${\pm} 1\,\%$ to
  ${\pm} 5\,\%$. The uncertainties in the Reynolds normal stresses varied between
  ${\pm} 4\,\%$ and
  ${\pm} 14\,\%$, while those of the Reynolds shear stress varied between
  ${\pm} 3\,\%$ and
  ${\pm} 10\,\%$.
3. Results and discussion
3.1. Unperturbed turbulent boundary layer
Profiles of the streamwise mean velocity (U), streamwise  $(\langle {u^{\prime2}}\rangle )$ and wall-normal
  $(\langle {v^{\prime2}}\rangle )$ Reynolds normal stresses and the Reynolds shear stress
  $(\langle u^{\prime}v^{\prime}\rangle )$ in the TBL without the cylinders installed are shown in figure 3. The boundary layer thickness is
  $\delta /d = 8.7$ and the displacement and momentum thicknesses are
  ${\delta ^\ast }/d = 1.63$ and
  $\theta /d = 1.16$, respectively. The shape factor of the boundary layer is
  $H = 1.41$ and the Reynolds number based on
  ${U_\infty }$ and
  $\theta $,
  $R{e_\theta } = 6400$. The freestream streamwise turbulence intensity,
  ${u^{\prime}_{rms}}/{U_\infty } = 1.6\,\%$, where
  ${u^{\prime}_{rms}}$ is the root-mean-square of the streamwise velocity fluctuations. The portion of the TBL that is most likely to affect the flow separation of the UC has a maximum velocity of
  ${U_h}/{U_\infty } \in [0.61,0.94]$ at
  $y/d\; \in [0.7,7.0]$ for HR10 to HR100 and
  ${U_H}/{U_\infty } = 0.94$ for the DC
  $(y/d\; = \; 7.0)$. The free end of the UC for HR10, HR25 and HR50 is in the log law region of the approach TBL (
 ${y^ + } \in [40,800]$,
  ${y^ + } = y{u_\tau }/\nu $, where
  ${u_\tau }$ is the friction velocity obtained by the fitting of the velocity profile to the log law, as shown by Essel et al. Reference Essel, Tachie and Balachandar2021) while that of HR75 and HR100 are located at
  ${y^ + } = 1080$ and
  $1420$ in the outer region. The free end of the DC/SC is located at
  ${y^ + } = 1420$. At the free end of the UC, the dimensionless mean shear,
  $(\partial U/\partial y{|_h})d/{U_H} \in [0.040,0.218]$, and streamwise turbulence intensity,
  ${u^{\prime}_{rms}}{|_h}/{U_H}(\%) \in [4.1,10.2]$, for HR10 to HR100.
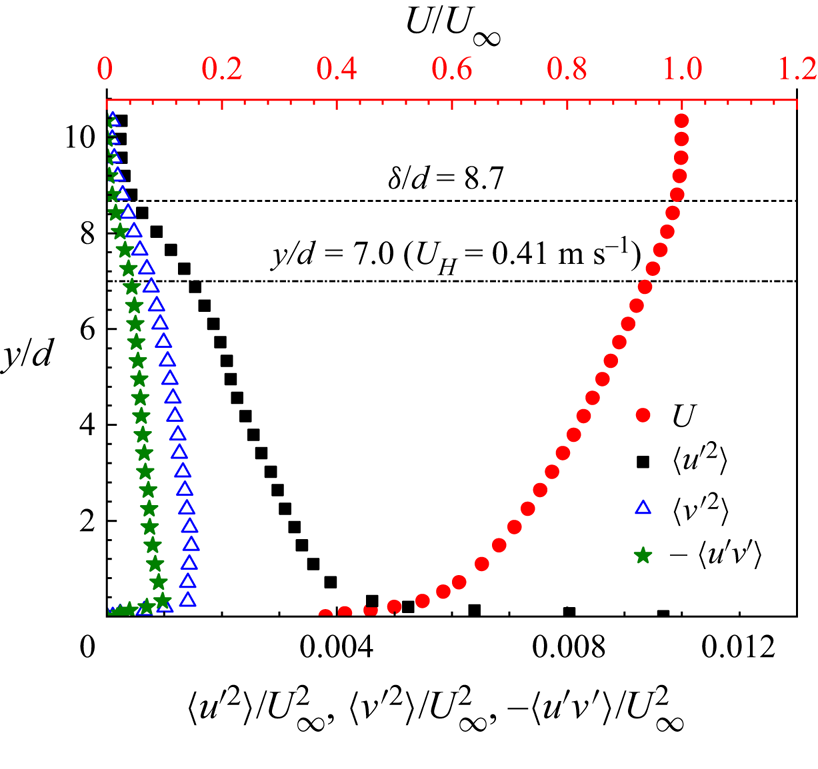
Figure 3. Approach turbulent boundary layer profiles of the streamwise mean velocity and Reynolds stresses.
3.2. Wake characteristics in the symmetry plane
3.2.1. Mean velocities and Reynolds stresses
Figure 4 presents contours of the streamwise mean velocity for the isolated cylinder and the tandem cylinders. The reverse flow region  $(U < 0)$ is demarcated by the isopleth of 50 % forward flow fraction
  $(\gamma = 0.5)$ while the isopleth,
  $U/{U_H} = 0.5$, is used to highlight the velocity deficit in the wake of the cylinders. Also, a trace of the maximum approach velocity encountered by the UC is shown on each plot using the isopleth,
  $U/{U_h} = 1$. The wake characteristics of the isolated cylinder (figure 4a) serve as a reference for understanding the impact of sheltering on the DC of the tandem. In figure 4(a), the salient features include strong acceleration of the approach flow over the top surface of the cylinder and a prominent reverse flow region formed behind the cylinder. The reverse flow region is suppressed near the free end
  $(y/d\; \in [6.5,7.0])$ and decreases from the mid-height of the cylinder towards the bottom wall. The suppression near the free end is due to the delay in separation caused by the formation of tip vortices that induce a downwash flow. However, base vortices formed at the foot of the cylinder induce an upwash that in turn reduces the reverse flow region near the wall (Pattenden, Turnock & Zhang Reference Pattenden, Turnock and Zhang2005; Krajnović Reference Krajnović2011). The downwash and upwash also affect the spatial distribution of the velocity deficit behind the cylinder as the isopleth,
  $U/{U_H} = 0.5$, extends further downstream near the mid-height of the cylinder than near the free end and the bottom wall. Moreover, most of the perturbation in the TBL induced by the presence of the cylinder is confined underneath the isopleth,
  $U/{U_H} = 1$. For the tandem cylinders (figure 4b–f), the wake structure behind the DC gradually departs from that of the isolated cylinder with increasing height ratio. In particular, the increase in height of the UC increases the degree of sheltering of the approach flow that interacts with the DC, and this reduces the flow separation and the size of the reverse flow region behind the sheltered portion of the DC. Accordingly, the overall drag on the DC would decrease with increasing height ratio. The locus of the maximum backflow velocity,
  ${U_b}$, (indicated with a cross mark) behind the DC also moves towards the free end and the velocity deficit occupies a larger region behind the cylinder with increasing height ratio. The maximum backflow velocity,
 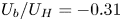 ${U_b}/{U_H} ={-} 0.31$, for the SC and DC of HR10 but increased by 13 % for the DC of HR25 to HR75. The DC of HR100, however, showed 48 % reduction in
  ${U_b}/{U_H}$ compared to the SC. In contrast, the size of the reverse flow region behind the UC increased and occupied the gap between the cylinders as the height ratio increased. Consequently, the maximum backflow velocity for the UC,
  ${U_b}/{U_H} \in [ - 0.19, - 0.32]$, increased as the height ratio increased.
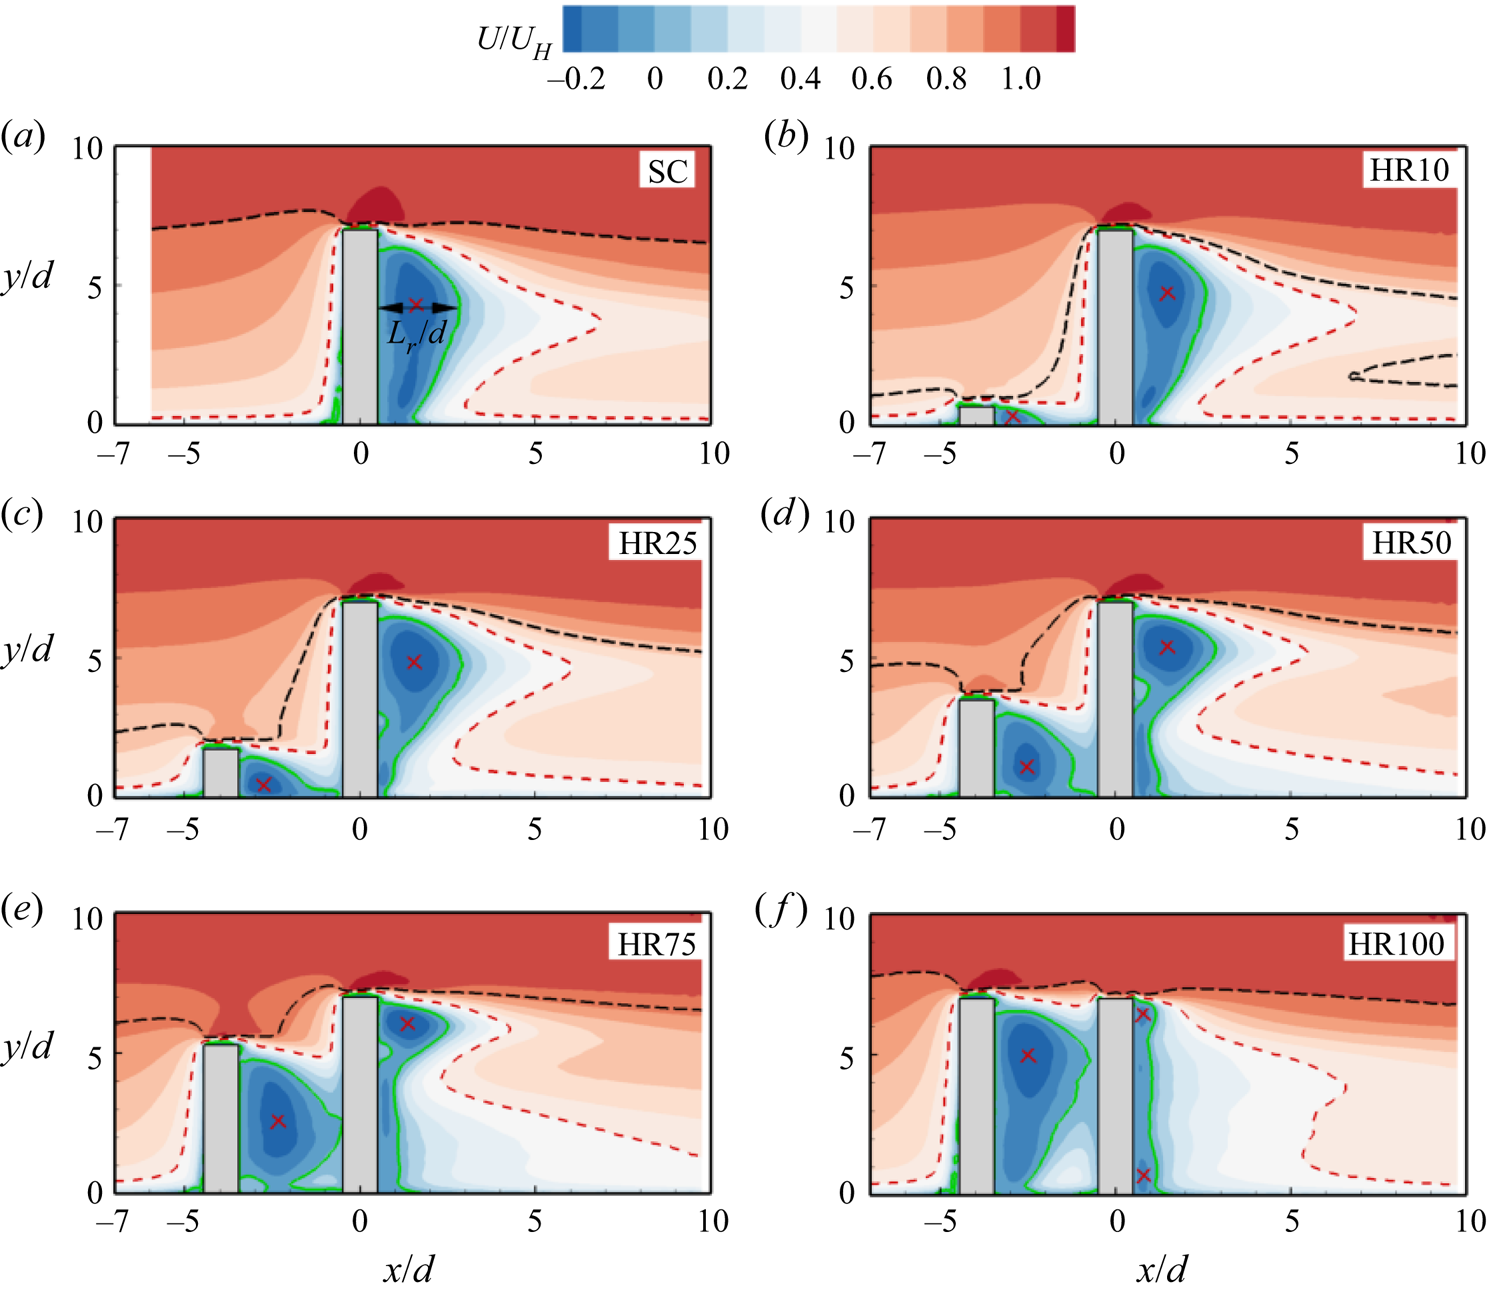
Figure 4. Contours of streamwise mean velocity in the x–y plane for (a) SC, (b) HR10, (c) HR25, (d) HR50, (e) HR75 and ( f) HR100. Superimposed on the contours are the isopleth of 50 % forward-flow fraction (green solid line) which bounds the reverse flow region. The red dash line represents  $U/{U_H} = 0.5$ and black dash line represents
  $U/{U_h} = 1$. The cross mark represents the locus of the maximum backflow velocity behind each cylinder.
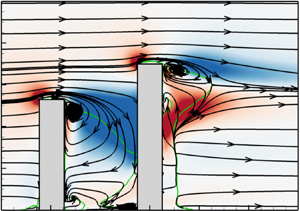
Contours of the wall-normal mean velocity and the mean streamlines are shown in figure 5 to provide further insight into the mean flow pattern. The flow around the SC (figure 5a) is characterized by flow deflection  $(V > 0)$ at the leading edge which is accompanied by a downwash
  $(V < 0)$ behind the free end of the cylinder. The downwash is opposed near the mid-height of the cylinder by an upwash
  $(V > 0)$ induced from the base of the cylinder. As a result, the recirculation region is bifurcated into counter-rotating bubbles with foci near the free end and the bottom wall. This wake structure corresponds to a quadrupole as it provides evidence of the presence of both tip and base vortices behind the cylinder (Essel et al. Reference Essel, Tachie and Balachandar2021). For the smallest height ratio (HR10) (figure 5b), the downwash from the UC is weak, and it attaches onto the bottom wall between the cylinders before interacting with the base of the DC. Consequently, the wake of the DC for HR10 is similar to that of the isolated cylinder. As the height ratio increases from HR25 to HR75 (figure 5c–e), the stronger downwash from the UC impinges directly on the frontal surface of the DC which induces a strong upwash on the opposite rear side of the DC. The induced upwash impedes the downwash from the DC much earlier than that of the SC and modifies the shape of the reverse flow region behind the DC. Meanwhile, the recirculation region behind the UC transitions from a single bubble (i.e. dipole-like wake structure) for HR25 to a bifurcated region (i.e. quadruple) for HR50 and HR75 due to the gradual growth of base vortices that induce upwash flow. The streamlines for HR75 also reveal a recirculation bubble in front of the base of the DC (figure 5g) which is an artefact of the horseshoe vortex formed in front of the DC. For HR100 (figure 5f), the flow structure behind the UC is like that of the isolated cylinder except that the downwash and upwash are impeded by the DC. The downwash from the UC impinges slightly below the leading edge of the DC, and it causes a weak flow separation at the leading edge which immediately attaches on the top surface of the cylinder. As a result, the downwash behind the DC is very weak and fails to form a recirculation bubble behind the cylinder. Moreover, a weak horseshoe vortex appears to be formed in front of the base of the DC for HR100.
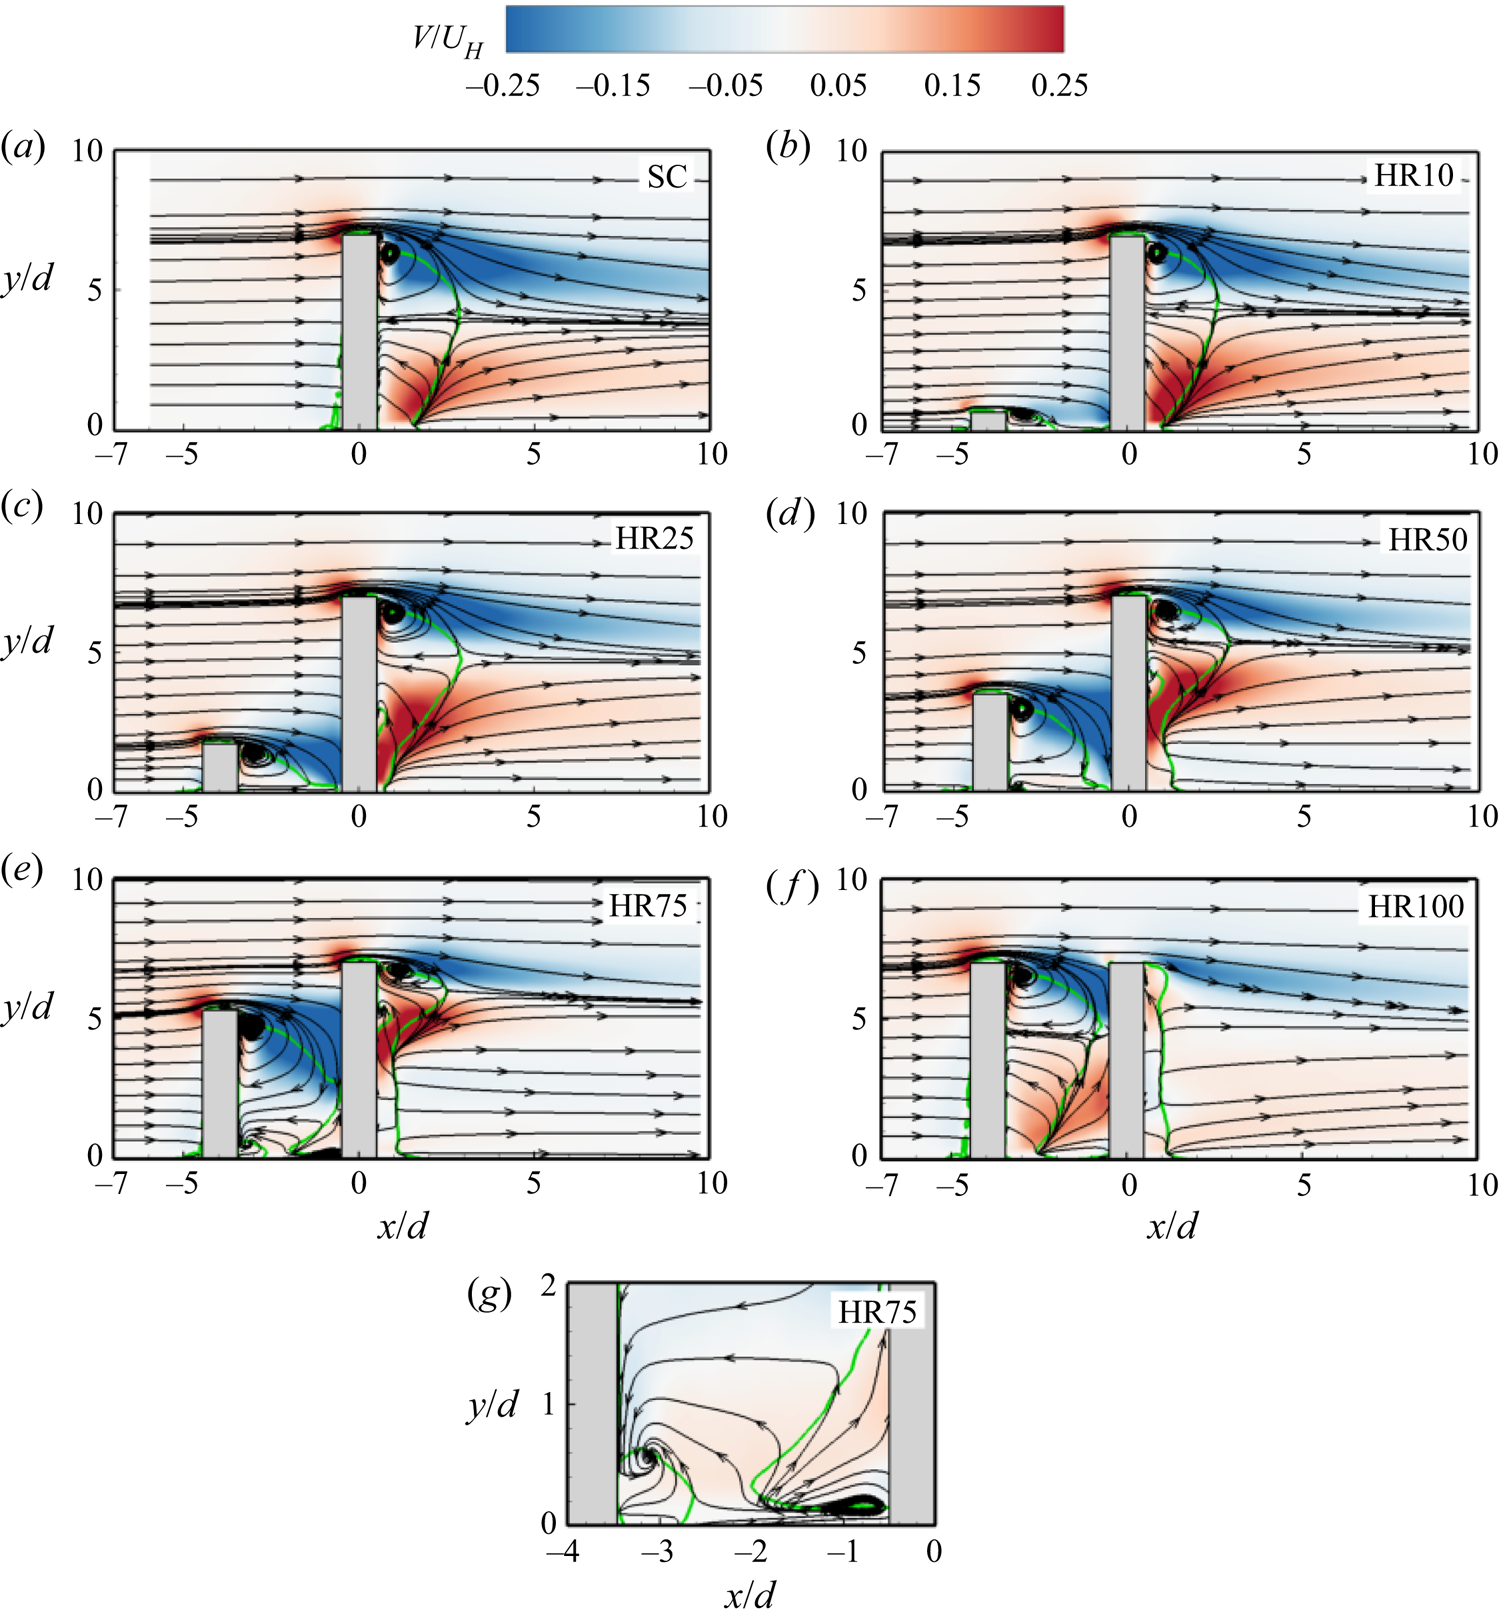
Figure 5. Contours of wall-normal mean velocity in the x–y plane for (a) SC, (b) HR10, (c) HR25, (d) HR50, (e) HR75, ( f) HR100 and (g) zoomed-in view of near the bottom wall of the gap flow of HR75. Superimposed are the mean streamlines and the isopleth of 50 % forward-flow fraction (green solid line) which bounds the reverse flow region.
For unequal-height tandem cylinders, the conventional classification based on spacing ratio (i.e. extended-body, reattachment and co-shedding regimes) is inadequate to fully describe the flow pattern. For example, the shear layer from the free end of the UC of HR10 attaches to the gap bottom wall but the vortex shedding from the UC is suppressed (Sumner, Heseltine & Dansereau Reference Sumner, Heseltine and Dansereau2004; Essel et al. Reference Essel, Tachie and Balachandar2021), therefore, the flow regime cannot be categorized as a co-shedding regime. In agreement with Hamed et al. (Reference Hamed, Peterlein and Randle2019), the appropriate classification for the unequal-height tandem cylinders should be based on the degree of sheltering, where sheltering is enhanced as the height ratio increases and spacing ratio decreases. Here, the degree of sheltering based on the height ratio is classified as low ( $h/H\; < \; 5.0$ for HR10 and HR25), medium (
 $h/H\; = \; 5.0$ for HR50) and high (
 $h/H\; > \; 5.0$ for HR75 and HR100).
Figures 6–8 present the contours of the Reynolds stresses ( $\langle u^{\prime2}\rangle$,
  $\langle v^{\prime2}\rangle$ and
  $- \langle u^{\prime}v^{\prime}\rangle$). The spatial distribution of the Reynolds stresses behind the DC for HR10 is identical to that of the isolated cylinder. Here, the normal stresses are more intense along the periphery of the reverse flow region, which coincides with the locations where vortex formation occurs along the span of the cylinder (Szepessy & Bearman Reference Szepessy and Bearman1992; Rodríguez et al. Reference Rodríguez, Lehmkuhl, Chiva, Borrell and Oliva2015). The wall-normal Reynolds normal stress is more enhanced in the downwash flow than in the upwash flow due to strong negative mean gradient
  $(\partial V/\partial y)$ induced by the downwash flow. It is also interesting to notice that the magnitudes of
  $\langle v^{\prime2}\rangle > \langle u^{\prime2}\rangle$, which is at variance with observations in many simple turbulent shear flows where
  $\langle u^{\prime2}\rangle > \langle v^{\prime2}\rangle$. This anisotropic behaviour is caused by negative production of
  $\langle u^{\prime2}\rangle$ along the boundaries of the reverse flow region which triggers the pressure-strain term to redistribute energy from the other normal stresses to
  $\langle u^{\prime2}\rangle$ (Essel et al. Reference Essel, Tachie and Balachandar2021). The Reynolds shear stress for the SC and DC of HR10 (figure 8a,b) demonstrate high positive values in the separated shear layer from the free end due to strong mean shear
  $(\partial U/\partial y)$ in that region. However, the negative Reynolds shear stress generated in the upwash flow for the SC and DC of HR10 is relatively weak.
Figure 6. Contours of streamwise Reynolds normal stress in the x–y plane for (a) SC, (b) HR10, (c) HR25, (d) HR50, (e) HR75 and ( f) HR100. Superimposed are the mean streamlines and the isopleth of 50 % forward-flow fraction (green solid line) which bounds the reverse flow region.
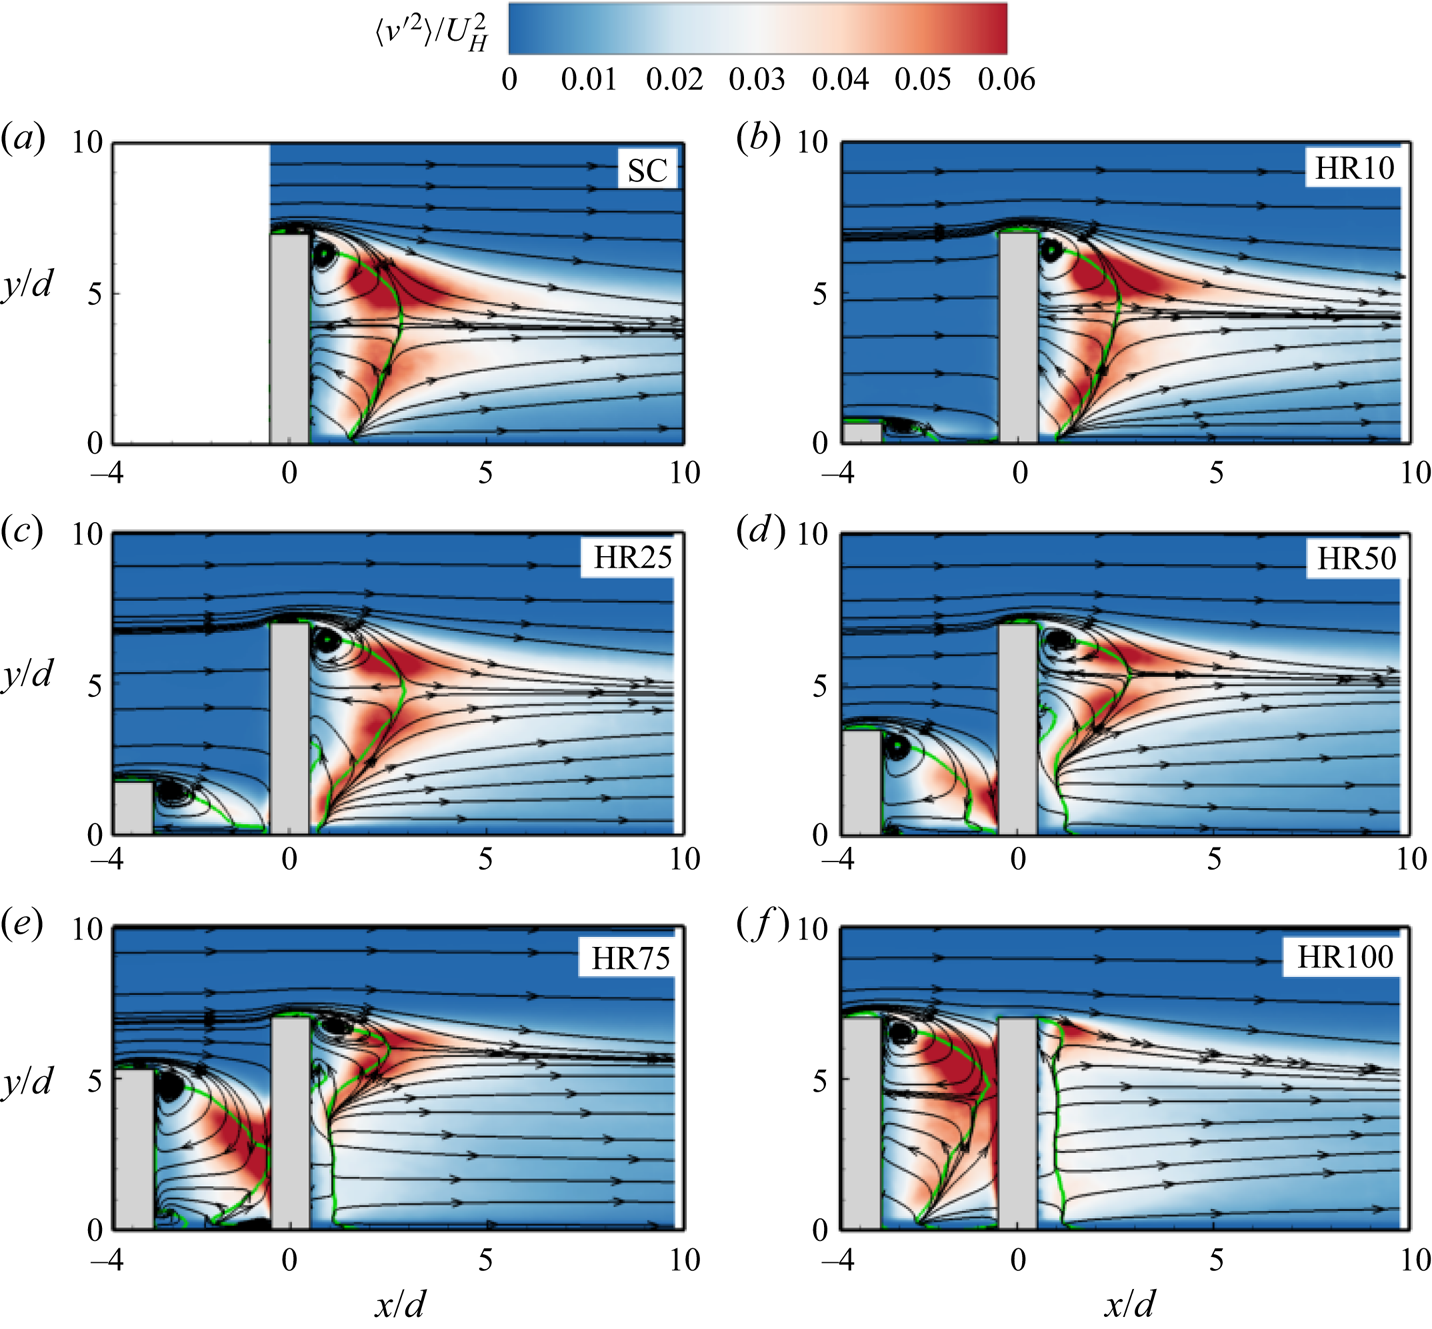
Figure 7. Contours of wall-normal Reynolds normal stress in the x–y plane for (a) SC, (b) HR10, (c) HR25, (d) HR50, (e) HR75 and ( f) HR100. Superimposed are the mean streamlines and the isopleth of 50 % forward-flow fraction (green solid line) which bounds the reverse flow region.
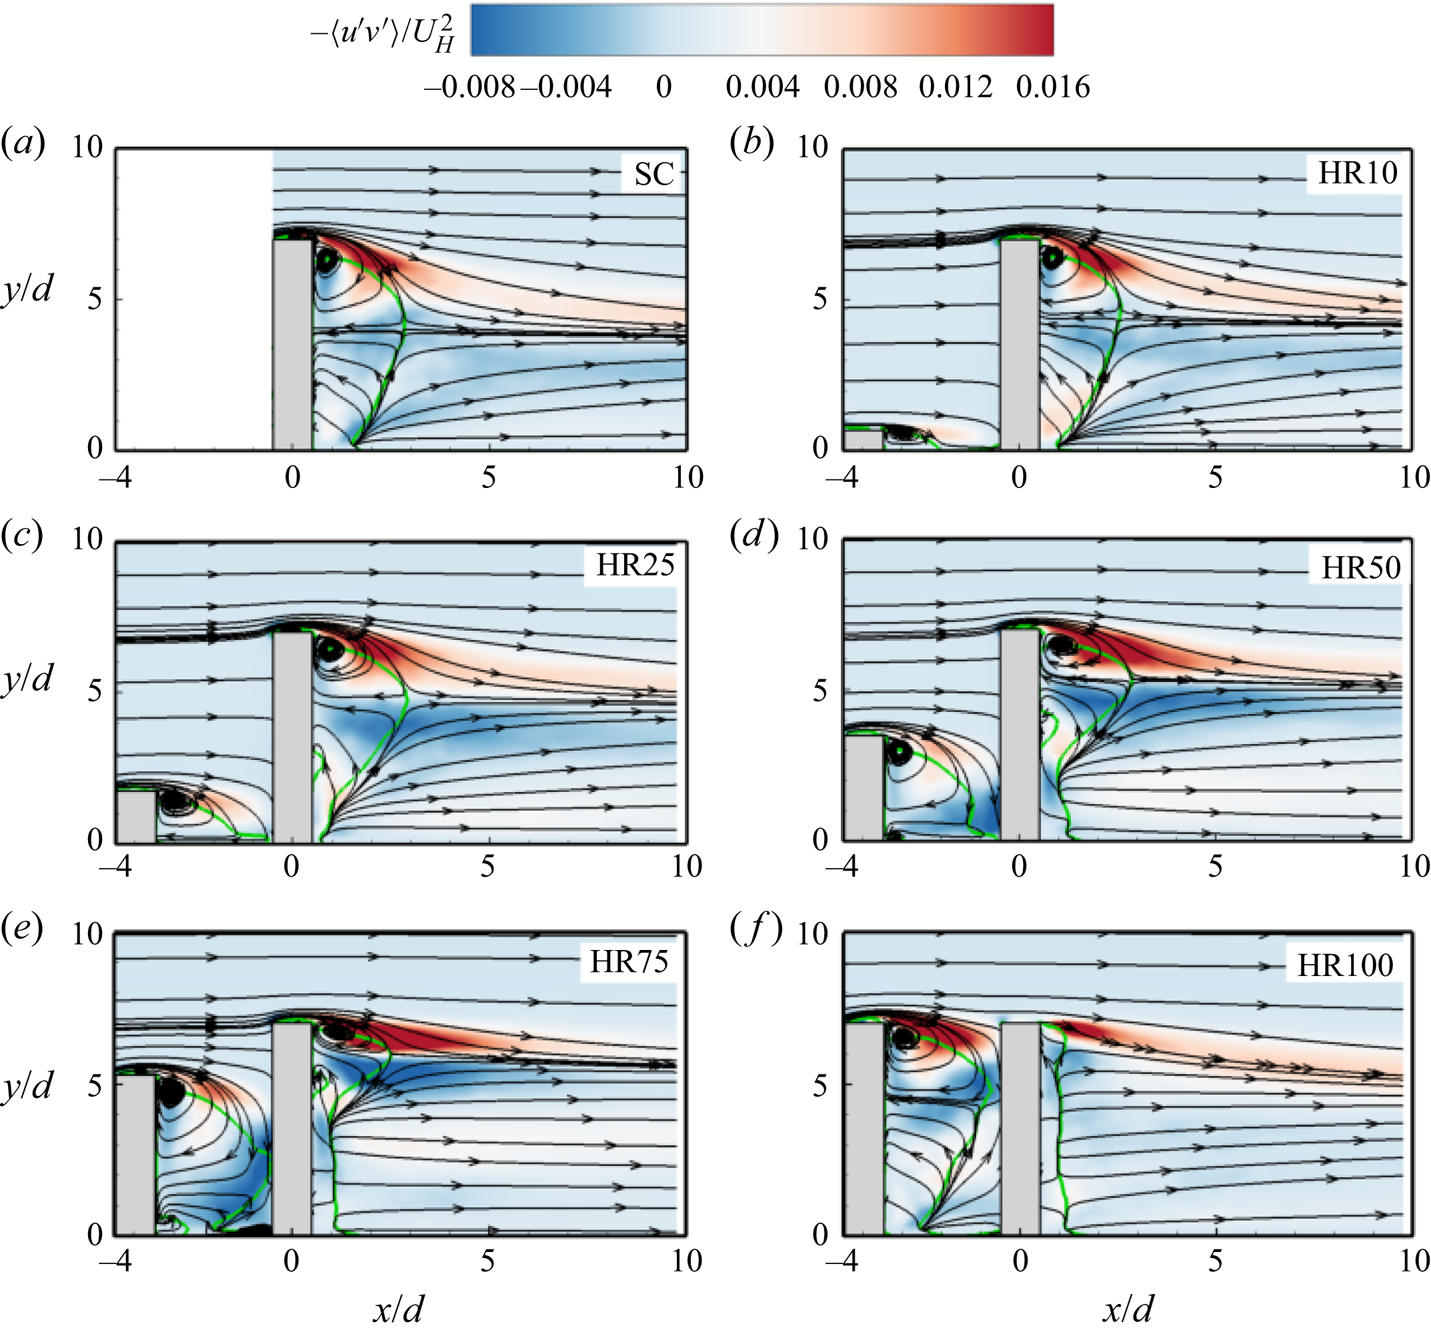
Figure 8. Contours of Reynolds shear stress in the x–y plane for (a) SC, (b) HR10, (c) HR25, (d) HR50, (e) HR75 and ( f) HR100. Superimposed are the mean streamlines and the isopleth of 50 % forward-flow fraction (green solid line) which bounds the reverse flow region.
For HR25 to HR100, the impingement of the downwash from the UC on the DC generates intense  $\langle v^{\prime2}\rangle$ region on the frontal surface of the DC (figure 7c–f), and large
  $\langle u^{\prime2}\rangle$ and
  $\langle v^{\prime2}\rangle$ in the strong upwash flow behind the cylinder. The enhanced
  $\langle v^{\prime2}\rangle$ in front of the DC is more pronounced as the height ratio increases. For HR100,
  $\langle u^{\prime2}\rangle$ and
  $\langle v^{\prime2}\rangle$ are significantly enhanced behind the UC compared with the DC and the other test cases. This would imply that the vortices are mainly formed behind the UC for HR100, and they collide with the DC disrupting the flow separation and vortex shedding activities along the entire span of the DC. The contours of the Reynolds shear stress (figure 8c–f) demonstrate that the downwash of flow along the frontal surface of the DC significantly increases the negative Reynolds shear stress in the gap region, while the strong upwash induced behind the DC enhances the negative Reynolds shear stress in that region as the height ratio increases from HR10 to HR75. For HR100 (figure 8f), the complete sheltering significantly suppressed the shear stress behind the DC compared with the other test cases.
3.2.2. Pumping motion of the reverse flow region
The quasi-periodic expansion and contraction of the reverse flow region (hereafter referred to as the pumping motion) are examined using the spatio-temporal variation of the reverse flow area behind each cylinder. Following Pearson, Goulart & Ganapathisubramani (Reference Pearson, Goulart and Ganapathisubramani2013), the instantaneous reverse flow area,  $A(t)$, is determined as
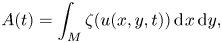 \begin{gather}A(t) = \int_M {\zeta (u(x,y,t))\,\textrm{d}\kern0.7pt x\,\textrm{d}y} ,\end{gather}
 \begin{gather}\zeta (p) = \left\{ {\begin{array}{@{}ll} 0&{p \ge 0}\\ 1&{p < 0} \end{array}} \right.,\end{gather}
where u is the instantaneous streamwise velocity,  $\zeta (p)$ is the detector function based on the event p,
  $\textrm{d}\kern0.7pt x$ and
  $\textrm{d}y$ represent the vector spacing in the x and y directions, respectively, and M is the masked region. For the UC, the masked region was defined as
  $x/d \in [ - 3.5, - 0.5]$ and
  $y/d \in [0.0,8.0]$ while for DC,
  $x/d \in [0.5,5.0]$ and
  $y/d \in [0.0,8.0]$. It should be noted that a detailed analysis of the pumping motion for the isolated cylinder is reported by Essel et al. (Reference Essel, Tachie and Balachandar2021), therefore only the major insights are used here to better understand the sheltering effects on the DC. Figure 9 compares the normalized instantaneous reverse flow area
  $(A/{A_m})$ for each cylinder for HR10, HR50, HR75 and HR100, where the mean reverse flow area
  $({A_m})$ is used to scale the profiles to facilitate comparison. The plot for HR25 is qualitatively similar to HR10. The cylinders for each test case exhibit a pumping motion, however, synchronized pumping motions between the UC and DC for HR50, HR75 and HR100 are remarkable.
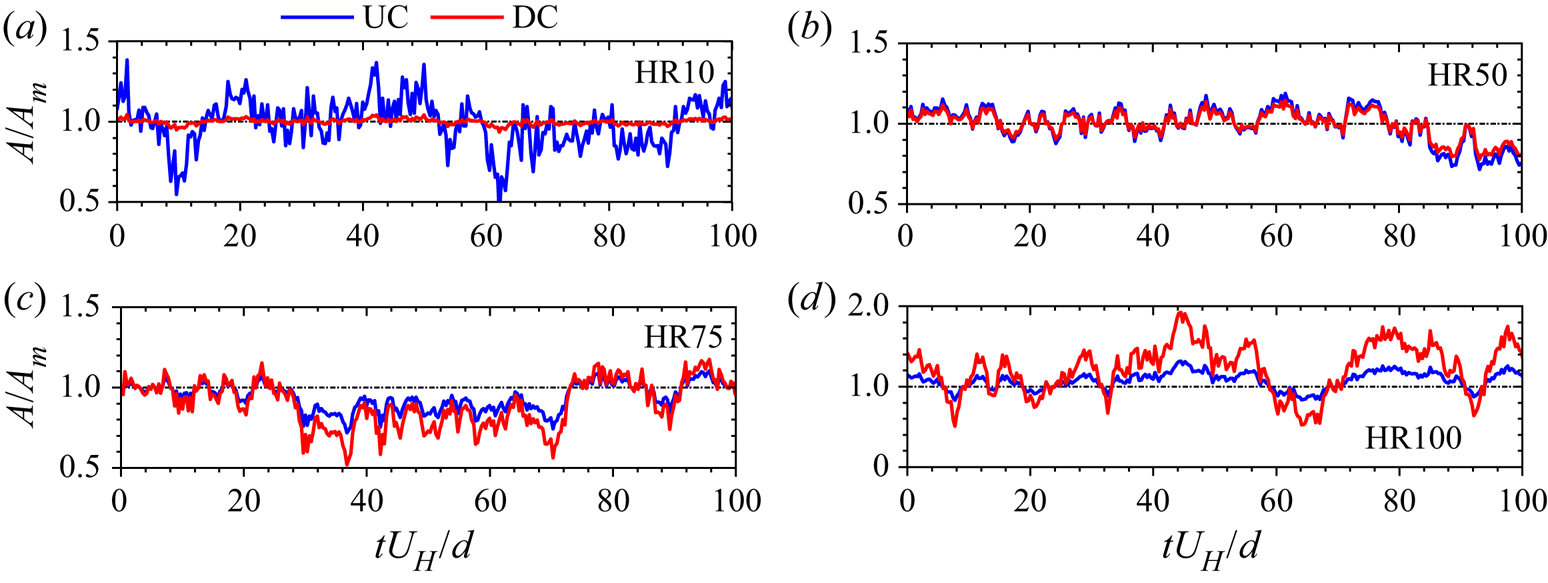
Figure 9. Time sequence of the instantaneous reverse flow area behind the UC and DC for (a) HR10, (b) HR50, (c) HR75 and (d) HR100.
Figure 10 shows the effects of sheltering on the normalized mean reverse flow area  $({A_m}/{d^2})$ and the maximum streamwise length of the reverse flow region
  $({L_r}/d)$ behind the UC and DC. Here, the
  ${L_r}/d$ values were determined as the streamwise distance from the rear end of each cylinder to the furthest point on the isopleth of the 50 % forward flow fraction (figure 4). In each plot, the corresponding value for the isolated cylinder is added for comparison. Except for the UC of HR100, the mean reverse flow area for the isolated cylinder is larger than that of the tandem cylinders. For HR10, it is interesting to notice that the value of
  ${A_m}/{d^2}$ for the DC is 15 % lower than that of the isolated cylinder. This implies that even at a low degree of sheltering, the downwash from the UC enhances the base vortices of the DC which, in turn, promote upwash of fluid away from the wall thereby reducing the reverse flow near the wall (see figures 5a and 5b). As the height ratio increases, the values of
  ${A_m}/{d^2}$ for the DC decrease linearly with a slope of 5.6 while those of the UC increase with a slope of 12.5. In figure 9(b), the
  ${L_r}/d$ values of the UC for HR25–HR100 are 17 %–30 % larger than that of the isolated cylinder. This observation is attributed to the blockage of the downwash flow by the DC. However, the values of
  ${L_r}/d$ for the DC increases from HR10 and plateaus at the value of the isolated cylinder for HR25 and HR50. Further increase in the degree of sheltering decreases
  ${L_r}/d$ by 13 % and 70 % for HR75 and HR100, respectively. The nonlinear reduction in
  ${L_r}/d$ with increasing
  $h/H$ for the DC is due to the growth of the reverse flow region in the unsheltered portion of the DC for HR25–HR75 (figure 4).
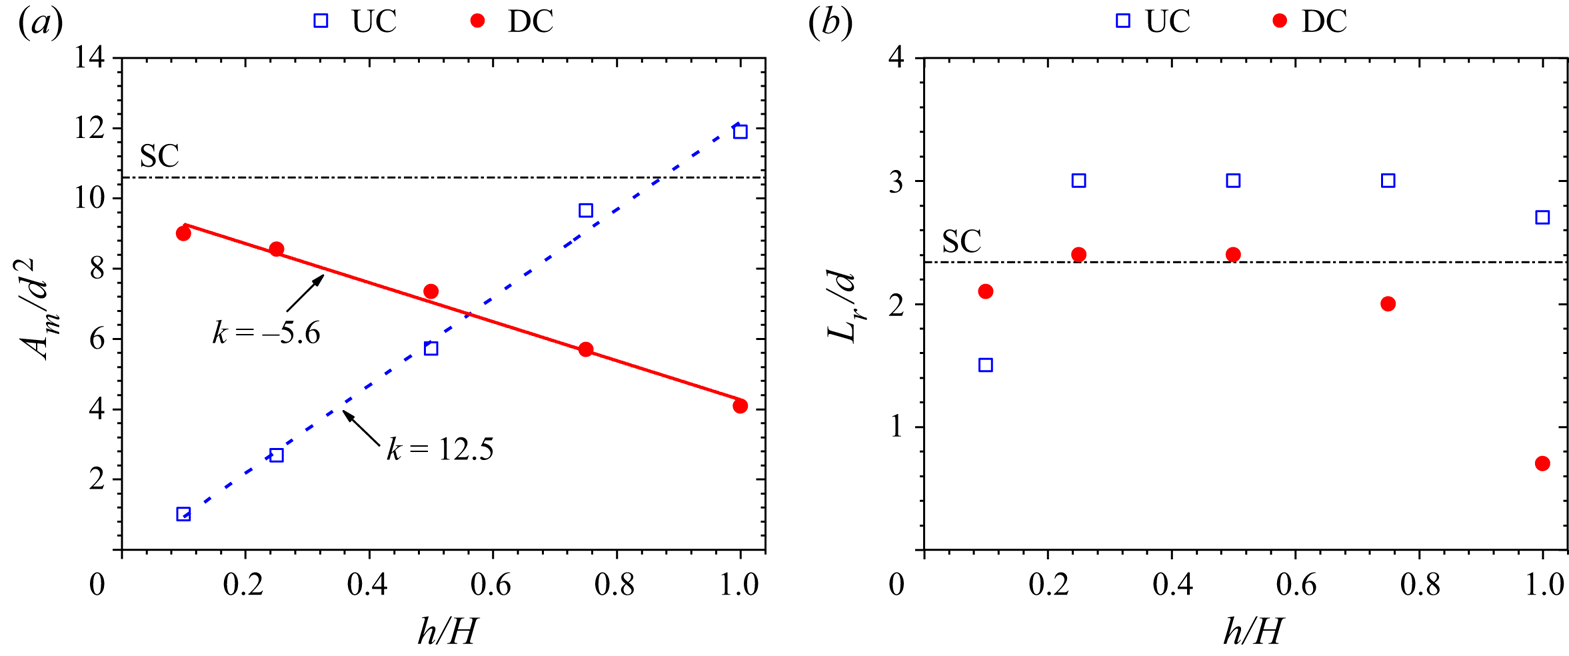
Figure 10. Variation of (a) mean reverse flow area and (b) streamwise extent of reverse flow region behind the upstream cylinder (UC) and downstream cylinder (DC) with height ratio, h/H.
Figure 11 provides further insight into the interconnection between the pumping motions of the tandem cylinders based on the contours of the joint probability density function (JPDF) of  $A^{\prime}/{d^2}$. For simplicity, the quadrants of the JPDF are denoted Q1 to Q4, where Q1 represents the synchronized expansion of the reverse flow regions of both cylinders with the opposite event (synchronized contraction) occurring in Q3. Q2 represents the event where the reverse flow region for the UC contracts while that of the DC expands, and Q4 represents the opposite event where the reverse flow region for the UC expands while that of the DC contracts. For HR10, the JPDF is stretched along the vertical axis, indicating that the pumping motion is predominant behind the DC. However, as the height ratio increases, the pumping motion of the UC gradually increases and matches that of the DC at HR50. For HR75, the JPDF is skewed towards Q1 and Q3, signifying a synchronized pumping motion behind the two cylinders. The JPDF for HR100, however, is aligned horizontally with skewness towards Q1 and Q4. This would imply that the reverse flow region for the UC of HR100 undergoes frequent expansion which affects the pumping motion of the DC.
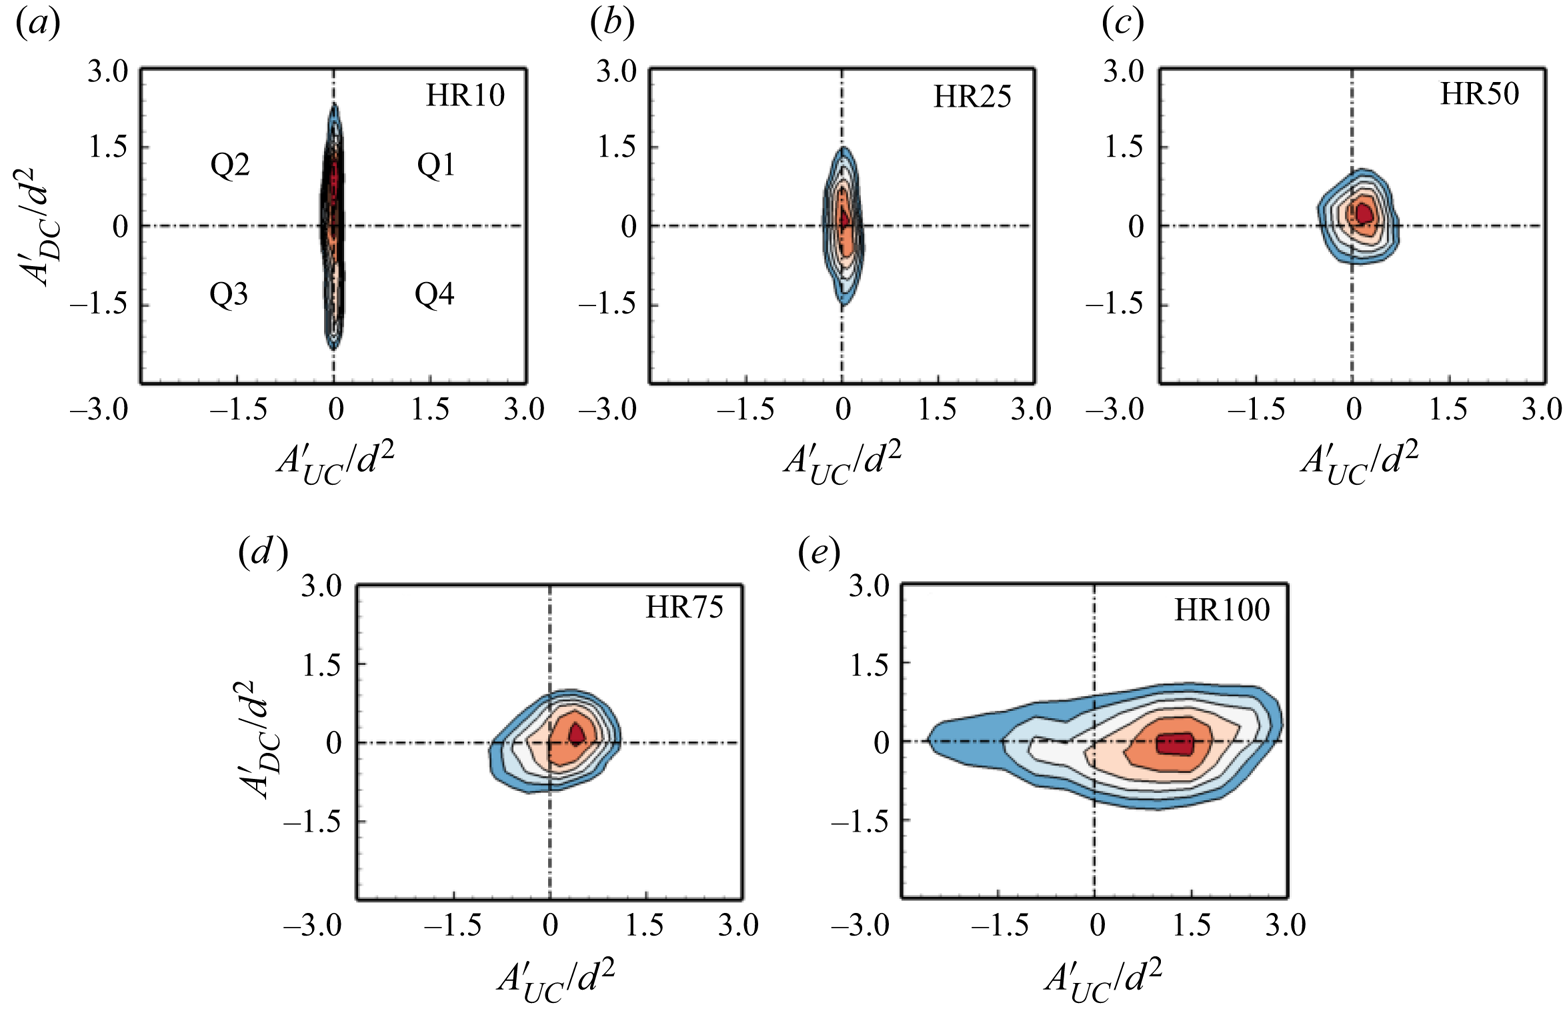
Figure 11. Joint probability density function (JPDF) for the fluctuations of the reverse flow area behind the UC and DC for (a) HR10, (b) HR25, (c) HR50, (d) HR75 and (e) HR100. The JPDF is normalized such that the maximum probability density is unity. Q1 to Q4 represent the quadrant regions.
The dominant frequencies associated with the pumping motion of the reverse flow regions of the tandem cylinders are examined using the frequency spectra shown in figure 12. Essel et al. (Reference Essel, Tachie and Balachandar2021) showed the isolated cylinder exhibits a low-frequency pumping motion (Strouhal number,  $S{t_{H,A}}\; = \; fd/{U_H} = 0.012$) with a second harmonic (i.e.
  $2S{t_{H,A}}$). For the tandem cylinders, the spectra of the UC and DC gradually collapse on each other as the height ratio increases. In the case of HR10, the Strouhal number for the UC is
  $S{t_{H,A}} = 0.023$, but the DC shows a similar value
  $(S{t_{H,A}} = 0.010)$ as the isolated cylinder. Further increase in the height ratio shows an interesting phenomenon where the pumping motions for the UC and DC for each test case exhibit similar frequencies (lock-in). Specifically,
  $S{t_{H,A}} = 0.010$ and 0.019 for HR25 and HR50,
  $0.006$ and
  $0.130$ for HR75, and
  $0.160$ and
  $0.300$ for HR100. It is worth noting that
  $S{t_{H,A}} = 0.130$ (HR75) and
  $0.160$ (HR100) are comparable to the vortex shedding frequency of the cylinders
  $(S{t_H} \approx 0.150)$ (see figure 21), while
  $S{t_{H,A}} = 0.300$ (HR100) corresponds to the second harmonic of the shedding frequency.
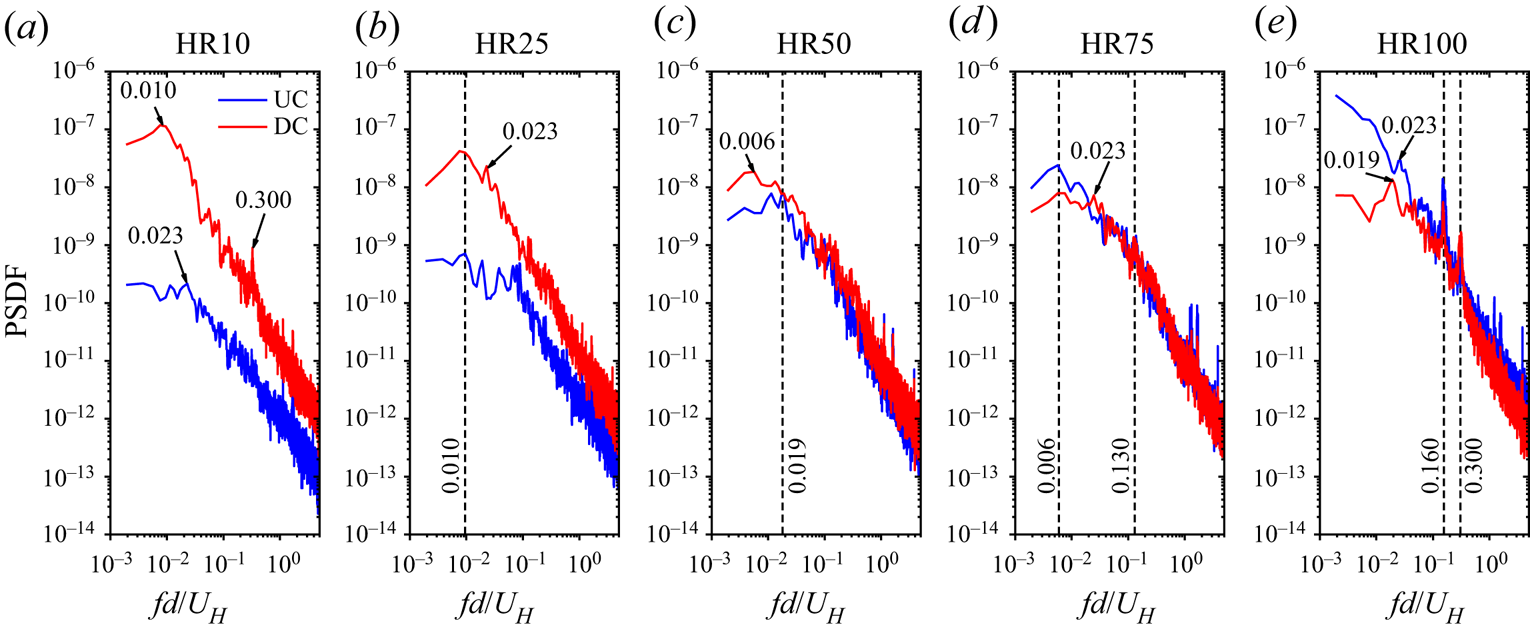
Figure 12. Spectra of the fluctuations of the reverse flow area behind the UC and DC for HR10 to HR100. PSDF, Power spectra density function.
3.2.3. Proper orthogonal decomposition
Proper orthogonal decomposition (POD) (Lumley Reference Lumley1967) was applied to the TR-PIV snapshots to explore the dynamic roles of coherent structures in the wake of the tandem cylinders. Each instantaneous velocity field,  ${u_i}(x,y,t)$, was decomposed as
 \begin{equation}{u_i}(x,y,t) = {U_i}(x,y) + {u^{\prime}_i}(x,y,t) = {U_i}(x,y) + \sum\limits_{n = 1}^N {\boldsymbol{\varPhi }_n^i(x,y)a_n^i(t)} ,\end{equation}
where the index i denotes the velocity component,  ${U_i}(x,y)$ and
  ${u^{\prime}_i}(x,y,t)$ are the mean and fluctuating velocities, respectively,
  $\boldsymbol{\varPhi }_n^i(x,y)$ is the orthogonal set of spatial eigenfunctions (modes) and
  $a_n^i(t)$ is their associated temporal coefficients, and
  $N = 30\;000$ is the number of snapshots used. Given the high temporal domain of the TR-PIV data, the POD coefficients can also provide insights on periodic features of the cylinders (Riches, Martinuzzi & Morton Reference Riches, Martinuzzi and Morton2018; Fang & Tachie Reference Fang and Tachie2019; Crane et al. Reference Crane, Popinhak, Martinuzzi and Morton2022). Here, the snapshot POD method by Sirovich (Reference Sirovich1987) was used to solve the eigenvalue problem to determine the eigenfunctions and eigenvalues
  $({\lambda ^n})$. The eigenvalues, which represent the energy content in each mode, were arranged in a descending order
  $({\lambda ^1} > {\lambda ^2} > \cdots {\lambda ^N})$ such that the first mode contains the largest turbulent kinetic energy (TKE). The low-order modes contain most of the total TKE and are associated with the energetic large-scale structures, while the high-order modes are associated with the small-scale structures. Detailed procedures for implementing the snapshot POD method are reported by Sen, Bhaganagar & Juttijudata (Reference Sen, Bhaganagar and Juttijudata2007) and Essel, Roussinova & Balachandar (Reference Essel, Roussinova and Balachandar2020).
To efficiently educe the coherent structures behind each cylinder, the POD was performed in two adjacent masked regions within the flow field, i.e. Mask I of  $x/d \in [ - 4.5, - 0.5]$ and
  $y/d \in [0.0,10.0]$ for the UC and Mask II of
  $x/d \in [ - 0.5,8.0]$ and
  $y/d \in [0.0,10.0]$ for the DC. To facilitate comparison, the same masked regions were also used for the isolated cylinder, where Mask I represents the approach flow (AF) while Mask II captures the wake of the isolated cylinder. It should be noted that the region occupied by each cylinder was blanked out in each mask.
The fractional energy contributions of the first 100 modes for each test case are examined in figure 13(a), while the cumulative contributions of the five most energetic modes compared with the first mode are shown in figure 13(b). The approach flow of the isolated cylinder is energetic as mode 1 contains 13.3 % TKE while the first five modes contain 35.0 % TKE. These results agree with the unperturbed TBL flow of Hamed & Peterlein (Reference Hamed and Peterlein2020) which showed 16.3 % TKE for mode 1 and 33.3 % TKE for the first four modes. With the presence of the UC in the same mask region as AF, the energy content of mode 1 reduced by 19 %–47 %, however, the reduction was not monotonic with increasing aspect ratio of the UC, demonstrating the dynamic changes in the gap flow structure at various height ratios. The cumulative energy of the first five modes, however, shows 21 % to 39 % reduction in energy as the height ratio increases. Also, the cumulative energy of the first 100 modes for AF captured 77 % TKE, but the energy content behind the UC gradually decreased to 63 % TKE as the height ratio increased to HR100.
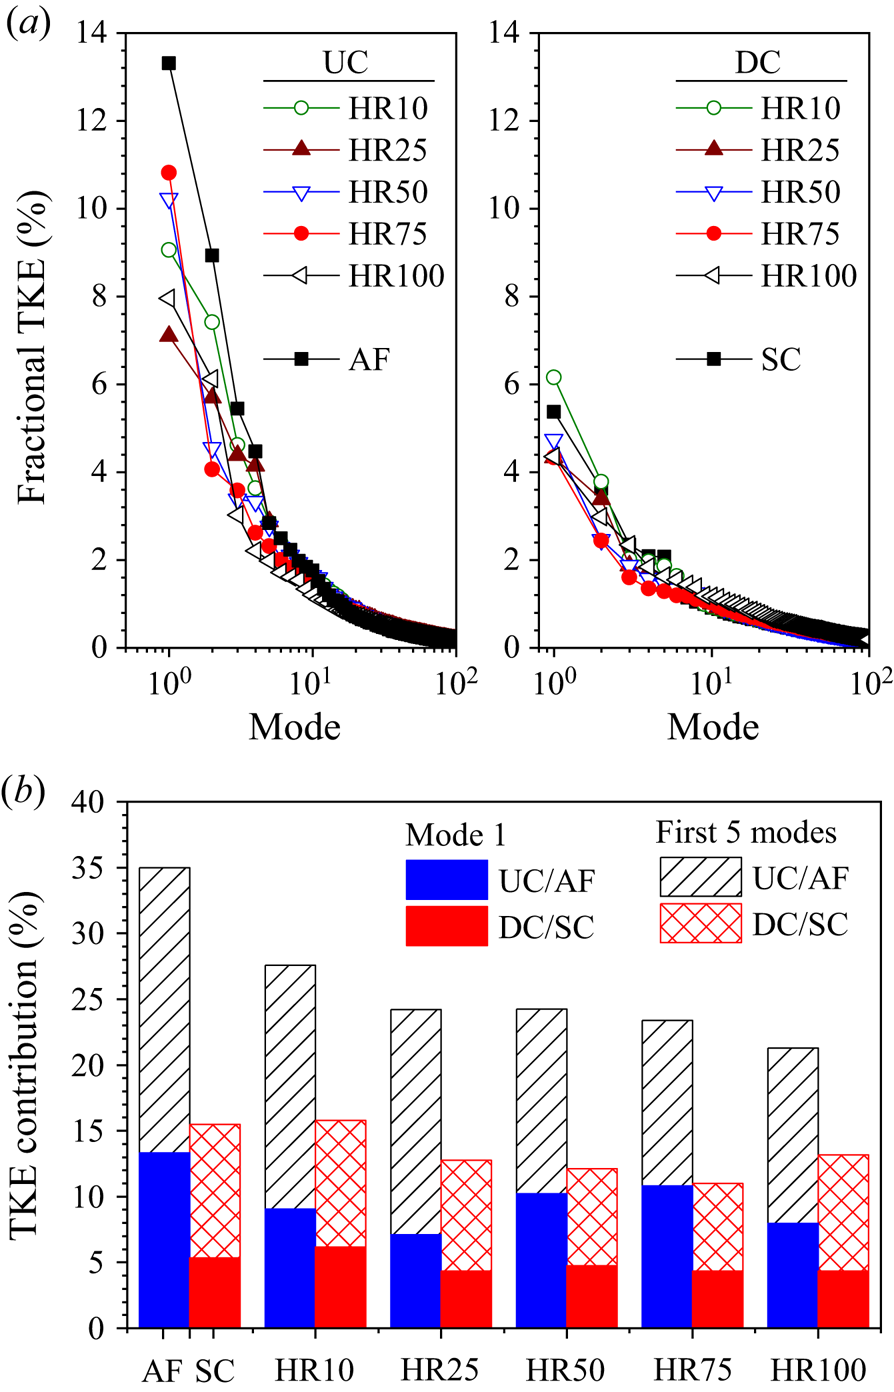
Figure 13. Distributions of the (a) fractional energy contributions of the first 100 modes and (b) cumulative energy contribution of the first five modes compared with first mode for the UC and DC for HR10 to HR100 and approach flow (AF) and SC.
The energy content of mode 1 is 5.4 % TKE in the wake of the isolated cylinder and 6.2 % TKE in the wake of the DC of HR10. A subsequent increase in height ratio results in a 17 % reduction in TKE for the DC of HR25 to HR100. Hamed & Peterlein (Reference Hamed and Peterlein2020) also examined the energy captured by mode 1 in a flow field around an isolated cylinder and tandem cylinders of height ratios, h/H = 0.50, 0.75 and 1.00, and spacing ratio, s/d = 4, and observed 9 %–13 % reduction in energy content for the tandem cylinders. The present results also show that the five most energetic modes for the SC and DC of HR10 contribute 15.6 % TKE, while the energy contents for HR25 to HR100 are reduced to 12 % TKE. The first 100 modes capture approximately 53 % TKE behind the SC and HR10 to HR75, but the energy captured increased by 10 % in the case of HR100.
Figure 14 compares the contours of the streamwise eigenfunction,  ${\phi _u}$, of mode 1 for all the test cases. Here, the two masked regions were stitched together in each plot and the vectors of
  ${\phi _u}$ and the wall-normal component,
  ${\phi _v}$, are superimposed to reveal the prominent flow patterns. The contours are also normalized by the maximum
  ${\phi _u}$ value in each masked region to highlight the low
  $({\phi _u} < 0)$ and high
  $({\phi _u} > 0)$ momentum regions. Mode 1 reveals that the approach flow of the isolated cylinder is dominated by a high momentum region inclined in the streamwise direction, and a downwash of flow towards the frontal surface of the cylinder. The inclined momentum region in mode 1 (figure 14a) has also been observed in previous TBL studies with smooth (Hamed & Peterlein Reference Hamed and Peterlein2020) and rough (Placidi & Ganapathisubramani Reference Placidi and Ganapathisubramani2015) surfaces, and separation due to severe adverse pressure gradient (Elyasi & Ghaemi Reference Elyasi and Ghaemi2019), demonstrating the universality of the mode's structure in a TBL. Behind the isolated cylinder, mode 1 shows a low momentum region with a spatial distribution similar to that of the Reynolds normal stresses (see figures 6 and 7). This should be expected as mode 1 makes the largest contribution to TKE. The vectors also depict that fluid is mostly entrained towards the separated shear layer near the free end of the cylinder.
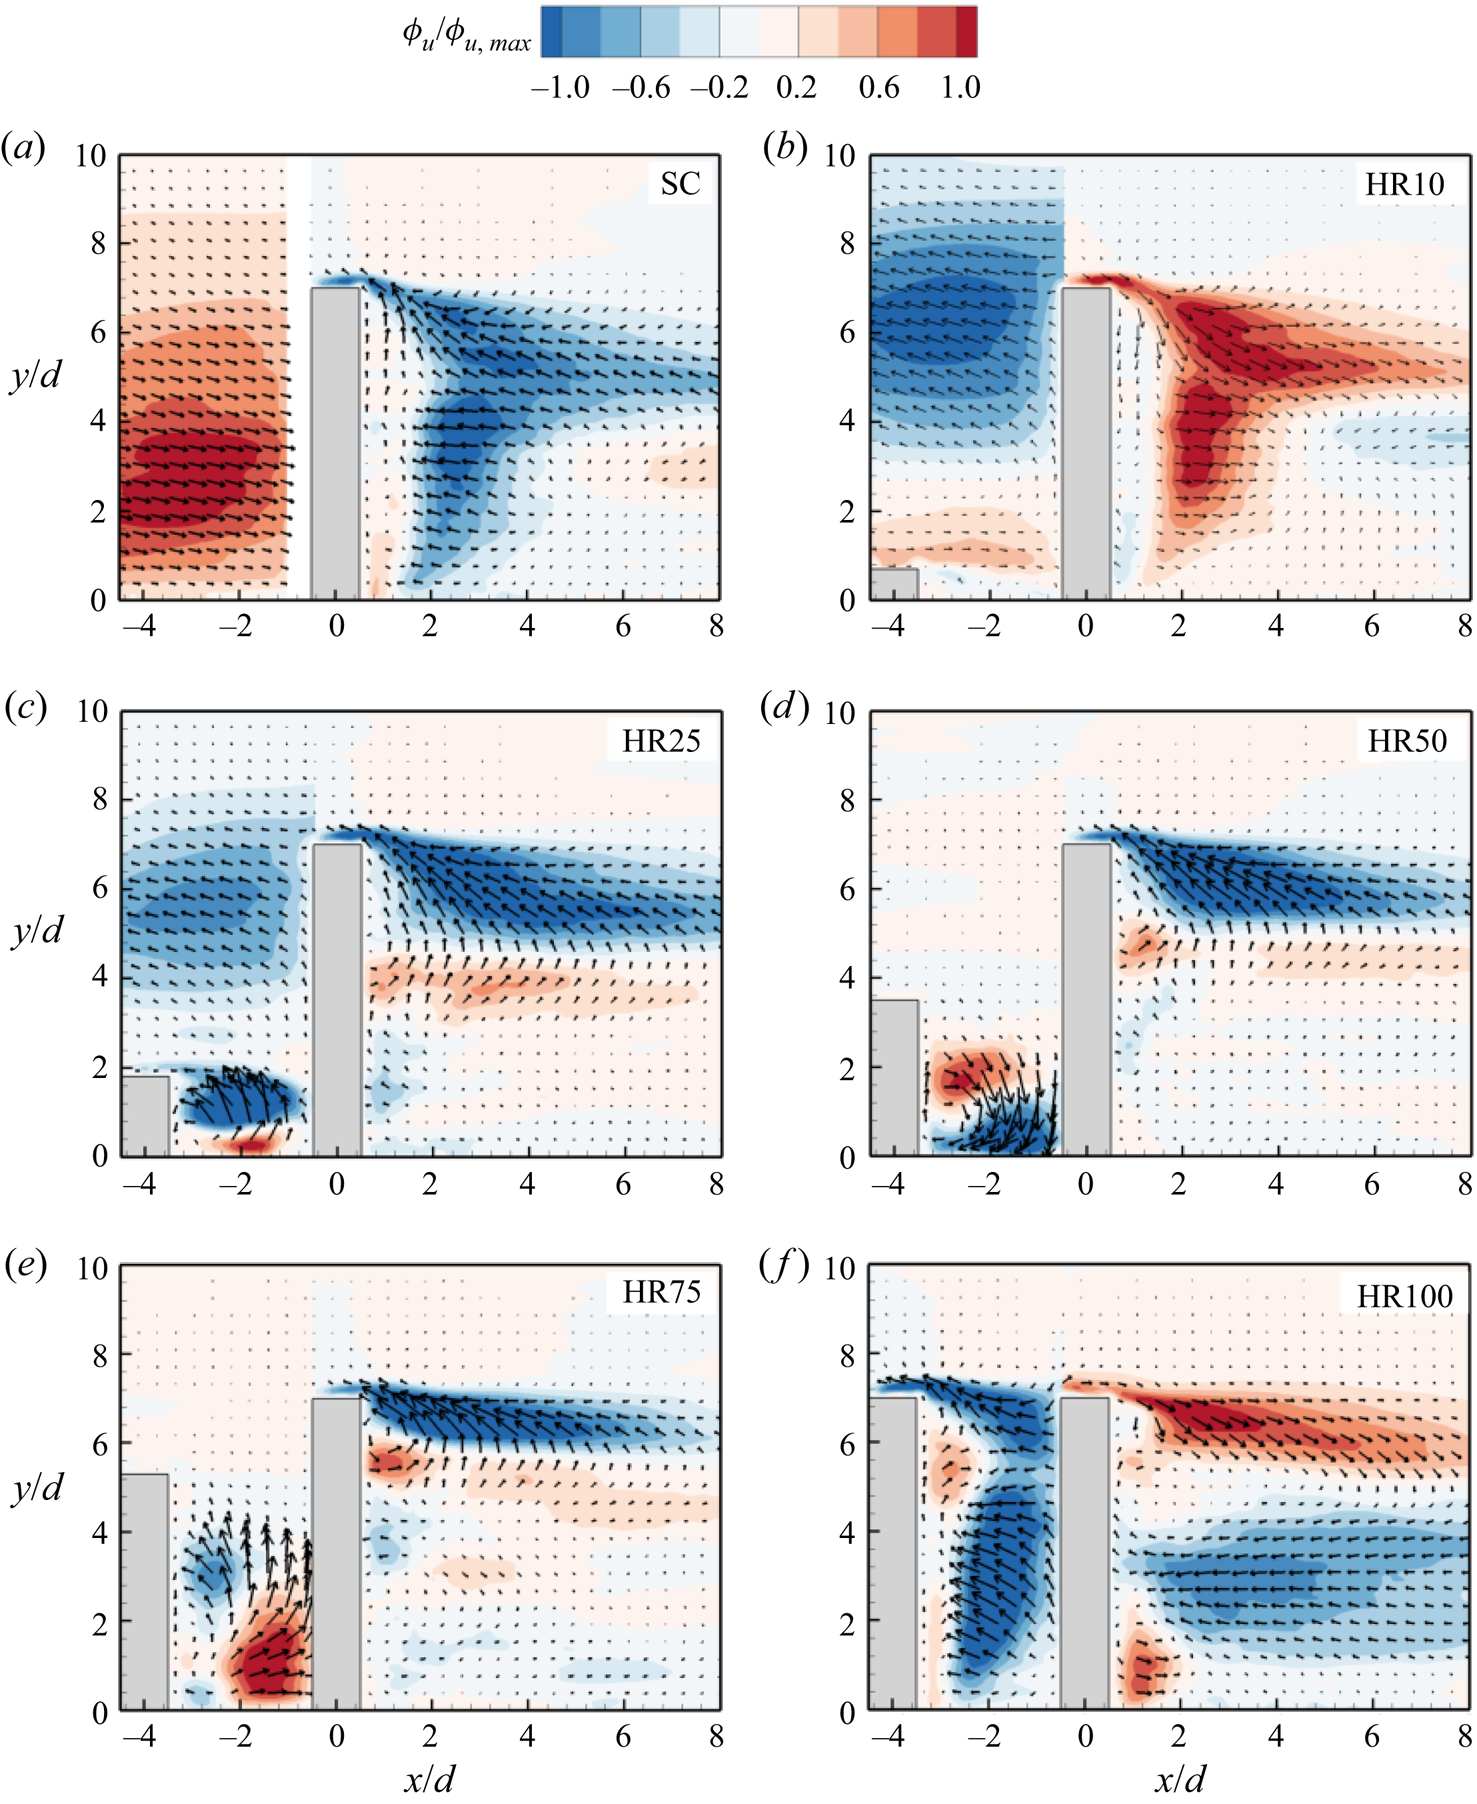
Figure 14. Contours of streamwise eigenfunction  $({\phi _u})$ of mode 1 for (a) SC, (b) HR10, (c) HR25, (d) HR50, (e) HR75 and ( f) HR100. The contours are also normalized by the maximum
  ${\phi _u}$ value in each region.
For the tandem cylinders, the spatial distribution of mode 1 is different from that of the isolated cylinder and strongly dependent on the height ratio. HR10 shows a downwash of high momentum fluid from the free end of the UC towards the base of the DC. The approach flow above the UC is deflected backwards as it impinges on the DC, and the backflow feeds into a low momentum region near the free end of the DC. This low momentum region is also present near the free end of the DC for HR25 but diminishes as the height ratio increases. For HR25 to HR75, the gap between the cylinders is occupied by a pair of high and low momentum regions that are associated with a spanwise vortex core located near the base of the UC. In the case of HR25 and HR75, the spanwise vortex core rotates in the counter-clockwise (CCW) direction which induces an upwash of flow that is deflected by the DC towards the free end of the UC. In contrast, the spanwise vortex core for HR50 rotates in the clockwise (CW) direction, therefore promoting the downwash of flow that is also deflected by the DC towards the base of the UC. The gap region for HR100 is mainly occupied by low momentum regions with backward deflection of flow from the frontal surface of the DC. Behind the DC, the flow for HR10 is characterized by a strong downwash of high momentum fluid while HR25 to HR100 show high and low momentum regions with shapes similar to the shear layers observed in the contours of the Reynolds shear stress (figure 8). The vectors also demonstrate that the upwash induced behind the DC for HR25 to HR75 (figure 5) is mostly entrained into the separated shear layer near the free end of the cylinder. The vectors for HR100, however, show strong downwash from the free end and entrainment of the downwash flow towards the mid-height of the DC.
Figure 15 presents the spatial distributions of modes 2 and 5 for the isolated cylinder and the tandem cylinders (HR25, HR75 and HR100). The spatial distributions of the modes behind the DC for HR10 are qualitatively similar to that of the isolated cylinder, while the modes for HR50 are similar to HR75, therefore these plots are not shown for brevity. In mode 2, the approach flow for the SC exhibits a pair of large high and low momentum regions associated with sweep and ejection motions, in agreement with previous TBL studies (Placidi & Ganapathisubramani Reference Placidi and Ganapathisubramani2015; Hamed & Peterlein Reference Hamed and Peterlein2020). The wake of the SC for mode 2 demonstrates a strong upwash of high momentum fluid from the base of the cylinder, which is associated with the role of the base vortices. In the case of the tandem cylinders, mode 2 exhibits strong upwash in the gap region of HR10 and HR25 and downwash for HR100. However, mode 2 for HR50 and HR75 reveals the presence of two counter-rotating vortex cores in the gap between the cylinders. These counter-rotating vortex cores bifurcate the gap flow by generating concurrent upwash and downwash motions in the gap. Behind the DC of the tandem cylinders, the effect of sheltering is evident as the high momentum region with strong upwash decreases in size and moves further away from the wall as height ratio increases.
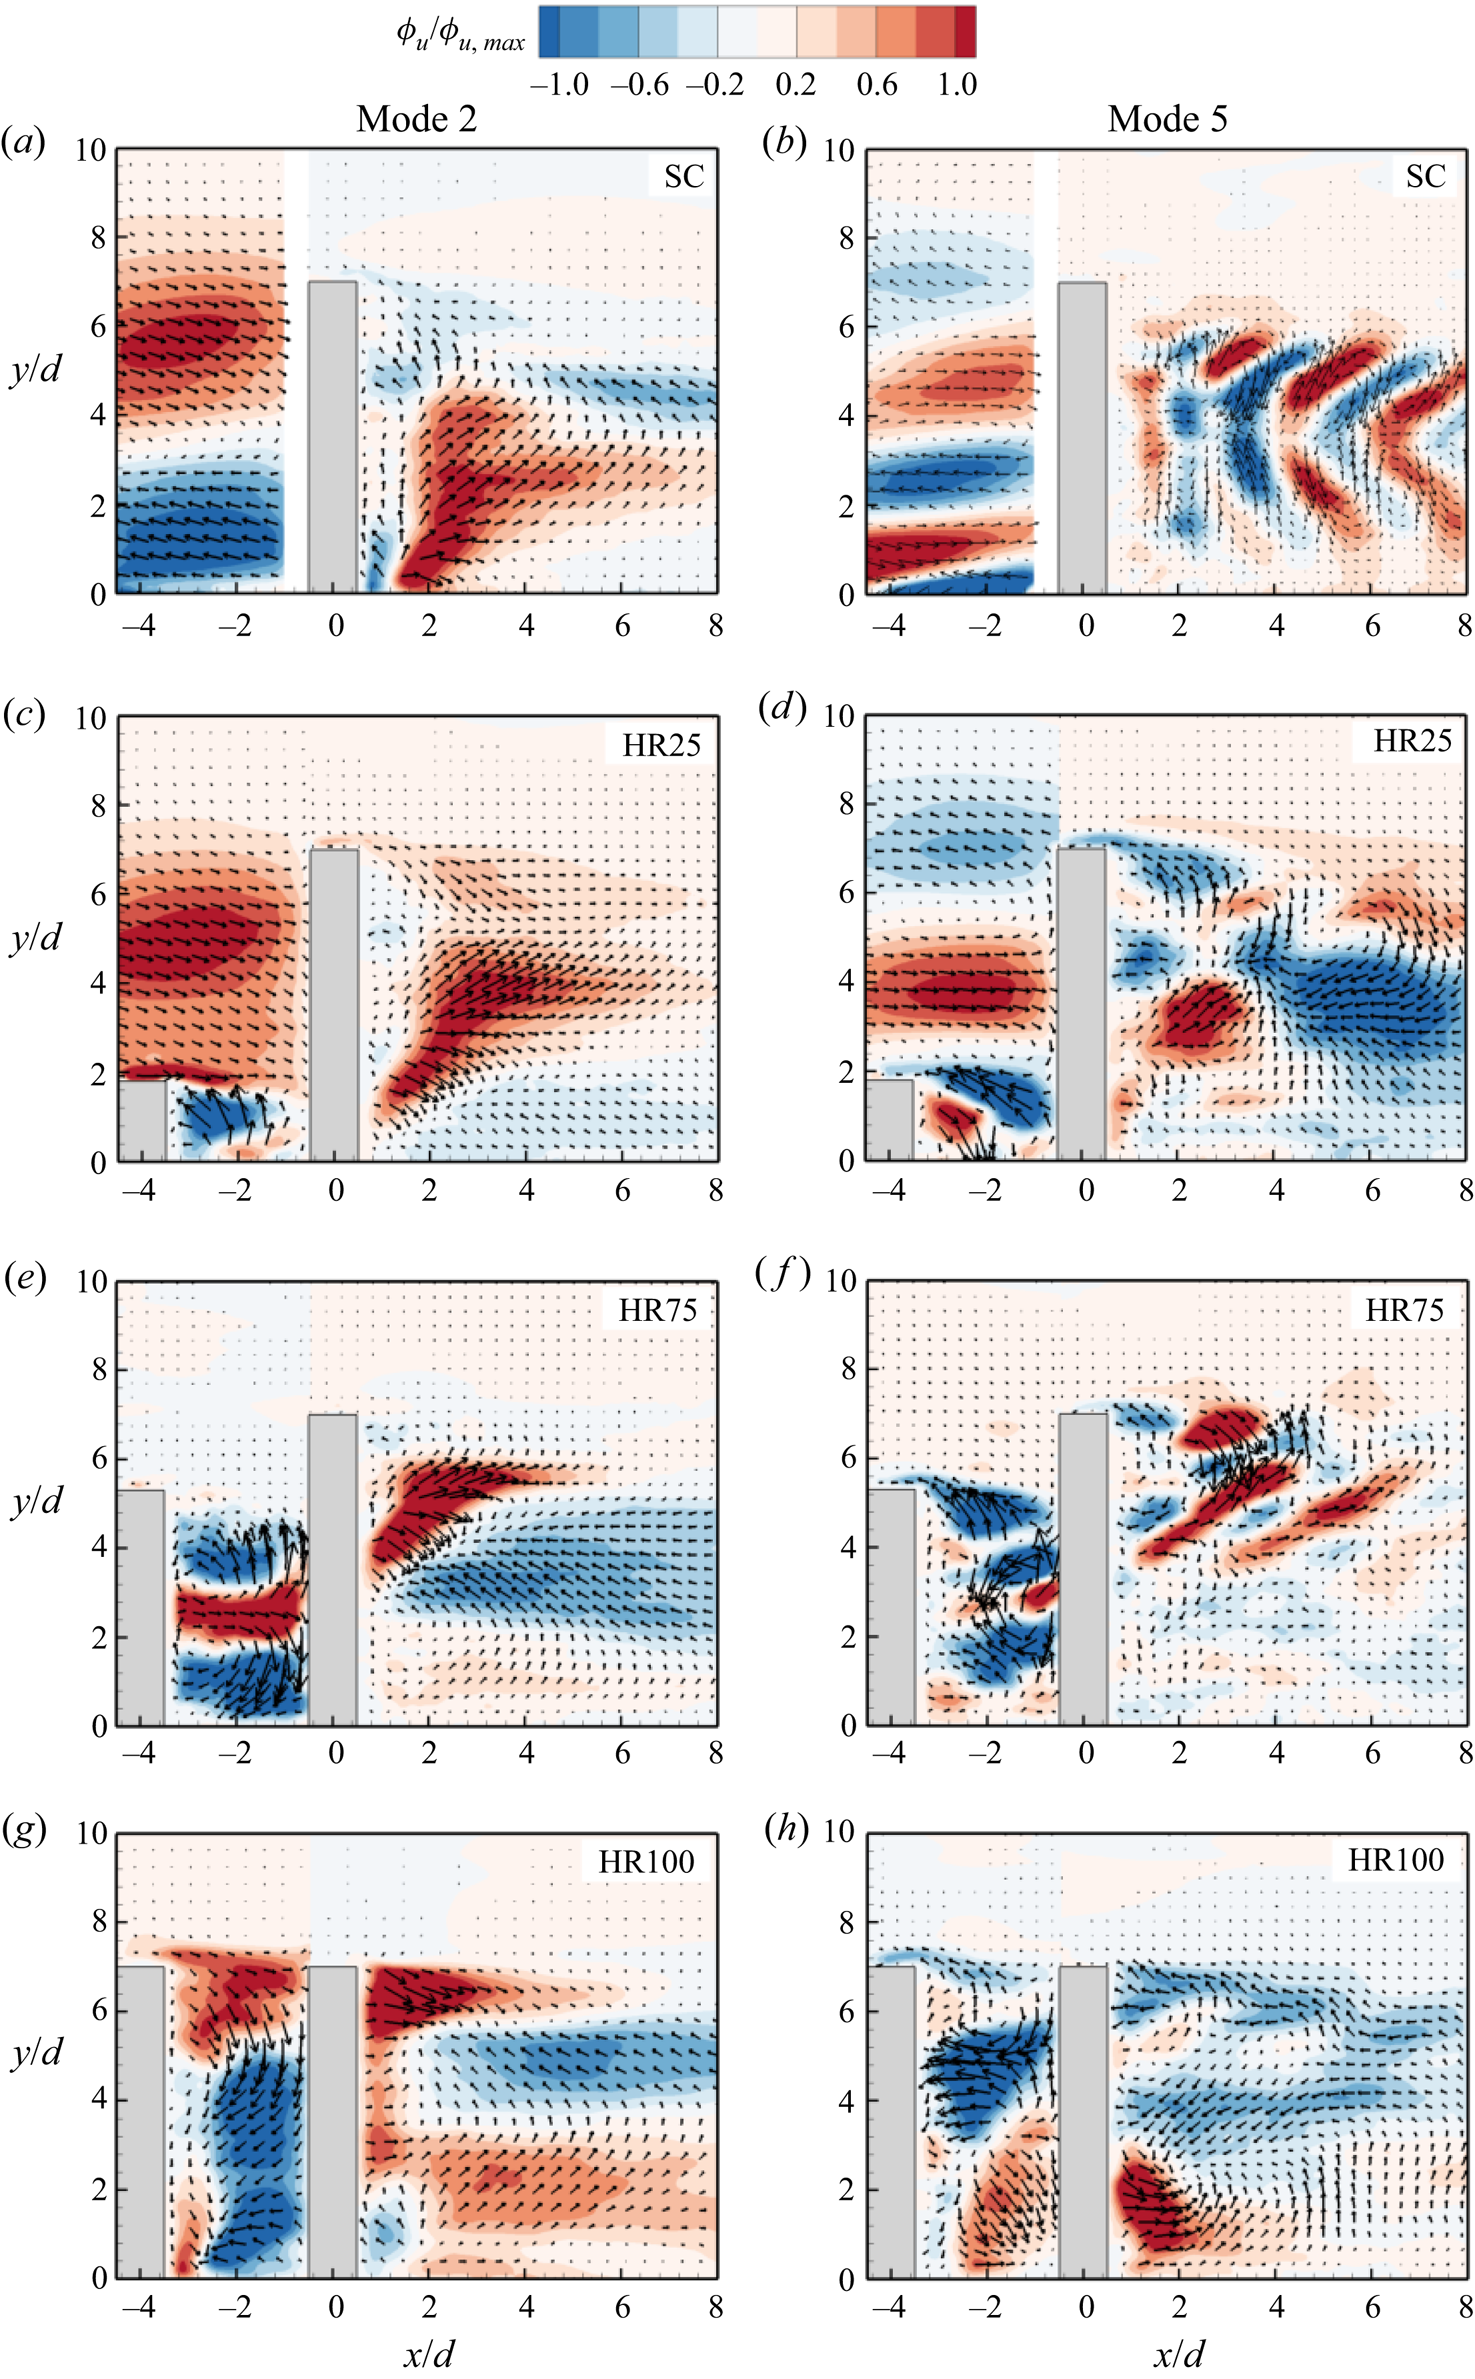
Figure 15. Contours of streamwise eigenfunction  $({\phi _u})$ of modes 2 and 5 for (a,b) SC, (c,d) HR25, (e, f) HR75 and (g,h) HR100. The contours are also normalized by the maximum
  ${\phi _u}$ value in each region.
Mode 5 for the SC reveals several alternating positive/negative momentum regions in front of the cylinder, which are signatures of the structures that interact with the cylinder (see figure 16a). The wake of the cylinder also exhibits alternating vortex cores that are attributed to the vortex shedding from the sides of the cylinder. Similar patterns have been observed in previous studies of isolated cylinders (Wang Reference Wang2019; Chen et al. Reference Chen, Li, Sun and Liang2022). With the presence of the UC, the vortex cores in the gap region and behind the DC are less organized as the height ratio increases.
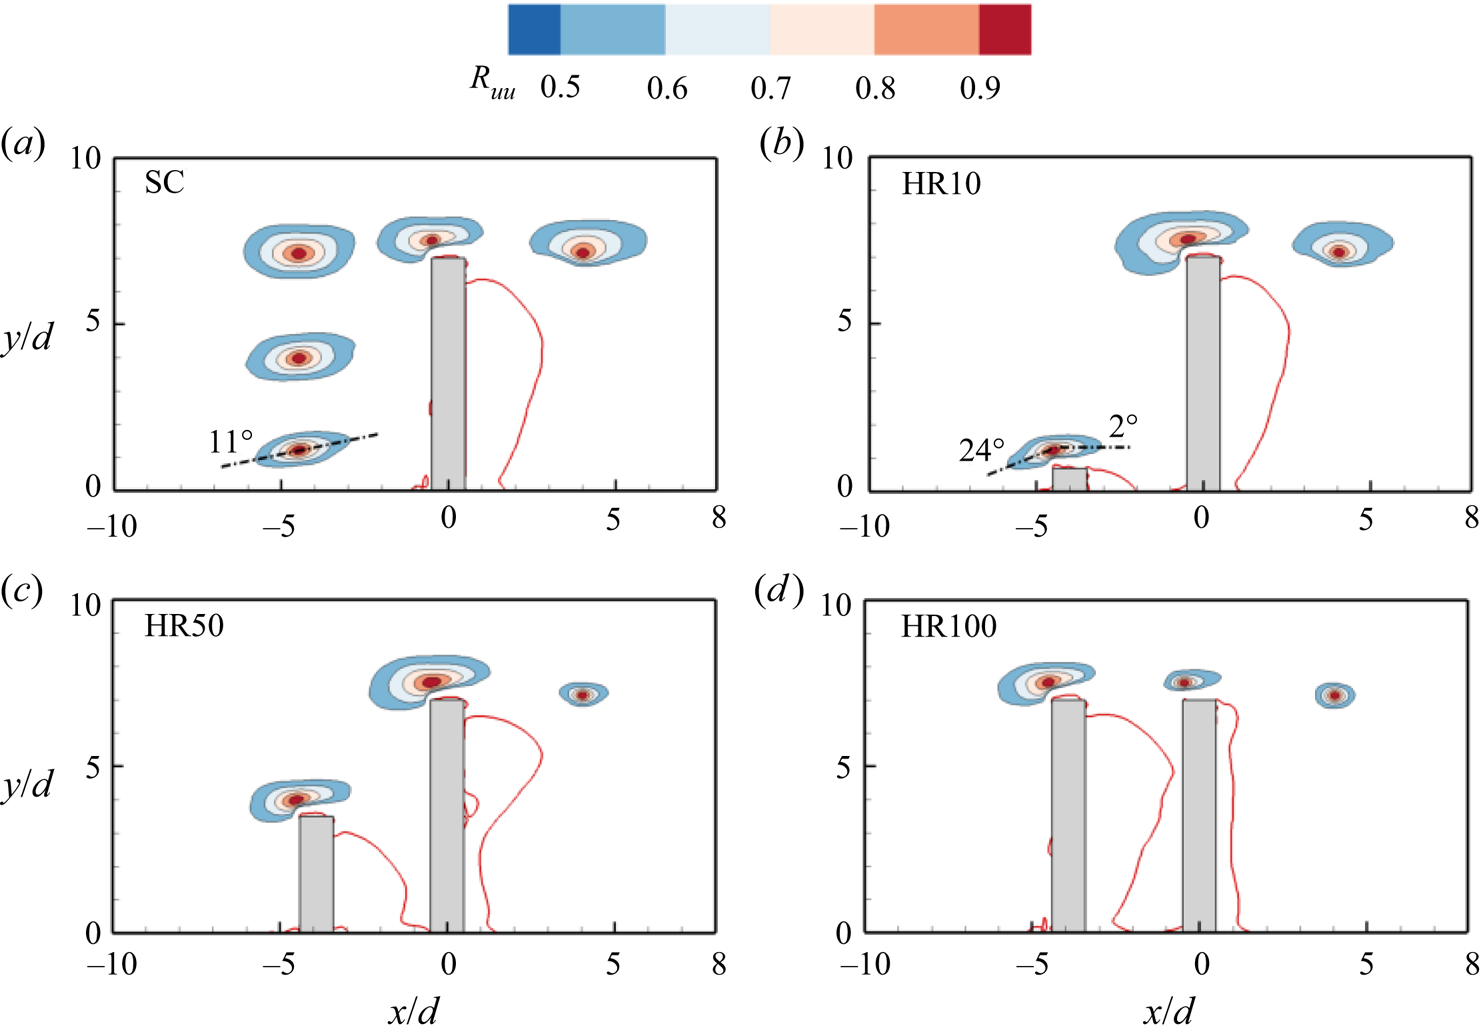
Figure 16. Contours of the two-point autocorrelations of the streamwise velocity fluctuations,  ${R_{uu}}$ for (a) SC, (b) HR10, (c) HR50 and (d) HR100. Superimposed is the isopleth of 50 % forward-flow fraction (red solid line) which bounds the reverse flow region.
3.2.4. Spatial coherence of flow structures
To further understand the impact of sheltering on the flow structures of the tandem cylinders, the spatial coherence of the large-scale structures is examined using two-point autocorrelations of the velocity fluctuations evaluated as
 \begin{equation}{R_{\xi \xi }}({x_{ref}} + \Delta x,{y_{ref}} + \Delta y) = \frac{{\langle \xi ({x_{ref}},{y_{ref}})\xi ({x_{ref}} + \Delta x,{y_{ref}} + \Delta y)\rangle }}{{\langle \sqrt {\langle {\xi ^2}\rangle } ({x_{ref}},{y_{ref}})\sqrt {\langle {\xi ^2}\rangle } ({x_{ref}} + \Delta x,{y_{ref}} + \Delta y)\rangle }},\end{equation}
where  $\xi $ represents the fluctuating velocity component,
  $({x_{ref}},{y_{ref}})$ denotes the reference location, and
  $\Delta x$ and
  $\Delta y$ are the spatial separation in the streamwise and wall-normal directions, respectively.
Figure 16 shows contours of the two-point correlations of the streamwise velocity fluctuations,  ${R_{uu}}$, in the flow field of the isolated cylinder and selected cases of the tandem cylinders (HR10, HR50 and HR100). The contour levels range from 0.5 to 0.9 at an interval of 0.1. The reference locations were selected at the leading edge of each cylinder (i.e.
  $x/d\; = \; - 4.5$ for the UC and
  $x/d\; = \; - 0.5$ for the DC/SC and y-location of 0.5d from the top surface of each cylinder) and behind the DC/SC
  $([x/d,y/d] = [4.0,7.0])$. The spatial coherence of the undisturbed structures at the locations corresponding to the leading edge of the UC are also shown in front of the SC for comparison. In each plot, it is immediately apparent that the spatial coherence of
  ${R_{uu}}$ is stronger in the streamwise direction and this is attributed to the streamwise convection of large-scale structures. Figure 16(a) demonstrates that the large-scale structures in the approach flow are inclined near the wall and increase in size away from the wall. Previous TBL studies (Adrian, Meinhart & Tomkins Reference Adrian, Meinhart and Tomkins2000; Liu, Adrian & Handratty Reference Liu, Adrian and Handratty2001) have associated the inclined
  ${R_{uu}}$ contours to the paradigm of hairpin packets that induce strong ejection and sweep motions in the TBL, as observed in figure 15(a). Volino, Schultz & Flack (Reference Volino, Schultz and Flack2009) attributed the angle of inclination,
  $\beta \mathrm{^\circ }$, of the
  ${R_{uu}}$ contours to the average inclination of the hairpin packets and typical angles of
  $\beta \mathrm{^\circ }\; = 10\mathrm{^\circ }\unicode{x2013} 20\mathrm{^\circ }$ have been reported in previous TBL studies (Christensen & Adrian Reference Christensen and Adrian2001; Volino et al. Reference Volino, Schultz and Flack2009; Wu & Christensen Reference Wu and Christensen2010; Fang & Tachie Reference Fang and Tachie2020). The angle of inclination of the
  ${R_{uu}}$ contour near the wall,
  $\beta \mathrm{^\circ }\; = 11\mathrm{^\circ }$, for the approach flow is, therefore, consistent with previous investigations. The streamwise extent of
  ${R_{uu}}$, defined as twice the streamwise distance from the self-correlation point to the farthest downstream point on the 0.5 isopleth (Christensen & Wu Reference Christensen and Wu2005; Volino, Schultz & Flack Reference Volino, Schultz and Flack2007), is
  $3.1d\unicode{x2013} 3.5d$ for the contours upstream of the SC. At the leading edge of the SC, the spatial coherence of the lower part of the
  ${R_{uu}}$ contour is disrupted as the structures adjust to the blockage and presence of the separated shear layer on the top surface of the cylinder. Downstream of the SC, the strong downwash from the free end also disrupts the spatial coherence of the contours in the wall-normal direction.
For the tandem cylinders, the presence of the UC modifies the shape of the structures that interact with the DC. Also, the spatial coherence of the structures on the leading edge and downstream of the DC significantly decreases as the height ratio increases. For example, the streamwise extent of  ${R_{uu}}$ at the leading edge of the DC is
  $3.7d$ for HR10 but decreased by
  $14\,\%\; \unicode{x2013} 38\,\%$ for HR25 to HR100. Downstream of the DC, the streamwise extent for HR10
  $(3.4d)$ decreased by
  $52\,\%\unicode{x2013} 64\,\%$ as the height ratio increased from HR50 to HR100. It is worth noting that the streamwise extent at the leading edge of HR10 is 22 % larger than that of the SC, but downstream of the cylinder, the streamwise extent is 12 % smaller than that of the SC. The effects of sheltering on the spatial coherence of the wall-normal velocity fluctuations,
  ${R_{vv}}$, was observed to be qualitatively similar to that of
  ${R_{uu}}$.
3.3. Wake characteristics in the spanwise planes
Given the unsteady 3-D nature of the flow around the unequal-height tandem cylinders, the streamwise-spanwise planes along the height of HR75 (i.e. H1 to H5) are used to provide additional insights on the wake characteristics and vortex shedding around the cylinders. The spanwise planes were carefully selected to explore the near-wall flow dynamics (H1), vortex shedding and wake interference at the mid-height of the UC (H2), the impingement of the downwash from the UC on the DC and the induced upwash behind the DC (H3) and the flow dynamics near the free ends of the UC (H4) and DC (H5).
3.3.1. Mean velocity and turbulence statistics
Figure 17 shows the contours of the spanwise mean velocity (W) and the wall-normal mean vorticity  $\textrm{(}{\varOmega _y})$ in the spanwise planes (H1 to H5) of HR75. The mean streamlines and isopleths of
  $\gamma = 0.5$ and
  $U/{U_H} = 0.5$ are also superimposed on the plots. The figure illustrates the three-dimensionality of the flow by showing differences in the mean flow pattern across the various spanwise planes. In figure 17(a–e), a salient feature is the occurrence of two pairs of intense regions of W in the gap at H3 and H4, which are absent or subtle at H1 and H2. These intense regions are generated because of the strong downwash from the free end of the UC that impinges on the DC at H3 and H4. In particular, the first pair located near the reverse flow region of the UC demonstrate the entrainment of surrounding fluid to counteract the downwash from the free end of the UC. The second pair, which has an opposite sign arrangement to that of the first pair, demonstrates the deflection of the flow that impinges on the DC. Behind the DC, the W contours show that the entrainment of surrounding fluid is significantly enhanced at H3 and H4 compared to H1 and H2. The enhanced entrainment at H3 and H4 is attributed to the strong upwash induced behind the DC (figure 5e). At H5, the mean flow pattern near the free end of the DC is similar to that observed for the SC (Essel et al. Reference Essel, Tachie and Balachandar2021).
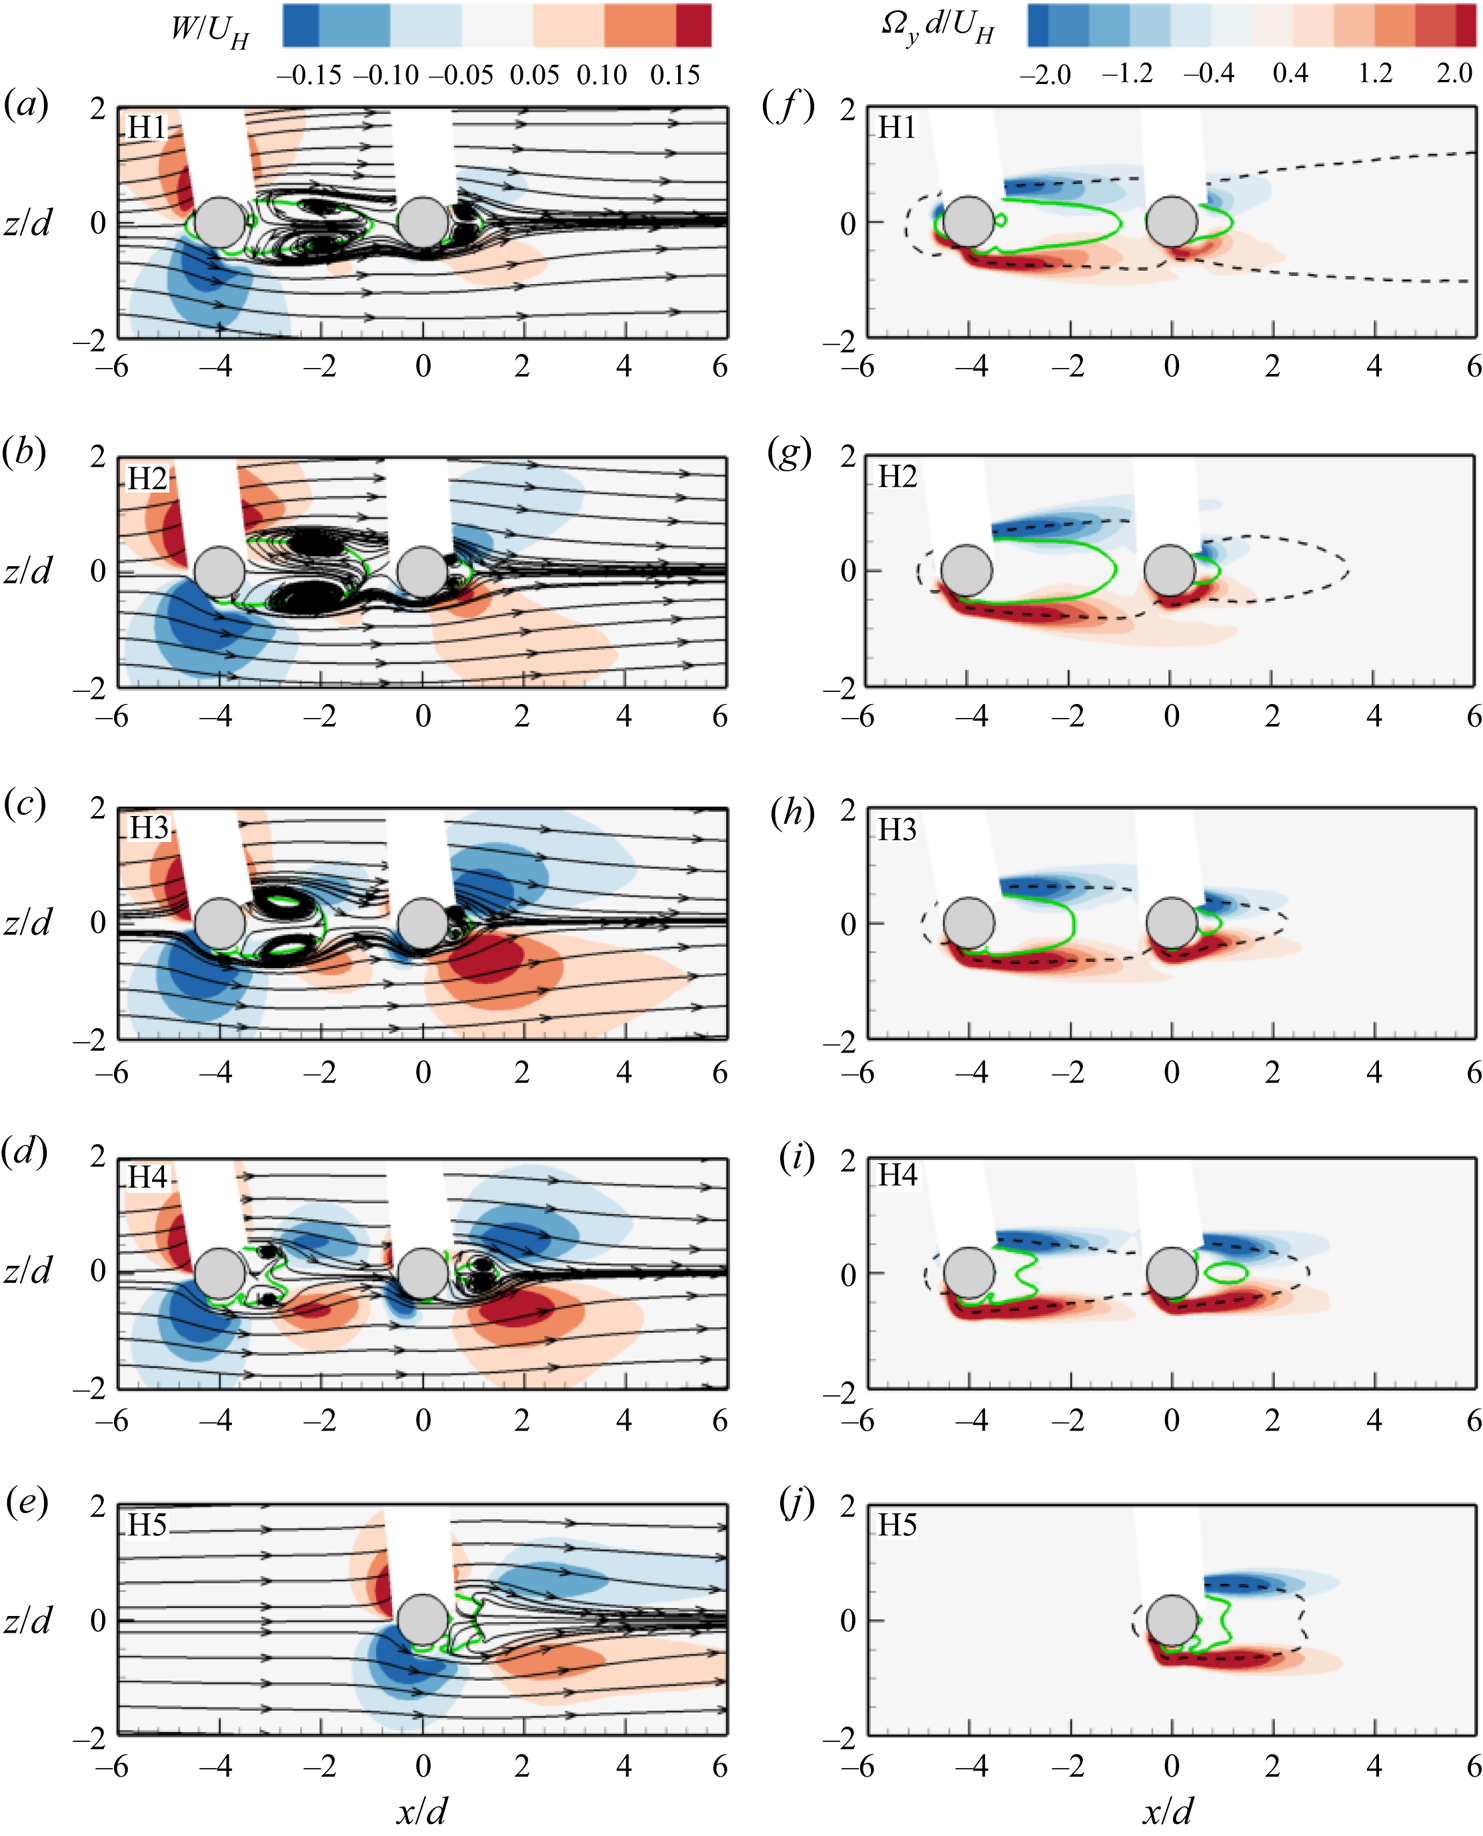
Figure 17. Contours of (a–e) spanwise mean velocity and ( f–j) wall-normal mean vorticity in the x–z planes, H1 to H5 for HR75. Superimposed are the mean streamlines and the isopleth of 50 % forward-flow fraction (green solid line) which bounds the reverse flow region. The black dash line represents  $U/{U_H} = 0.5$.
The contours of the wall-normal mean vorticity reveal the shear layers on the sides of the cylinders. At H1 to H3 (figure 17f–h), the shear layers of the UC expand and attach onto the DC leading to the suppression of separation on the DC and the shrinkage of the shear layers behind the DC. However, at H4 (figure 17i), the shear layers near the free end of the UC have less influence on the DC, resulting in a more elongated shear layers behind the DC. H5 also shows that the UC has less effect on the shear layers near the free end of the DC.
The effects of sheltering on the Reynolds normal stresses (figure 18) are similar to the effects on the Reynolds shear stress (not shown for brevity). The stresses are suppressed near the wall and the free ends but enhanced near the mid-height of the cylinders due to the stronger vortex shedding at the mid-height of the cylinders. The effect of sheltering is observed to enhance the stresses in the impingement region in front of the DC and the upwash region behind the DC (H3).
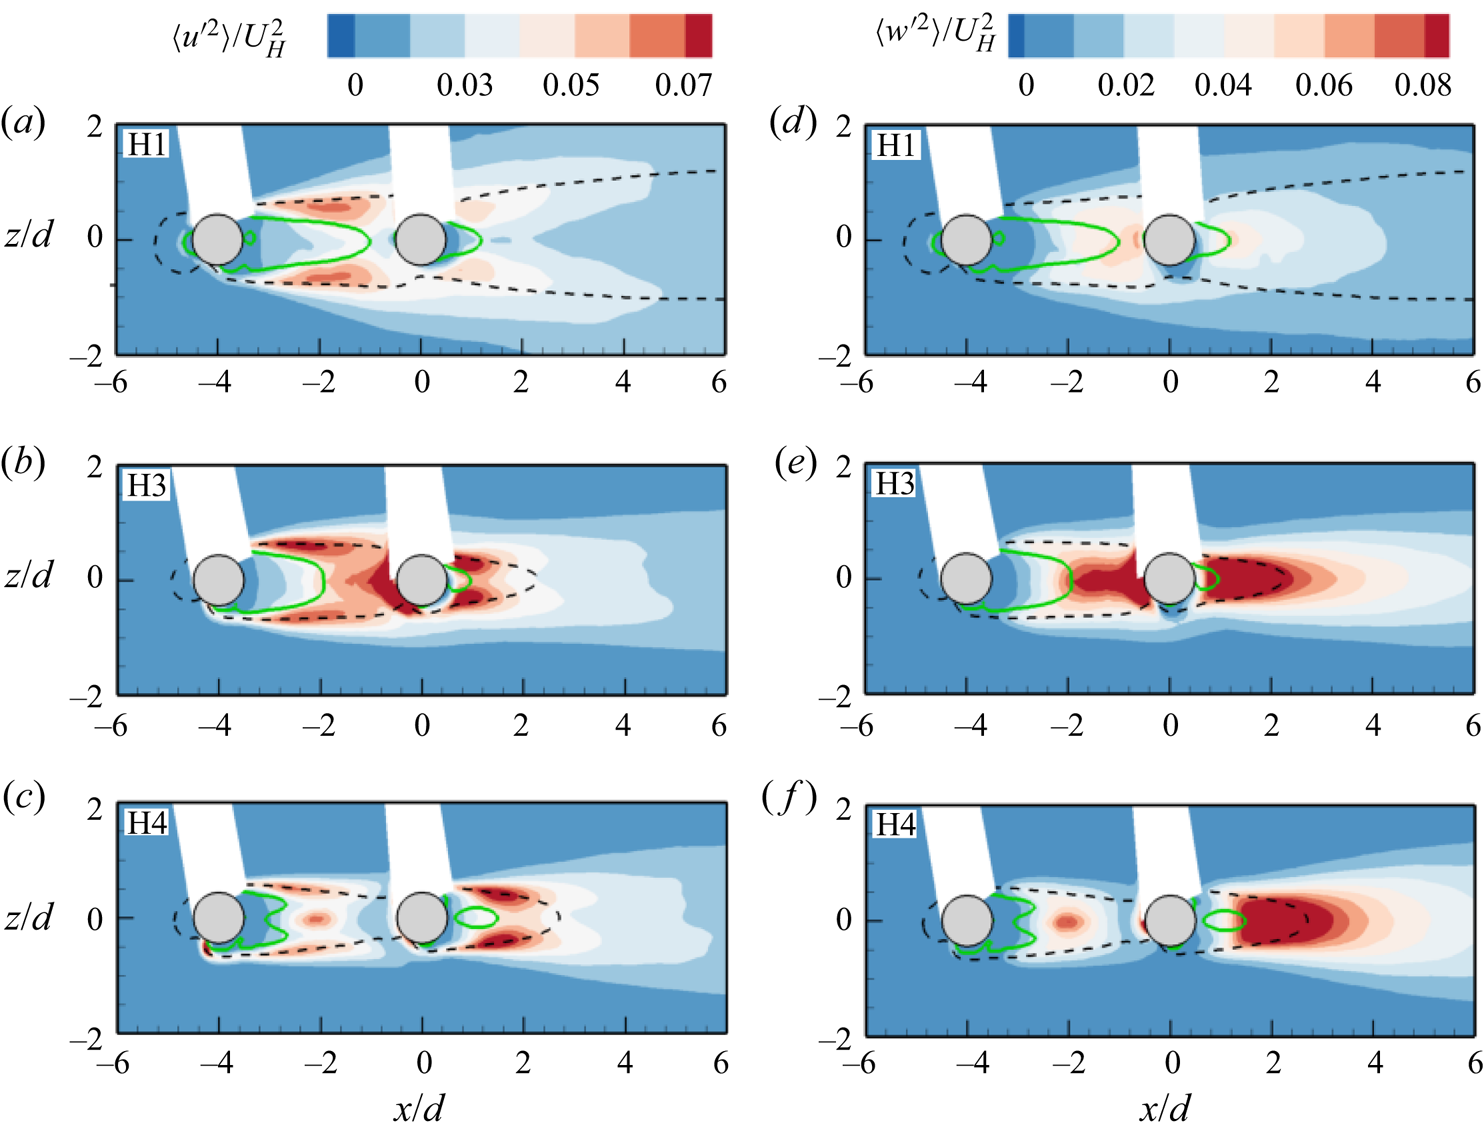
Figure 18. Contours of (a–c) streamwise and (d–f) spanwise Reynolds normal stresses in the x–z planes, H1, H3 and H4 for HR75. Superimposed are the isopleths of 50 % forward-flow fraction (green solid line) which bounds the reverse flow region and  $U/{U_H} = 0.5$ (black dash line).
3.3.2. Vortex shedding
In previous sections and based on the present test conditions, it is shown that the shear layers from the UC attach onto the DC, and this suppresses the size of the reverse flow region and shear layers formed behind the DC. It is also important to note that the attachment of the shear layers in front of the DC promotes roll-up which generates quasi-steady gap flow between the cylinders. Also, part of the attached shear layers separates from the sides of the DC and continues downstream to form vortices. Here, the quasi-periodic motion of the vortices behind each cylinder is examined using spectral analysis and POD.
Figure 19 presents the frequency spectra of the spanwise velocity fluctuations extracted along the vertical symmetry  $(z/d\; = \; 0)$ and at streamwise locations behind the UC
  $(x/d\; = \; - 1.0)$ and DC
  $(x/d\; = \; 3.0)$ in the spanwise planes of HR75. The Strouhal number of the vortex shedding behind the UC is
  $S{t_H} \approx 0.15$ across the various planes but the DC shows Strouhal numbers,
  $S{t_H} \in [0.10,0.21]$, which tend to increase away from the wall (H1 to H4) and decrease at the free end
  $(S{t_H} \approx 0.16)$. Although the variation in Strouhal number along the span of the DC demonstrates a cellular shedding behaviour (Sumner et al. Reference Sumner, Heseltine and Dansereau2004; Porteous, Moreau & Doolan Reference Porteous, Moreau and Doolan2014; Yauwenas et al. Reference Yauwenas, Porteous, Moreau and Doolan2019; Essel et al. Reference Essel, Tachie and Balachandar2021), it is mainly influenced by the shear layers of the UC that interact with the DC. For example, at H3, the attached shear layers trigger a lock-in shedding behaviour with
  $S{t_H} = 0.14$, which is consistent with the lock-in pumping frequency of HR75
  $(S{t_{H,A}} = 0.13)$ discussed earlier (figure 12). Nonetheless, the Strouhal number at H3 is comparable to
  $S{t_H} = 0.17$ obtained at the mid-height of the present isolated cylinder (Essel et al. Reference Essel, Tachie and Balachandar2021). When the Strouhal number is defined based on the freestream velocity, the value at H3 is similar to
  $St = 0.13\; $reported at the mid-height of the DC for two tandem cylinders of equal height, aspect ratio,
 $\; H/d\; = \; 7.0$, and spacing ratio,
  $s/d\; = \; 4$ (Alam et al. Reference Alam, Moriya, Takai and Sakamoto2003; Sumner & Reitenbach Reference Sumner and Reitenbach2019).
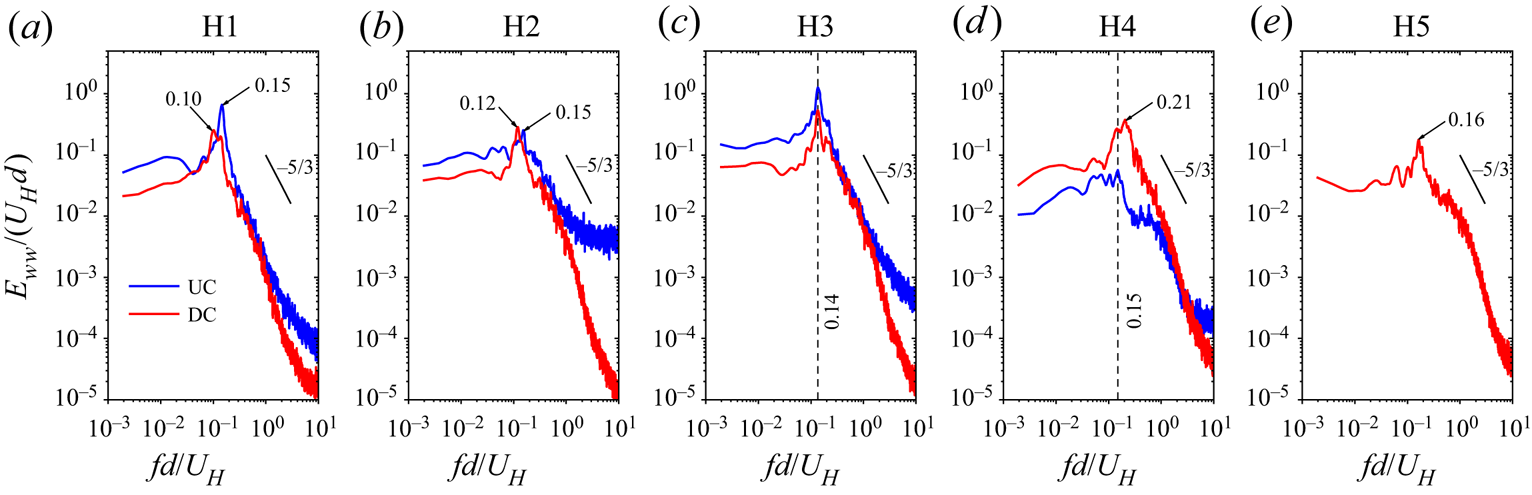
Figure 19. Spectra of spanwise velocity fluctuations at  $x/d\; = \; - 1$ (UC) and 3 (DC) and
  $z/d\; = \; 0$ in H1 to H5 for HR75.
The POD was performed in the masked region,  $x/d \in [ - 6,8]$ and
 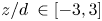 $z/d\; \in [ - 3,3]$, with the position of the cylinders and the shadows formed behind the cylinders blanked out in each plane. The fractional energy contributions of the first 100 modes are shown in figure 20. The plot shows that the different spanwise planes have a stronger influence on the first five energetic modes, beyond which the profiles collapse reasonably well on each other. For example, the first mode contains the highest energy at H5 (9.4 % TKE) and the lowest energy at H2 (5.0 % TKE), suggesting wider range of scales at H2. Except for the free end plane (H5), the energy content between the first and second modes for H1 to H4 are comparable which suggests a strong relationship between the first two modes. Previous studies on two-dimensional cylinders (van Oudheusden et al. Reference van Oudheusden, Scarano, van Hinsberg and Watt2005) and finite wall-mounted cylinders (Crane et al. Reference Crane, Popinhak, Martinuzzi and Morton2022) have made similar observations and associated the first two modes with vortex shedding.
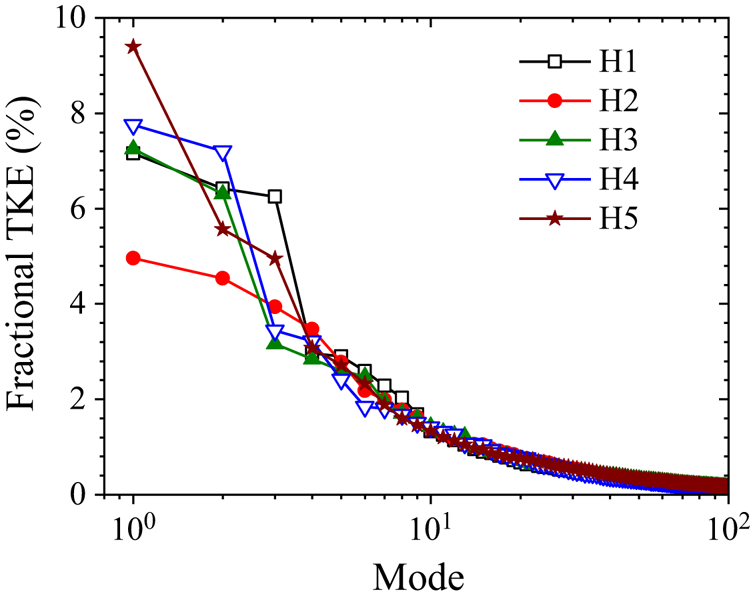
Figure 20. Distributions of the fractional energy contributions of the first 100 modes in the spanwise planes, H1 to H5 for HR75.
Figure 21 shows the spectra of the temporal coefficients of modes 1 and 2. The mode pair shows similar peaks at the various spanwise planes, except at the free end. The peaks are also consistent with the vortex shedding frequencies of the cylinders examined earlier (figure 19). At the free end, it is interesting to notice that mode 2 shows the vortex shedding frequency observed in figure 19, while mode 1 shows a low-frequency shedding behaviour  $(S{t_H} = 0.02)$. This low frequency, which was also observed at the free end of the present isolated cylinder (Essel et al. Reference Essel, Tachie and Balachandar2021), is attributed to the dynamics of the tip vortices. Clearly, mode 1 captures this frequency because the tip vortices are dominant at the free end.
The spatial distributions of modes 1 and 2 are used to visualize the vortex shedding at H1, H3 and H5 (figure 22). At H1 and H3, both POD modes exhibit an anti-symmetric von Kármán vortex shedding, however, mode 1 at H1 shows a stronger spanwise flapping of the trajectory of the vortices shed behind the cylinders. This is attributed to the weaker influence of the downwash flow near the wall. At H3, the strength of the vortices is weak in the gap region because of the downwash from the UC. Figure 22(c) shows that both symmetric (mode 1) and anti-symmetric (mode 2) vortex shedding occur intermittently at the free end of the cylinder which agrees with the two different Strouhal numbers observed at H5 (figure 21). Essel et al. (Reference Essel, Tachie and Balachandar2021) found only a symmetric vortex shedding at the free end of the isolated cylinder, which would suggest that the anti-symmetric vortex shedding at the free end of the DC is induced by the attached shear layers of the UC. To estimate the spatial wavelength of the anti-symmetric vortex shedding, vertical lines were drawn through the peaks of alternating (positive and negative) regions of the spanwise component of the POD modes,  ${\phi _w}$, where the distance between two successive peaks corresponds to half the local wavelength
  $\textrm{(}\varLambda /2)$. Near the wall (H1), the local wavelength of the vortices shed from the UC in mode 1 and 2 is
  $\varLambda \approx 1.6d$ but increased to
  $3.8d$ downstream of the DC. At H3, the vortex shedding wavelength for DC increased to
  $4.1d$ in mode 1 and
  $4.9d$ in mode 2, while at H5,
  $\varLambda = 4.2d$ (mode 2). Based on the shedding frequencies (figure 21), the convective velocity of the vortices
  $({U_c} = \varLambda f)$ at H1 can be estimated as
  $0.24{U_H}$ and
  $0.57{U_H}$ for the vortices behind the UC and DC, respectively. At H3, the convective velocity of the vortices behind the DC is
  $0.57{U_H}$ in mode 1 and
  $0.69{U_H}$ in mode 2. At the free end of the DC, the vortices also convect downstream with a velocity of
  $0.67{U_H}$ (mode 2).
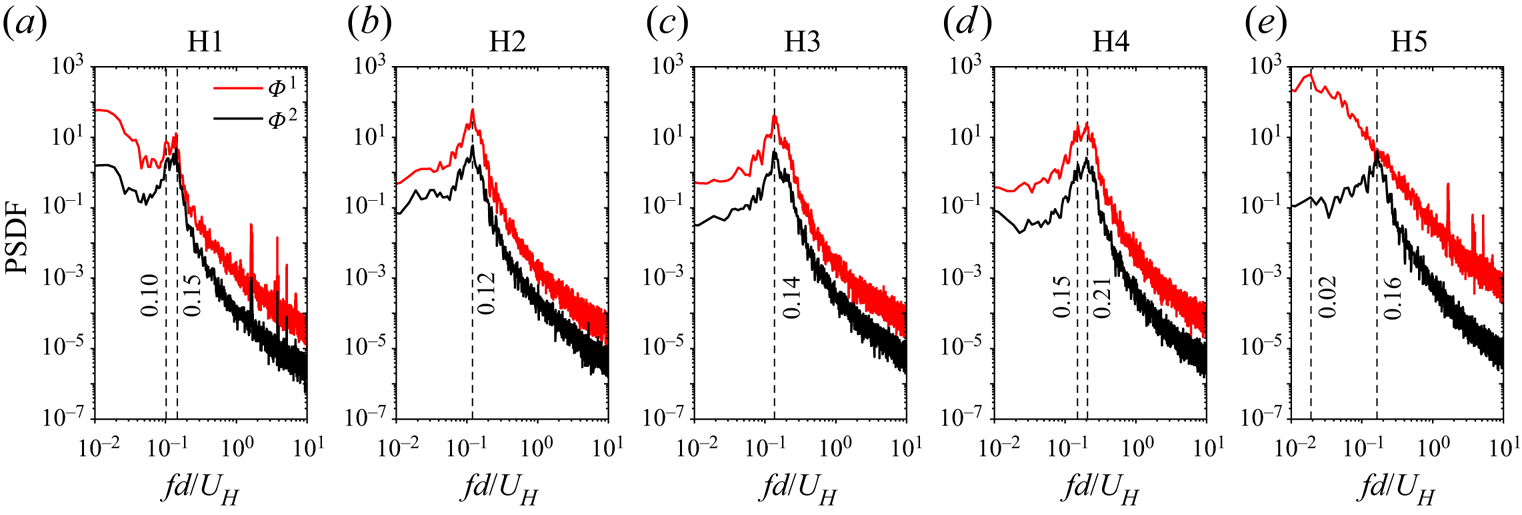
Figure 21. Spectra of the temporal coefficients of modes 1 and 2 in H1 to H5 for HR75.
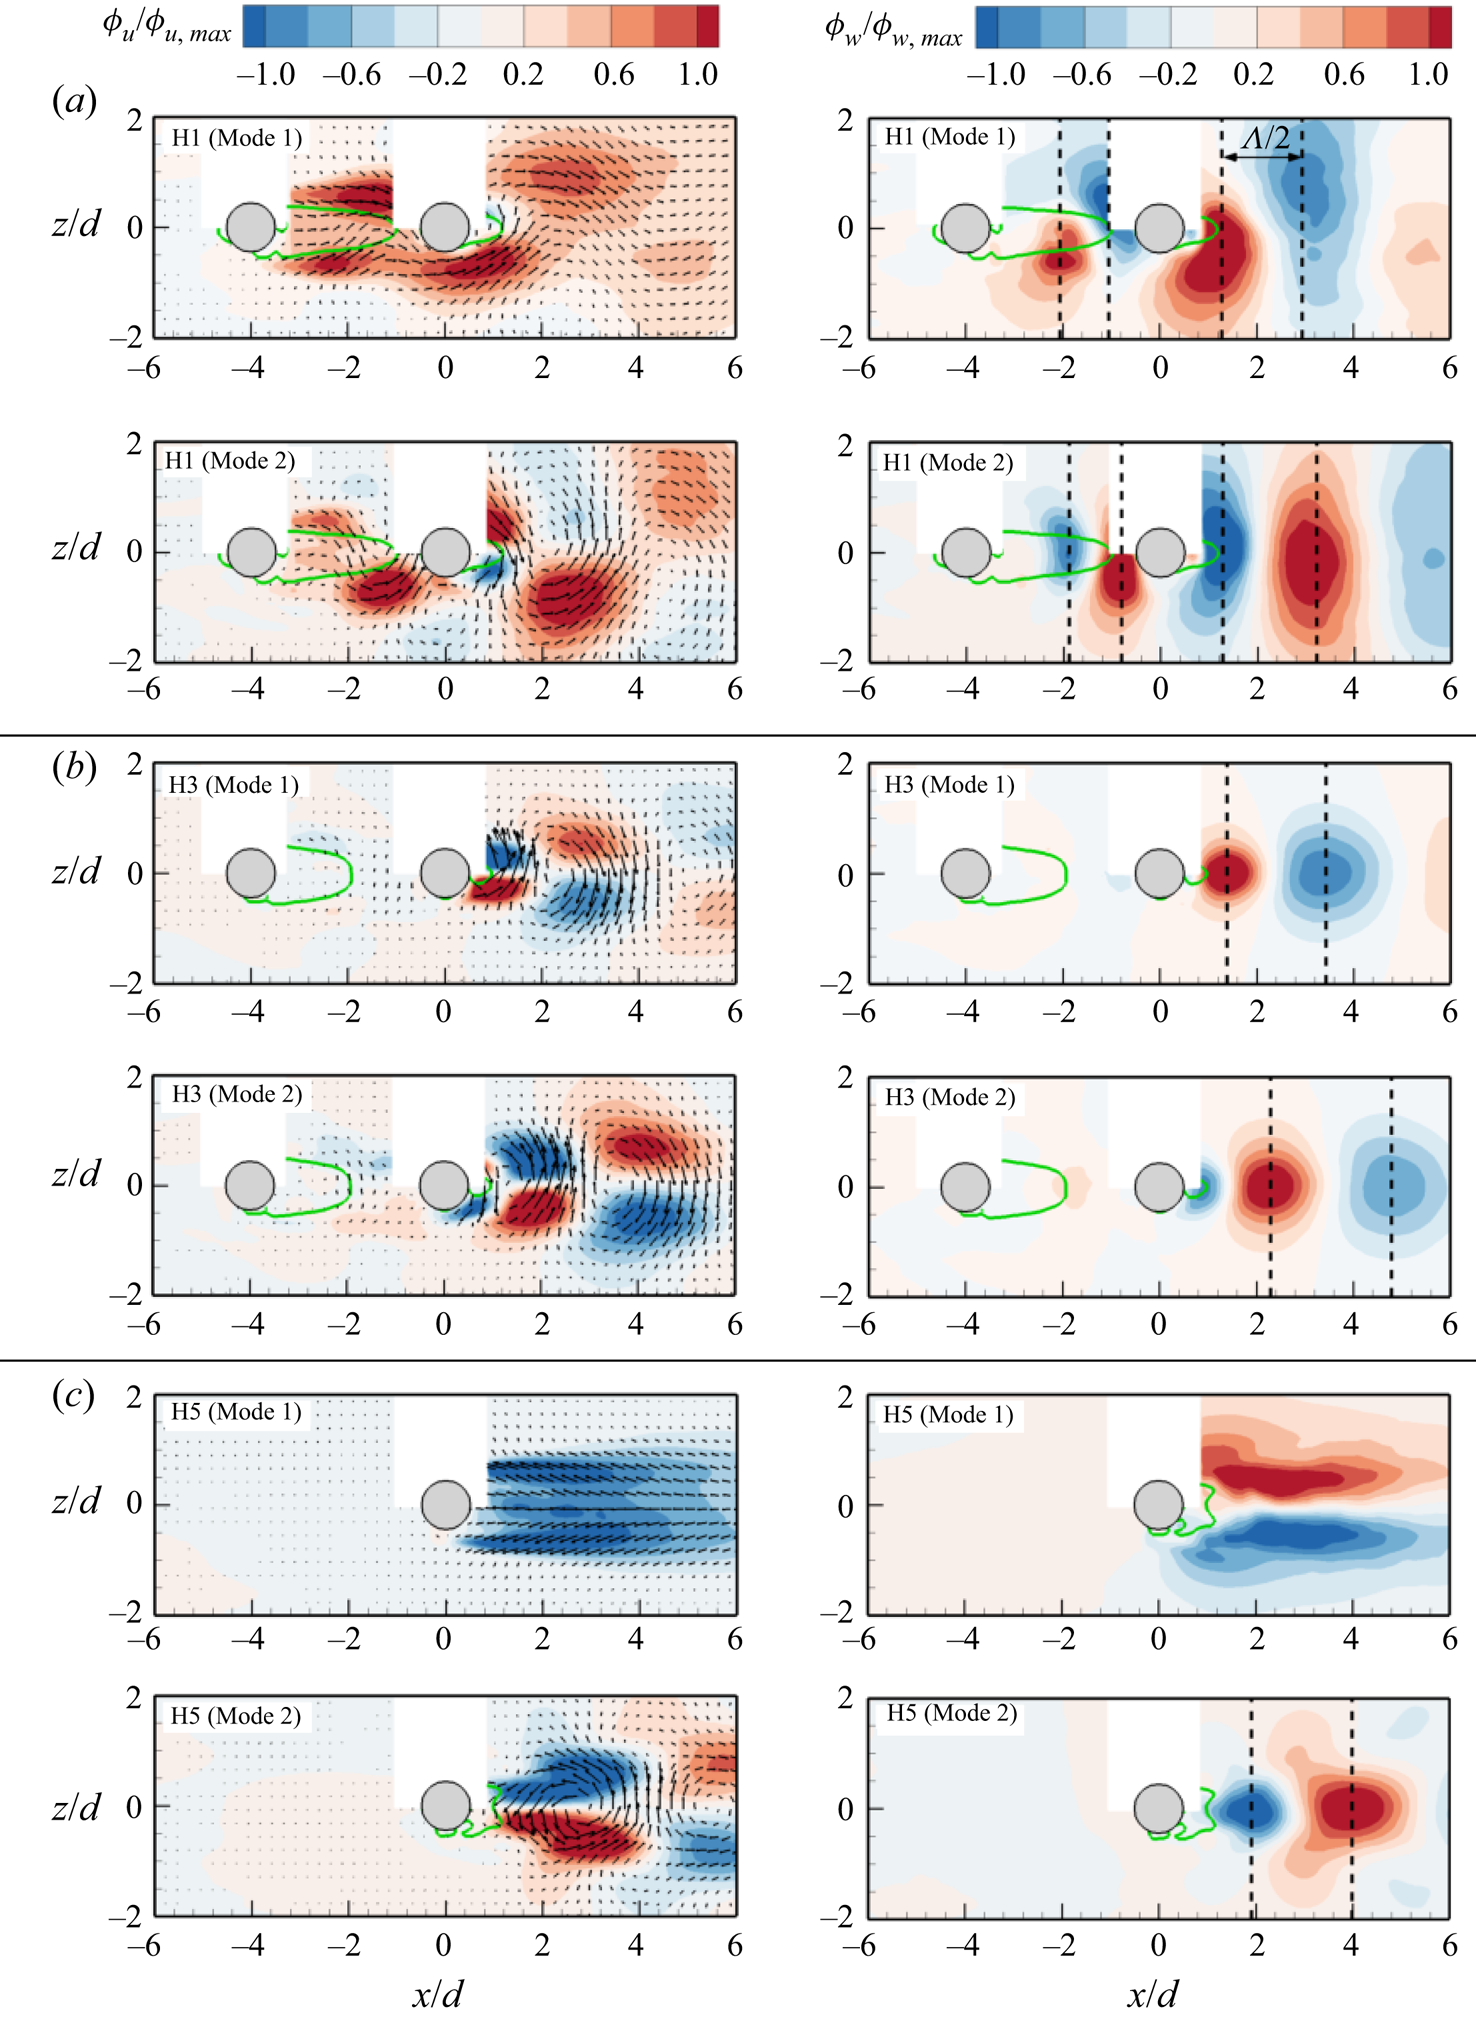
Figure 22. Contours of streamwise  $({\phi _u})$ and spanwise
  $({\phi _w})$ eigenfunctions of modes 1 and 2 in (a) H1, (b) H3 and (c) H5 for HR75. The contours are also normalized by the maximum
  ${\phi _u}$ value in each region.
4. Summary and conclusions
The effects of sheltering on the unsteady wake dynamics of finite wall-mounted cylinders of unequal height and arranged in tandem are investigated using a time-resolved PIV system. The cylinders were fully submerged in a water channel with a TBL of thickness,  $\delta /d = 8.7$. The Reynolds number based on the cylinder diameter was
  $Re\; = \; 5540$ and the spacing ratio between the tandem cylinders was fixed at
  $s/d\; = \; 4.0$. Five height ratios (
 $h/H = 0.10,0.25,0.50,0.75$ and
  $1.0$) were studied by varying the aspect ratio of the upstream cylinder, UC
  $(h/d)$, while keeping that of the downstream cylinder, DC
  $(H/d\; = \; 7.0)$, constant. For brevity, these test cases are denoted as HR10, HR25, HR50, HR75 and HR100, respectively. The corresponding submergence ratio of the UC is
  $\delta /h \in [1.2\unicode{x2013} 12.4]$ for HR10 to HR100. Measurements were also conducted for a reference isolated cylinder with an aspect ratio,
  $L/d\; = \; 7.0$ (denoted as the SC), to better understand the effects of sheltering on the DC.
The wake characteristics of the DC of the smallest height ratio (HR10) were found to be similar to that of the SC, however, increasing the height ratio significantly modified the wake of the DC. In particular, the increase in height ratio enhances the downwash from the free end of the UC and this impinges on the frontal surface of the DC. The impingement induces a strong upwash on the opposite rear side of the DC which counteracts the downwash from the free end of the DC much earlier than observed in the case of the SC. As a result, the reverse flow region behind the DC is substantially reduced in the sheltered portion of the cylinder and this effect extends towards the free end of the DC as the height ratio increases. However, the reverse flow area behind the UC monotonically increases with increasing height ratio. The Reynolds stresses were enhanced in the impingement region upstream of the DC and the upwash region behind the DC.
The spectra of the fluctuations of the reverse flow area in the symmetry plane of the cylinders showed that the reverse flow areas behind the UC and DC undergo quasi-periodic pumping motion with frequencies that tend to lock-in as the height ratio increases from HR25 to HR100. This lock-in behaviour was further investigated using JPDF of the fluctuations of the reverse flow area. The results showed that, at HR10 and HR25, the pumping motion is predominant behind the DC, but switches to a synchronized pumping motion at HR50 and HR75 and more frequent expansion behind the UC at HR100.
POD analysis in the symmetry plane showed that the spatial distributions of the low-order modes (mode 1 to 5) are strongly dependent on the height ratio. As the height ratio increases, the low-order modes revealed the presence of several spanwise vortex cores that promote upwash and downwash of flow confined in the gap between the cylinders. Behind the DC, modes 1 and 2 showed well-organized structures responsible for the induced upwash behind the cylinder, while mode 5 showed structures that are more chaotic as height ratio increases. Based on two-point auto-correlations, the spatial coherence of the structures that interact with the free end of the DC and convect downstream was found to significantly decrease with increasing height ratio.
TR-PIV measurements in five streamwise-spanwise planes along the height of HR75 showed that the impingement of the downwash from the UC on the DC and the attachment of the side shear layers of the UC on the DC cause shrinkage of the shear layers and reverse flow region behind the DC. The attachment of the shear layers on the DC also promotes a lock-in anti-symmetric vortex shedding in the sheltered portion of the DC. The free end of the DC, however, exhibits both symmetric and anti-symmetric vortex shedding.
Future investigations on the effects of different geometric and initial flow conditions on the unsteady wake dynamics of unequal-height tandem cylinders would further improve our physical insight into sheltering effects. This will contribute to the development of effective drag-reduction strategies for engineering applications.
Funding
The authors are grateful to the Natural Sciences and Engineering Research Council of Canada (NSERC) for their financial support through NSERC Postdoctoral Fellowship for E.E.E. and NSERC Discovery Grants for R.B. and M.F.T. We are also grateful to Canada Foundation for Innovation (CFI) for funding for the experimental facility.
Declaration of interests
The authors report no conflict of interest.


 Open access