

1. Introduction
1.1. Background
1.1.1. This paper has been written partly in response to the challenge from the Pensions Regulator (TPR) to introduce an Integrated Risk Management (IRM) framework for the funding of Defined Benefit (DB) pension schemes in the United Kingdom. Partly too, it has been written in response to recent criticism of pension funding approaches adopted by actuaries.
1.1.2. Such criticism of pension funding has sometimes seemed to come from two opposing views: There are those who think that actuaries and trustees are being too prudent in their assumptions and as a result pension scheme liabilities are overstated. Others have warned that actuaries and trustees are being imprudent by not demanding that pension schemes be better funded – pointing to recent high-profile cases such as BHS which failed leaving a pension scheme deficit and members facing cuts to their benefits. This tension has even been evident in the national press with stories published and press releases issued, presenting very different views of the state of pension funding in the United Kingdom.Footnote 1
1.1.3. This tension is not new. Thornton & Wilson (Reference Thornton and Wilson1992) published a paper “A Realistic Approach to Pension Funding” advocating the need for realistic bases and an objective approach to determining “best estimate” assumptions. They suggested that “typical funding bases often contain hidden and undesirable margins”. Nor is the issue of security new. McLeish & Stewart (Reference McLeish and Stewart1987) stated “the prime purpose of funding an occupational pension scheme must be to secure the accrued benefits, whatever they might be, in the event of the employer being unable or unwilling to continue to pay at some time in the future”.
1.1.4. This paper suggests that there are a number of problems with the current scheme specific funding approach adopted by UK pension schemes. In particular:
– There is little evidence that prudence in actuarial funding assumptions is being linked to the strength of the employer covenant, despite this being a key principle of scheme specific funding and promoted at length by TPR.
– There is evidence that many pension schemes are carrying levels of investment risk which appear to be greater than the employer’s balance sheet can easily manage, with some companies (even within the FTSE100) carrying more equity exposure in their pension scheme than equity on their own balance sheet.
– There is often little linkage of funding and investment strategies. For example, the use of separate discount rates for valuing liabilities pre- and post-retirement is rarely linked to an investment strategy aimed at switching into bonds as pension scheme members retire.
1.1.5. Given that these are the areas and links that are specifically addressed in TPR’s IRM framework, this paper suggests that it is time for change. Specifically this paper aims to present an approach to funding pension schemes which meets TPR’s principles and at the same time gives a transparent response to those who have criticised pension funding methodology, either for being too prudent or not prudent enough.
1.1.6. Earlier this year, sadly, the distinguished actuary and Past President of the Institute of Actuaries, Jeremy Goford died. He was a great champion of the need for actuaries to be transparent and focussed on customer needs. In his 2002 Presidential Address he spoke on the “presumption of trust in financial transactions being replaced by a demand for openness, transparency and accountability, coupled with the demonstration of benefit to the customer”. This paper tries to live up to Jeremy’s challenge by promoting an approach to the funding of pension schemes which is open, transparent, accountable and focussed on meeting customer needs.
1.2. What is This Paper Trying To Achieve?
1.2.1. The funding of a pension scheme is simultaneously trying to achieve two objectives which are not always aligned:
– Financing a long-term obligation – funding benefits as they fall due.
– Providing security for members’ benefits.
These are two distinct objectives which potentially require a different approach to setting assumptions, particularly the discount rate. In particular it is the challenge of these two sometimes conflicting objectives which lies at the heart of some of the criticism of pension funding methodology mentioned above. A pension funding plan agreed at an actuarial valuation can simultaneously represent an expectation that funds will be more than sufficient to meet benefits as they fall due (i.e. representing a “surplus”) and, at the same time, be insufficient to ensure that members’ benefits are secure (i.e. representing a “deficit”).
1.2.2. This conflict was recognised by a research project on discount rates carried out in 2010–2012 by the Institute and Faculty of Actuaries (IFoA). This project identified two main types of actuarial calculations and, correspondingly, two approaches to setting discount rates. The IFoA’s discount rate project is revisited in this paper which then considers how the framework proposed in that project can be used to meet the challenges of scheme specific funding and IRM.
1.2.3. In order to meet TPR’s challenge of IRM, this paper will propose a methodology which will directly link funding, investment and the strength of the employer covenant. The proposed methodology will also improve transparency on the security of members’ benefits and, at the same time, help all parties to the pension scheme understand realistic outcomes for the future financing of the long-term obligations of the pension scheme.
1.2.4. This paper is set out as follows:
∙ chapters 2 and 3 look at the recent history of the regulatory framework for funding DB pension schemes in the United Kingdom;
∙ chapters 4, 5 and 6 then explore the economic theory behind pension scheme funding and look at how different regulatory frameworks have evolved around the world;
∙ chapter 7 defines in more detail the question this paper is trying to answer;
∙ chapters 8 and 9 look in more detail at developing the funding objective and the funding framework and how the links are drawn between funding, investment and employer covenant;
∙ chapter 10 explores some of the challenges of modelling investment returns in the proposed framework;
∙ chapter 11 presents a short summary of the proposed new approach to funding; and
∙ chapter 12 presents conclusions and recommendations.
1.2.5. For some readers, chapters 2 and 3 may seem detailed background reading which is already familiar. Such readers may therefore choose to jump straight to chapter 4. Indeed those readers who wish to go straight to the proposed funding approach outlined in this paper can jump straight to chapter 7. However these extra chapters are included here as they set important context for what is to follow. In particular, two key questions are closely addressed:
∙ What is the purpose of minimum funding legislation?
∙ Does a formulaic approach to minimum funding, requiring limited actuarial input, result in better or worse outcomes than a flexible approach based on scheme-specific actuarial advice?
It is also interesting and instructive to note some of the lessons that can be learned by looking at the historical development of UK funding policy (as well as the development of funding policies overseas), in particular the attitude towards pension deficits and the time period over which they should be cleared. When the Minimum Funding Requirement (MFR) was introduced many actuaries thought 5 years was too long a period over which to clear a deficit. Today many actuaries have experience of setting recovery periods which are in excess of 20 years.
2. Development of Pension Scheme Funding Over the Last 15 Years
2.1. Introduction
This paper starts by reviewing the development of pension scheme funding in the United Kingdom over the last 15 years which importantly includes the transition period from the previous funding regime (the MFR) to the current funding regime (scheme specific funding). This paper considers how the current funding regime has evolved since its introduction in 2005 and alongside this how the Pension Regulator’s thinking has developed.
2.2. A Look Back at the MFR
2.2.1. The MFR was established under the Pensions Act 1995 and came into effect on 6 April 1997. It applied to most funded, DB, private sector pension schemes.
2.2.2. The Pensions Act 1995 itself arose in the main in response to public concerns following the Maxwell scandal of the early 1990s, and the subsequent Goode Committee’s report which recommended a “minimum solvency requirement to secure the pension rights of members”. Up until 1997 there were minimal UK legislative requirements about the level of assets an on-going scheme needed to hold. Other than meeting contracting-out requirements, the minimum level of funding required, if any, was solely dictated by the scheme trust deed and rules and therefore, trust law and expectations placed on trustees.
2.2.3. The MFR was originally designed, in the event of a company going insolvent, to keep pensions in payment whilst also providing non-pensioner members with a cash equivalent transfer value that would, following investment, provide an “even chance” of receiving a pension equivalent to that which would have been provided by the relevant scheme. It was not designed, contrary to some public perception, to require pension schemes to hold sufficient assets to ensure that all members’ benefits could be fully secured if the scheme were to be wound up. This was highlighted in the IFoA report to the Secretary of State for Social Security (May 2000. Review of the Minimum Funding Requirement) which noted: “The point at which members’ security becomes of vital importance is when the scheme is wound up, particularly if this event is caused by the insolvency of the employer. It is our contention that there may be a widespread misplaced public perception that a scheme which is 100% funded on the MFR test would provide full security for members’ benefits.”
2.2.4. Legislation (sections 56–61 of the Pensions Act 1995) set out the broad requirements of the MFR. The details implementing the MFR were summarised in Occupational Pension Schemes (MFR and Actuarial Valuation) Regulations (1996), notably:
(i) Section 57 required trustees to obtain a valuation from an actuary on the MFR, generally on a triennial basis;
(ii) Section 58 required trustees to prepare, and an actuary to certify, a schedule of contributions payable over a 5-year period which ensured that schemes remained 100% funded throughout or, for those schemes that were at least 90% funded, reached 100% funding by the end of the 5-year period;
(iii) Section 60 required the majority of schemes below 90% funded to reach the 90% level within 12 months, unless serious under-provision was identified. In the event of serious under-provision, the scheme had 6 years to reach 100% funded status.
2.2.5. The details of the methods and assumptions to be used, however, were set out in GN27: Retirement Benefit Scheme – MFR which was issued and monitored by the IFoA.
2.3. What Would the MFR Look Like Today?
2.3.1. As mentioned in 2.2.3 above, the funding objective of the MFR was for a scheme to hold assets to meet its liabilities, as set out below:
(i) All active and deferred members can receive a cash equivalent transfer value to be invested in a personal pension arrangement which has a reasonable expectation of providing their accrued deferred benefits;
(ii) Pensioner liabilities can be externally secured via annuities purchased with an insurance company;
(iii) And finally any expenses can be met.
2.3.2. It is difficult to consider how the MFR would have evolved through time, in particular noting the point made in paragraph 2.4.1 below where it is clear that the IFoA’s recommendations for updates were not always accepted. In particular, it would have been challenging to agree an approach to deriving Market Value Adjustments given the variety and volatility of market conditions experienced, both in the United Kingdom and worldwide, over the last 15 years.
2.3.3. However, by applying the core principles described in 2.3.1, it is possible to consider what funding positions would look like today if pension schemes applied this particular funding objective.
2.3.4. As the MFR targeted full funding on an annuity buy-out basis for pensioners, it is clear that for more mature schemes the funding target would be higher than it is today (for schemes that are funding on an ongoing basis rather than currently targeting buyout).
2.3.5. For non-pensioners, it is interesting to consider how the guidelines surrounding the principle of provision of a cash equivalent transfer value to allow members to replicate their benefits has changed over the last 15 years. Actuaries who have advised Trustees and sponsoring employers on bulk transfer value exercises will recognise the principle in relation to “critical yield” transfer values. Following rules set by the Financial Conduct Authority a financial advisor will consider the merits of a transfer value for a member of a DB pension scheme by establishing the “critical yield” on the transfer value. The critical yield is the estimated growth rate required on the transfer value to allow the member to match the benefits due from the DB scheme using an alternative personal pension. In practice the investment return assumption achievable before retirement will reflect the individual’s attitude to risk and expected investment choices, and the assumptions post retirement reflect individual annuity costs at retirement.
2.3.6. Therefore, it is likely today that the MFR-funding objective (if it had continued in existence) for non-pensioners would reflect best estimate returns before retirement, and individual annuity buy-out costs after retirement.
2.3.7. The MFR target was not affected by employer covenant strength, or the expected long-term investment strategy of the pension scheme.
2.3.8. Simple analysis of the core principles behind the MFR suggests that the MFR would produce a higher funding target than scheme specific funding in the majority of cases, with the exception of:
(i) immature schemes with a much lower than average age; and
(ii) scheme specific funding examples where full funding on a buyout basis is already being targeted.
2.3.9. An important feature of the MFR was that, where a deficit was identified, it required full funding to be reached over a prescribed and relatively short time horizon. The average recovery plan today is not far short of 10 years (and rising). This compares to the 5-year recovery plans required under the MFR with just 1 year to get to 90% funding.
2.3.10. The strict recovery plan requirements alongside ever maturing pension schemes would likely push most schemes towards a matching investment strategy to reduce the potential for significant cash contributions being required over a short time horizon. Demand for UK government bonds by UK pension schemes could well have been even higher than it is today had the MFR been retained.
2.3.11. While perceived distortions in investment strategy were a key criticism of the MFR, it is likely that retaining the MFR would have resulted in many pension schemes moving towards a matched position more quickly. The changes that have occurred over the last 5 years, with a significant move towards matching assets, may have happened sooner. Therefore pension scheme funding levels might have been better protected from the significant falls in yields seen since the start of 2011.
2.3.12. The structure of the MFR required the use of dual pre- and post-retirement discount rates. It is interesting to consider the influence of this structure on actuaries recommending assumptions as part of the transition to scheme specific funding. An analysis of The Pensions Regulator’s Annex to its 2017 Scheme funding statistics implies that around two-thirds of schemes still use a dual discount rate. A more prudent post retirement discount rate does mean that the funding objective becomes gradually more prudent overall as the pension scheme matures and it may also be reflective of the developing investment strategy. However, it seems more likely that the prevalence of dual pre- and post-retirement discount rates in scheme specific funding valuations is simply a hangover from the MFR.
2.4. The Transition to Scheme Specific Funding
2.4.1. During the MFR’s period of existence the IFoA made four recommendations to the Department of Work and Pensions (DWP) to amend the MFR basis – on two occasions to strengthen and on two occasions to weaken the funding basis. It is notable that only the two recommendations to weaken the MFR basis were implemented, in 1998 and 2002.
(i) June 1998 – changes to the MFR formula reduced MFR liabilities by up to 19%
(ii) March 2002 – changes to the MFR formula reduced MFR liabilities by up to 8%
2.4.2. The MFR had only been effective for 2 years when the Government announced a review and in 2000, alongside the Department of Social Security (DSS) consultation, the IFoA raised their own concerns on the MFR methodology, notably,
(i) the focus by trustees and employers on short-term market conditions rather than long-term pension funding and investment strategies;
(ii) the depression of yields created by the additional demand for long-term gilts;
(iii) the rigid and mechanical rules for setting minimum contribution rates; and
(iv) the gap between the security actually provided by the MFR test and the public’s perception of what the MFR would deliver.
2.4.3. This paper considers later the extent to which the scheme specific funding regime has resolved these concerns.
2.4.4. Over the following years, and as part of the DSS consultation, the criticism of the MFR continued from numerous industry bodies:
(i) “There is a large and worrying gap between the level of security which the MFR test actually delivers and the public’s perception of what it will deliver” (Source: The Faculty of Actuaries and Institute of Actuaries, Review of the Minimum Funding Requirement, May 2000).
(ii) “The MFR was a flawed approach. It distorted investment decisions for some schemes and it increased regulation and costs for sponsoring employers, without delivering the level of security which many people expected” (Source: DWP, Simplicity, security and choice: working and saving for retirement: action on occupational pensions, June 2003).
2.4.5. In their May 2000 report on the Review of the MFR, the IFoA outlined their vision for revised MFR proposals alongside a new additional test which would “indicate the level of cover achieved against a stronger test, designed to give all members a very high chance of receiving their accrued benefits on winding up”. It was proposed that this valuation method would be based solely on bond yields with an explicit risk based addition.
2.4.6. Alongside the commentary from the pensions industry and the Government, Paul Myners also stated in November 2000 that the MFR was a source of distortions in investment decision-making and should be replaced:
“Providing security for members of defined benefit pension schemes is an essential objective for any responsibly run pensions system. While I am sure that the overwhelming majority of pension funds are run both properly and effectively, it is essential to have effective safeguards to ensure that members of defined benefit pension schemes can have confidence in the system. I do not believe that the MFR is such a safeguard. An effective alternative is needed. It is also a source of distortions in investment decision-making” (Source: Letter from Paul Myners to the Chancellor of the Exchequer and the Secretary of State for Social Security, 8 November 2000).
It is important to note that the UK Debt Management Office disagreed with this view, noting in its Gilt Review (July 1999) that: “However, there are several factors that have contributed to the fall in yields. These include low levels of primary issuance, the effects of funds maturing, the need to reduce the volatility of pension fund assets and ‘limited price indexation’.”
2.4.7. In March 2001 the concept of scheme specific funding was introduced, alongside the abolition of the MFR:
(i) “The review recommends that the MFR should be replaced by a scheme-specific long-term approach based on transparency and disclosure, under which pension funds would report publicly on the current financial state of the fund and on future funding plans. This would make clear where funds’ ability to pay future pensions was based on reckless or unsuitable assumptions about investment returns, level of contribution, life expectancy and so on” (Source: HM Treasury, Institutional investment in the UK: a review, March 2001).
(ii) “The Government will legislate to replace the MFR with a long term scheme-specific funding standard, with additional protective measures, including a statutory duty of care for the scheme actuary, stricter rules on voluntary wind-up and extension of compensation for fraud” (Source: HM Treasury, Budget 2001 – investing for the long-term future: building opportunity and prosperity for all, March 2001).
2.4.8. Over the next few years the Government set out a number of proposals including the December 2002 Pensions Green Paper and the June 2003 White Paper on occupational pensions (simplicity, security and choice: working and saving for retirement) but it was not until the Pensions Act 2004 that the MFR was formally abolished and a new scheme specific funding regime was finalised and became law on 18 November 2004. Additionally, on 11 June 2003, the Government changed the debt on the employer regulations so that they became based on full solvency (Section 75) liabilities rather than MFR liabilities. Overnight, this changed the balance of the focus on security in DB pension schemes.
2.4.9. The Pensions Act 2004 introduced a number of key changes to the UK pension environment, not least the introduction of scheme specific funding requirements. This included the establishment of TPR, the Pension Protection Fund (PPF), changes to employer debt requirements, changes to minimum annual pension increases and the introduction of Trustee Knowledge and Understanding requirements. These are discussed further in the following sections.
2.5. Scheme Specific Funding Requirements
2.5.1. Pension schemes must comply with the scheme funding requirements under Part 3 of the Pensions Act 2004. Part 3 provides the statutory framework for how the trustees must assess their scheme liabilities and determine the pace and period over which these liabilities must be funded. Many aspects of the Pensions Act 2004 were informed by the EU’s 2003 IORP Directive.
2.5.2. The Pensions Act 2004 describes the statutory funding objective:
(i) Every scheme is subject to a requirement (“the statutory funding objective”) that it must have sufficient and appropriate assets to cover its technical provisions.
(ii) A scheme’s “technical provisions” means the amount required, on an actuarial calculation, to make provision for the scheme’s liabilities.
2.5.3. Further detail is provided by The Occupational Pension Schemes (Scheme Funding) Regulations 2005. Some key excerpts:
(i) “it is for the trustees or managers of a scheme to determine which method and assumptions are to be used in calculating the scheme’s technical provisions”;
(ii) “the economic and actuarial assumptions must be chosen prudently, taking account, if applicable, of an appropriate margin for adverse deviation”;
(iii) “the rates of interest used to discount future payments of benefits must be chosen prudently, taking into account either or both:
∙ the yield on assets held by the scheme to fund future benefits and the anticipated future investment returns, and
∙ the market redemption yields on government or other high-quality bonds”;
(iv) “the mortality tables used and the demographic assumptions made must be based on prudent principles, having regard to the main characteristics of the members as a group and expected changes in the risks to the scheme”.
2.5.4. There was also a subtle change introduced in the impact on the security of members’ benefits. None of these legislative references refer to the ability of the scheme to pay benefits as they fall due. A review of the legislation confirms that there is no longer any explicit reference in current UK pension legislation to paying benefits as they fall due. This point is explored further in 2.7 below.
2.6. TPR
2.6.1. The Pensions Act 2004 called for the introduction of an independent body to regulate work based pension schemes in the United Kingdom. TPR was created as the regulator of work-based pension schemes in the United Kingdom. TPR’s statutory objectives are:
(i) to protect members’ benefits;
(ii) to reduce the risk of calls on the PPF;
(iii) to promote, and to improve understanding of, the good administration of work-based pension schemes;
(iv) to maximise employer compliance with automatic enrolment duties;
(v) to minimise any adverse impact on the sustainable growth of an employer (in relation to the exercise of the regulator’s functions under Part 3 of the Pensions Act 2004 only).
The first three objectives are set out in the Pensions Act 2004 with the four and fifth objectives introduced later as part of the Pensions Act 2008 and Pensions Act 2014, respectively.
2.6.2. In October 2005 TPR launched a consultation on the approach it would take to regulating scheme funding requirements. In the consultation TPR identified a number of underlying regulatory principles and used these to guide the development of the approach:
1. “protecting members – we will support trustees and employers working to maximise protection of the benefits that the employer promised to pay and that members are expecting.
2. scheme specific – it is not our role, nor is it consistent with government policy, to set a funding standard, because each scheme needs to take account of its particular circumstances.
3. risk-based – regulatory intervention should be focused on the schemes that pose the greatest risk to their members or the PPF. While it is never possible to eliminate all risk, those in a position to do so should seek to mitigate those risks wherever it is reasonable to do so.
4. proportionate – trustees are required to correct any shortfall as quickly as the employer can reasonably afford. We intend to distinguish between those schemes where rapid elimination of the shortfall would have a serious impact on the employer and those where employers could potentially afford to pay off the shortfall more quickly.
5. preventive – we need where possible to act before risks materialise.
6. practicable – we need an approach that can be operated within the constraints of the information and resources available to us.
7. referee not player – the responsibility for ensuring that schemes are fully funded rests with trustees and employers with the help of their advisers – the regulator will not interfere with this responsibility where it is discharged consistently with their own duties.”
(Source: Consultation document – How the Pensions Regulator will regulate the funding of defined benefits, October 2005).
2.6.3. As part of the 2005 consultation, TPR clarified that it would use “triggers” to help it identify which schemes it should engage with. These triggers were of two types
(i) A technical provisions trigger. This compared the scheme’s technical provisions with two different liability values – the s179 value and the accounting (FRS 17 or IAS 19) value and aimed to take into account the maturity of a scheme and the strength of the employer’s covenant when deciding whether triggers were breached.
(ii) A Recovery Plan trigger. Where recovery plans were longer than 10 years, contributions are weighted towards the end of the Recovery Plan (back-end loading) or where assumptions in the recovery plan are inappropriate.
2.6.4. Detailed guidance was published in February 2006 in TPR’s Code of Practice 03 – Funding DBs. This code of practice remained in place until it was revised in 2014.
2.6.5. TPR’s approach has evolved over the last 10 years as it has had to react to changes in market conditions and changes in the behaviour of trustees and employers in relation to pension schemes.
2.6.6. An excellent example of this relates to the triggers that TPR initially proposed to use. A clear consequence of using a recovery plan trigger of 10 years was that it indeed encouraged schemes to set recovery plans that were less than 10 years. But possibly encouraged by the view that up to 10 years was acceptable, many recovery plans were set at the 10 year limit – a considerable increase on the MFR recovery plans that had applied previously. For the first three years where data is available, TPR’s scheme funding analysis highlighted that 25% of schemes established recovery plans longer than 10 years, and there was a significant proportion that adopted a recovery plan length just shorter than 10 years. For valuations carried out between 2005 and 2008, 50% of pension schemes had a recovery plan length of between 5 and 10 years. 25% of schemes had a recovery plan length of between 8 and 10 years (Source: TPR Scheme Funding Statistics June 2016). The triggers were clearly influencing behaviour.
2.6.7. In October 2008 TPR published its first ‘reactive’ statement in response to the 2007/2008 financial crisis. Following that a number of further statements were published including:
1. Statement to employers sponsoring DB schemes (February 2009)
2. Alerts to risks in the economic downturn (April 2009)
3. Scheme funding and the employer covenant (June 2009)
4. Understanding employer support for DB schemes (June 2010)
2.6.8. In 2012 TPR started publishing its annual DB funding statements. These statements aim to highlight key issues for schemes undertaking valuations in the relevant year and provide guidance on TPR’s latest thinking.
2.6.9. It is interesting to compare the language used in the original 2008 statement and the 2012–2017 annual statements to examine how this changes over time. The use of key words can provide a guide.
2.6.10. As can be seen from Figure 1–6, there are common themes throughout the period. “integrated” and “covenant” are both referred to throughout, with “risk” becoming an ever increasing focus over time. A focus on “gilt” and “bond” yields also coincides with a focus on “deficits”. Whilst “triggers” were key in the original 2008 statement, it is interesting to see that they are only referenced again in 2013 when TPR announced that it was no longer going to refer to them.

Figure 1 “Gilt/bond” word count in each annual the Pensions Regulator (TPR) statement (Source: TPR annual defined benefit funding statements 2008 and 2012–2017)
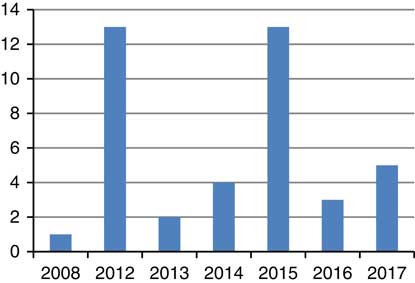
Figure 2 “Deficit” word count in each annual the Pensions Regulator (TPR) statement (Source: TPR annual defined benefit funding statements 2008 and 2012–2017)

Figure 3 “Risk” word count in each annual the Pensions Regulator (TPR) statement (Source: TPR annual defined benefit funding statements 2008 and 2012–2017)

Figure 4 “Covenant” word count in each annual the Pensions Regulator (TPR) statement (Source: TPR annual defined benefit funding statements 2008 and 2012–2017)

Figure 5 “Integrated” word count in each annual the Pensions Regulator (TPR) statement (Source: TPR annual defined benefit funding statements 2008 and 2012–2017)

Figure 6 “Trigger” word count in each annual the Pensions Regulator (TPR) statement (Source: TPR annual defined benefit funding statements 2008 and 2012–2017)
2.6.11. Analysis of TPR statements suggests that apart from specific changes in approach (e.g. the removal of triggers), changes in TPR’s message to schemes represents an “evolution” of views rather than a “revolution”. The core of TPR’s message has remained the same and reflects their original views; however, the way in which TPR has presented these views to stakeholders has changed, and improved, over time.
2.7. Interaction of Scheme Specific Funding with Trustee Duties
2.7.1. Trustees are required to act within the framework of the law. The general law of trusts applies, alongside specific UK law applying to pension schemes, including Acts of Parliament and regulations. The law is supported by codes of practice and guidance issued by TPR.
2.7.2. Pension scheme trustees have the following duties under trust law:
(i) to act in line with the trust deed and rules;
(ii) to act in the best interests of the scheme beneficiaries;
(iii) to act impartially; and
(iv) to act prudently, responsibly and honestly.
(Source: TPR guidance on trustee roles and responsibilities http://www.thepensionsregulator.gov.uk/trustees/role-trustee.aspx)
2.7.3. The fundamental duty of trustees is to pay benefits in accordance with the provisions of the trust and any overriding legislation. When considering pension scheme funding this fundamental duty is often interpreted as requiring Trustees to fund the scheme in such a way as to ensure that benefits can be paid as they fall due.
2.7.4. The Pensions Act 2004 makes no reference to the ability of the scheme to pay benefits as they fall due and indeed there is little or no explicit reference to paying benefits as they fall due in current UK pension legislation.
2.7.5. The last time legislation required reference to funding for benefits as they fall due was under the MFR, which required actuaries to certify that “In my opinion, the resources of the scheme are likely in the normal course of events to meet in full the liabilities of the scheme as they fall due” (Source: Section 56–61, Pensions Act 1995).
2.7.6. Despite this, TPR’s definition of Technical Provisions is “Technical Provisions – They measure the extent of the liabilities to pay pension benefits in relation to past service as they fall due” (Source: TPR Glossary http://www.thepensionsregulator.gov.uk/glossary.aspx). Paying benefits as they fall due is referred to frequently throughout TPR guidance.
2.7.7. There is a subtle difference between “the amount required, on an actuarial calculation, to make provision for the scheme’s liabilities” under the Pensions Act 2004 and “the liabilities to pay pension benefits in relation to past service as they fall due” under TPR guidance. The first definition is a subset of the second definition. It is possible for a pension scheme to have enough assets today to match an actuarial calculation of its liabilities, but for the asset base to be completely depleted at a particular point in the future before all benefits have been paid as they fall due.
2.7.8. In the original European Directive (June 2003) Technical Provisions are not defined explicitly. However, some guidelines are set out in the Directive on how the calculation is to be done: “The minimum amount of technical provisions must be calculated by a sufficiently prudent actuarial valuation and must be sufficient both for pensions and benefits already in payment to continue to be paid and reflect commitments arising from members’ accrued rights” (Source: Article 15.4(a), European Directive, June 2003). There is therefore a stronger reference to paying benefits as they fall due in the original European Directive wording than there is in UK legislation, which TPR has embraced.
2.7.9. TPR’s definition is arguably more appropriate as it encourages schemes to consider cash flow and liquidity issues when considering scheme funding, which could in theory be ignored if a strict interpretation of the Pensions Act 2004 legislation was adopted.
2.8. PPF
2.8.1. The PPF was one of the measures set up by the Pensions Act 2004 in response to a series of high-profile cases in which pension schemes had wound up with insufficient assets to meet their pension commitments. The PPF commenced operations on 6 April 2005 and applies to schemes that started winding up after that date. The PPF was established to pay compensation to members of DB and hybrid occupational pension schemes where an employer has become insolvent, and where there are insufficient assets in the pension scheme to cover PPF levels of compensation. It is funded from the assets of schemes transferred to the PPF, investment returns and by annual levies paid by eligible schemes. Eligible schemes include most DB and hybrid occupational pension schemes, but some pension schemes are exempt, for example, unfunded public service schemes and public sector schemes providing pensions to local government employees.
2.8.2. The PPF provides compensation for scheme members at two levels
(i) 100% to people that have reached their scheme normal pension age or are in receipt of an ill-health or survivors’ pension at the time the scheme enters the PPF assessment period.
(ii) In other cases, 90% of their benefits subject to a compensation cap.
2.8.3. PPF compensation also provides for a standard level of revaluation, pension increases and survivors’ benefits.
2.8.4. Not paying 100% of original scheme benefits to non-pensioner members was a deliberate decision, taking into account the cost of the PPF (through levy payments) and moral hazard issues.
2.8.5. There continue to be moral hazard issues to take into account and it is interesting to consider whether schemes would take less risk in their funding strategy if the PPF did not exist. The November 2009 High Court case Independent Trustee Services Ltd v Hope determined that Trustees are not permitted to take into account the existence of the PPF when making certain decisions. However, despite this ruling, it is clearly impossible for Trustees to discount the existence of the PPF completely in their deliberations.
2.8.6. The existence of the PPF can create conflicting situations for Trustees and employers. For example, consider the case of a very poorly funded pension scheme (i.e. funded at levels significantly less than those required to cover PPF levels of compensation), with a sponsoring employer where the covenant strength is deteriorating. It may be in the interests of the PPF for the Trustees to wind up the pension scheme immediately, securing any remaining assets to help fund the deficit, before the scheme enters the PPF. However, it may be in the interests of the members for the Trustees to try to keep the scheme going for as long as possible, so that more members pass normal pension age and so receive higher levels of compensation. In addition, any pension increases received in excess of PPF levels in the interim will also increase members’ initial pensions from the PPF. How should Trustees act in this situation given their core duties?
2.8.7. The first schemes entered the PPF in November 2006 and as of 31 March 2017 the PPF was responsible for around 890 schemes, over 230,000 members and over £25 billion of assets. In addition, around 200 schemes entered into an assessment period with the PPF but did not transfer to the PPF. This is usually because the scheme has been rescued (i.e. additional funds recovered on insolvency or provided by another party were sufficient to allow the scheme to secure benefits above PPF levels), or the scheme is sufficiently funded on a PPF basis to pay benefits above PPF compensation levels (Source: Pension Protection Fund Annual Report & Accounts 2016/2017).
2.8.8. The PPF already ranks in the top 10 list of UK pension schemes by asset value, but is currently less than half the size of the very largest schemes (Source: Pension Funds Online, 31 October 2016 and the Pension Protection Fund Annual Report and Accounts 2016/17). It will therefore be a number of years before the PPF becomes the largest pension scheme in the United Kingdom, unless of course one or more of the largest schemes themselves enter the PPF.
2.8.9. Since its inception, around 90 schemes a year on average have entered the PPF (Source: http://www.pensionprotectionfund.org.uk/TransferredSchemes/Pages/AllTransferredSchemes.aspx). If the entry of schemes to the PPF continues at the current rate with a similar average size of schemes, the PPF might be expected to manage around 2,000 schemes and £60 bn of assets by 2030. This would make it the largest pension scheme in the United Kingdom. If the number of DB schemes in the United Kingdom continues to fall at the same rate as currently then there will be around 3,000 eligible schemes left by 2030. These 3,000 schemes would be responsible for supporting the ever growing PPF through levy payments. There is therefore a concern that this burden could lead to further strains on the remaining sponsoring employers. It is also important to note that this analysis is based on averages. If one or more of the very large pension schemes (i.e. £20 bn+ assets) were to fall into the PPF, this could create a significant strain on the fund.
2.8.10. The PPF aims to be fully funded on a best estimate basis by 2030. At this point, the PPF is expected to have “no exposure to interest rate, inflation and market risks and with a risk margin against the risk of longevity improvements and future claims in excess of best estimate” (Source: PPF Long-Term Funding Strategy paper, August 2010). The risk margin was calculated to be 10% and was chosen such that in 2030 it would be sufficient in 90% of modelled scenarios to cover both the uncertainty in longevity and claims risk in excess of levy.
2.8.11. Article 8 of the EU Insolvency Directive requires that Member States ensure that “necessary measures” are taken to protect the interests of employees and former employees “in respect of rights conferring on them immediate or prospective entitlement to old-age benefits, including survivors’ benefits, under supplementary company or inter-company pension schemes outside the national statutory social security schemes”. The UK Government believed that provisions in section 124 of the Pension Schemes Act 1993 providing for unpaid pension scheme contributions to be met from the National Insurance Fund in the event of an insolvency adequately implemented this requirement in UK legislation (Source: House of Commons Library, Pension Protection Fund 1993–2003). However, two trade unions acting on behalf of the ASW pension scheme members were taking the Government to Court, alleging failure to apply the EU Insolvency Directive properly and this case had been raised in the House of Commons on several occasions. In one debate, Kevin Brennan, MP for Cardiff West, commenting on the impact this had had on ASW workers in his constituency said:
“The state has not exercised a proper duty of care on behalf of those people. The state did not insist on a proper health warning on occupational pensions—on the contrary, it encouraged workers to enter those schemes. The result has been a real injustice for a few who understandably feel bitterness, bewilderment and betrayal, and uncertainty for the many who, on hearing of the plight of the few, lose confidence in the whole occupational pensions system, when even the most rock solid ‘guaranteed’ form of pension fund turns out not to be worth the paper on which it is written, for thousands of people.
That is an injustice, not just a misfortune. Those people feel that they have been duped, and they have been.”
2.8.12. Many commentators at the time argued that the United Kingdom may have been in breach of the insolvency directive for years and following the ASW legal challenge, the Financial Assistance Scheme was introduced. The PPF was not created directly in response to the insolvency directive but it did of course significantly extend the protection available.
2.8.13. Grenville Holden Hampshire v the Board of the Pension Protection Fund (2016) EWCA Civ 786 (28 July 2016) covers a challenge to the level of compensation available from the PPF following the insolvency of an employer. The case contends that the PPF guarantee could not be considered to fall within the definition of the word “protect” used in Article 8. In the opinion of the Court of Appeal, several issues of EU law need clarification. The Court of Appeal has therefore decided to refer certain questions to the Court of Justice of the European Union (CJEU). It is likely that it will then take some time for the CJEU to undertake its consideration of the case.
3. Where are DB Pensions in the UK Today?
3.1. Introduction
This paper now considers the current environment for UK DB Pensions, including consideration of the trends observed since the introduction of scheme specific funding in 2005. In particular it considers how TPR’s views on IRM and employer covenant have been incorporated into the pensions landscape.
3.2. Pension Scheme Experience
3.2.1. Over the last decade the number of DB pension schemes in existence has fallen dramatically (see Figure 7). Ninety schemes a year are entering the PPF each year on average. There were 7751 schemes in total in 2006 and 5794 schemes in 2016 (an attrition rate of around 200 each year). The PPF has therefore become responsible for just under half of the 200 schemes a year that cease to exit. The remaining schemes will have been secured with an insurer (although not necessarily at full benefits for members) or will have been subject to mergers.

Figure 7 Scheme specific distribution of annualised investment return above gilts over the next 15 years
3.2.2. Over the same period, buyout deficits (i.e. estimated solvency deficits on wind-up) have increased significantly, as shown in Figure 8. This is the case despite £130 bn of contributions being made to these schemes (Source: How do we get out of this pensions ‘black hole’?, JLT Employee Benefits, 2016) and a quarter of the schemes no longer being in existence. The average deficit per scheme has more than doubled over the period.

Figure 8 Scheme specific distribution of annualised investment return above gilts over the next 5 years.
3.2.3. Over the same period (2006–2016) the average pension scheme’s investment strategy has changed dramatically with the proportion of assets allocated to equities falling from 61% to 30% and the proportion of assets allocated to fixed interest (bond) investments increasing from 28% to 51% (Figure 9).

Figure 9 Asset allocation for UK DB pension schemes (Source: The Purple Book: DB Pensions Universe Risk Profile 2016, The Pension Protection Fund)
3.3. IRM
3.3.1. As discussed in chapter 2, TPR is constantly reviewing and developing their views on pension scheme funding. In December 2015, TPR published its guidance on IRM. This guidance highlighted the importance of bringing together the three key risks, Funding, Employer Covenant and Investment Risk, that may impact the success or failure of a pension scheme. The IRM framework, “helps trustees identify and manage the factors that affect the prospects of meeting the scheme objective” (Source: Integrated risk management, The Pensions Regulator, December 2015).
3.3.2. It is important to note that TPR’s approach in this guidance is not entirely new. The guidance is simply a formalisation of much of the advice and guidance previously issued and builds on comments contained within TPR’s annual statements. As discussed in chapter 2, TPR’s annual funding statements have been building up to this for 10 years, with key words such as “risk” and “integrated” being continually referenced. Throughout this period, TPR have also included statements which would not look out of place in the IRM framework. In the 2012 annual funding statement, TPR encourages trustees to consider “funding, investment and covenant strands together”. In 2013, TPR stated that trustees should take “an integrated approach to addressing covenant, investment and funding risk”. And finally the year before the guidance was published TPR noted that they wished trustees to take a “proportionate application of an integrated approach to risk management”.
3.4. Employer Covenant
3.4.1. Employer covenant is the extent of the employer’s legal obligation and financial ability to support the scheme both now and in the future. When reviewing the employer covenant TPR expects trustees to consider the strength of the employer covenant both now and in the future, and what impact any potential changes in strength may mean for the long-term future of the pension scheme.
3.4.2. Within their latest guidance, TPR comment that employer covenant assessments should consider three key aspects – legal, scheme related and financial impact. Each of these impacts are discussed separately below. It is important to note, that whilst TPR recognises that pension schemes should adopt a proportionate approach, the trustees must ensure that they have documented their assessment.
3.4.3. Legal
In carrying out a legal review of employer covenant, the trustees must consider any legal documentation tying the employer to the scheme and what type of support the employer is legally obliged to give. The trustees are encouraged to review provisions within the scheme’s trust deed and rules; for example, how a scheme is positioned with the employer in the event of a Section 75 debt, how would the scheme be treated in the event of an insolvent employer and would they be entitled to enter the Pensions Protection Fund. TPR is keen that a scheme does not place reliance on informal support offered. Indeed, it is noticeable that there are an increasing number of pension schemes who hold contingent assets – possibly amongst those schemes with a perceived weaker employer covenant.
3.4.4. Scheme related
The trustees must consider how the characteristics of the pension scheme itself impact the employer covenant. In particular; how does the maturity of the scheme and the size of the scheme compare to the size of the employer supporting it. A large scheme which is supported by a small employer may be perceived to have a weaker covenant due to the potential for volatile future cash funding demands which may be placed on the employer.
3.4.5. Financial impact
The scheme should consider how the employer’s plans in the medium to long term will affect the scheme. The trustees should also consider the wider implications of the market the employer is operating in, and potential risks that they might face, which may impact on their ability to fund the scheme.
3.4.6. TPR assesses employer covenant within 4 covenant grades (CGs). These are detailed in TPR’s “Defined benefit funding regulatory and enforcement policy” issued June 2014.
∙ CG1 – Strong
“Very strong trading, cash generation and asset position relative to the size of the scheme and the scheme’s deficits. The employer has a strong market presence (or is a market leader) with good growth prospects for the employer and the market. The scheme has good access to trading and value if the employer is part of a wider group. Overall low risk of the employer not being able to support the scheme to the extent required in the short/medium-term.”
∙ CG2 – Tending to Strong
“Good trading, cash generation and asset position relative to the size of the scheme and deficits. Operates in a market with a reasonably positive outlook and the employer has a stable market share. Outlook is generally positive but medium-term risk of employer not being able to support the scheme and manage its risks.”
∙ CG3 – Tending to Weak
“Concerns over employer strength relative to the size of the scheme and deficit and/or signs of significant decline, weak profitability or balance sheet concerns and/or high vulnerability to economic cycle. No immediate concerns over insolvency but potential risk of decline.”
∙ CG4 – Weak
“Employer is weak, to the degree that there are concerns over potential insolvency, or where the scheme is so large that, without fundamental change to the strength of the employer, it is unlikely ever to be in a position to adequately support the scheme.”
(Source: DB funding regulatory and enforcement policy, The Pensions Regulator, June 2014)
3.4.7. While these categories are useful as a reference it is important to highlight that no two employer covenants are the same and categorisation is a difficult process. It is quite possible to have an employer with strong cash flows but a weak balance sheet and vice versa. Despite this, it is clear that, at least at the extremes of the grading system, a scheme with a strong sponsoring employer is in a very different position to a scheme with a weak sponsoring employer.
3.5. Does Practice Reflect the Theory?
3.5.1. Given the scheme specific funding regime and TPR’s emphasis on employer covenant and IRM, it might be expected that it should be possible to observe the influence of these factors in the approach taken for pension scheme funding across the United Kingdom. This paper therefore considers the latest available statistics published within “The Pensions Regulator – Scheme Funding Statistics (2017)”, considering the most recent valuation tranches 7 to 10. These valuations have taken place since 30 September 2011, and should take into account the continued formalisation of TPR’s guidance on employer covenant.
3.5.2. In particular, this paper considers some key indicators, which might be expected to show a link with the strength of the employer covenant:
∙ Key assumptions used in the liability calculations, in particular the discount rate
∙ Ratio of technical provisions to buyout liabilities
∙ Investment strategy
∙ Length of recovery plan
3.5.3. These have been examined in turn, in order to establish whether there is or appears to be a link between the employer covenant and funding and investment strategies.
3.5.4. It might be expected that the weaker an employer covenant is (or is perceived to be), the higher the level of prudence might be found within the assumptions used to determine the pension scheme’s technical provisions. TPR outlined in their June 2009 annual statement, if an employer is considered to have a weak covenant then trustees should target funding on a self sufficiency basis.
3.5.5. Discount rate assumptions
The discount rate is the key assumption used in determining a pension scheme’s technical provisions. Pension schemes with a stronger employer covenant might be expected to adopt a higher discount rate than those with a weaker covenant. Additionally, under the scheme specific funding requirements, it might be expected that strong employer covenants could be associated with pension schemes taking on more investment risk, which in turn would be reflected in into their choice of discount rate assumptions. Evidence from tranche 7, that is (valuations dates 22 September 2011 to 21 September 2012), would suggest that stronger covenants are associated with pension schemes using a higher discount rate than those with weaker covenants. However, the difference between these averages is only 0.2% per annum. For valuations occurring three years later (i.e. those in tranche 10) this gap narrows to less than 0.1% per annum. This would suggest that the strength of employer covenant is not influencing the choice of discount rate, as much as might be expected (Tables 1–4).
Table 1 Nominal Single Equivalent Discount Rate by Covenant

CG, covenant grades.
Source: Scheme Funding Statistics 2012–2017, The Pensions Regulator.
Table 2 Weighted Average Ratio of Technical Provisions to Buyout Liabilities (Schemes in Surplus and Deficit)

CG, covenant grades.
Source: Scheme Funding Statistics 2012–2017, The Pensions Regulator.
Table 3 Distribution of Return Seeking Assets Held by Covenant Grade (CG)

Source: Scheme Funding Statistics 2012–2017, The Pensions Regulator.
Table 4 Average Recovery Plan Length (Years) by Covenant

CG, covenant grades.
Source: Scheme Funding Statistics 2012–2017, The Pensions Regulator.
3.5.6. Ratio of technical provisions to buyout liabilities
This ratio gives an indication of the prudence incorporated into the technical provisions and takes into account the scheme specific characteristics. It can be seen that there is little difference between the covenant groups, again indicating that there is little allowance for employer covenant strength in the assumptions used.
3.5.7. Investment strategy
The distribution of return seeking assets held by CG is shown below. It might be expected that notwithstanding other factors, the stronger the employer covenant, the higher might be the level of return seeking assets held. It may be the case that strong employers have been in a better position to de-risk than weaker employers. But again, it can be seen that there is no material difference in the investment strategy between the different covenant bands.
3.5.8. Length of recovery plan
It might be expected that weaker employer covenants might be associated with longer recovery plans. An employer with a weaker covenant is unlikely to have unallocated funds to be paid on demand into the pension scheme. They are likely to require any spare funds for reinvestment in order to develop their business further, thus, hopefully, strengthening the employer covenant in the long run. TPR has recognised and supports this, and in their April 2009 statement highlighted that the best support for a pension scheme is a viable employer. By deferring the payment of contributions to the scheme, whilst still continuing to keep trustees informed of their longer-term plans, the pension scheme can benefit from a stronger employer covenant in the future. Evidence from tranche 7 (i.e. valuation dates 22 September 2011 to 21 September 2012), would suggest that weaker covenants are, on average, associated with longer recovery plans (10.9 years compared to those with stronger covenants at 6.4 years). However, for later valuations in subsequent tranches, this difference reduces.
3.5.9. This analysis is necessarily based on grouped data and there are many pension schemes across the United Kingdom that are making specific allowance for covenant and investment strategy (and the interaction between the two) when setting their funding strategy. However, the evidence from across the UK DB universe shows that the link between employer covenant, funding and investment, is not as strong as might be expected. In particular, it would appear that, overall, the differences between a very weak and very strong employer covenant are not so distinct and maybe scheme specific funding in many cases is not very scheme specific.
4. Basic Financial Economic Principles
4.1. Development of Financial Economics
4.1.1. Since the middle of the 20th century financial economics has developed and influenced all areas of finance. Although the work was not developed with pensions specifically in mind the approaches and insights are directly applicable to pensions. Many papers have shown how to apply these ideas to pensions, and some of the ideas have become common within the actuarial profession. However, it is debateable the degree to which many commonly accepted tenets of finance are followed in the running of DB pension schemes.
4.1.2. This chapter provides a brief overview of some of the key aspects of financial economics. It is not intended as a comprehensive overview of the subject. Many of these areas have been covered in more depth in previous papers (e.g. Bader & Gold, 2003; Bader, Reference Bader2004; Black, Reference Black1980; Chapman et al., Reference Chapman, Gordon and Speed2001; Coronado & Sharpe, Reference Coronado and Sharpe2003; Cowling et al., Reference Cowling, Gordon and Speed2004; Exley & Armitage, Reference Exley and Armitage1997; Exley et al., 1997; Speed et al., Reference Speed2003; Tepper, Reference Tepper1981). Each idea is then applied to the provision of DB pensions. A good supplement is the “Pensions actuary’s guide to FE” (American Actuarial Society).
4.1.3. To some, the models that lead to these insights are supported by elegant mathematics, others have argued that these are over-elaborate constructions resting on unrealistic assumptions about human and market behaviour. Whatever your view, many of the basic principles can be demonstrated by simple thought experiments (such as those described in paragraphs 4.4.2 and 4.4.3 or at the end of paragraph 4.6.3). These insights continue to be relevant to the actuarial profession.
4.1.4. Care is needed in recognising that these are just models. They provide a framework and rationale for an approach. In the event that circumstances differ from the underlying assumptions there may be justification in amending the conclusions, but this paper advocates that actuaries (and other professionals) use these insights as a starting point and are prepared to justify reasons for adopting different approaches.
4.1.5. The key ideas covered below are:
○ The law of one price; arbitrage pricing
○ Modigliani Miller (MM) and the irrelevance of capital structure
○ MM allowing for tax
○ Risk and time horizons
○ Capital Asset Pricing Model (CAPM) and diversification
○ Agency theory
4.2. Financial Transactions and Value
4.2.1. Before considering these ideas it is helpful to consider the impact of a financial transaction. A priori, a financial transaction does not create value. A sale (or purchase) of a financial instrument transfers entitlements (and responsibilities) from one party to another for a given price, there is no value created.
4.2.2. This paper does not dispute that the buying party may be able to more effectively bear the risks associated with the instrument and this may lead to a better allocation of capital that in time is economically beneficial; however, the actual transaction is not value creative, it reallocates cash flows between parties.
4.2.3. There may also be transaction costs involved so third parties may share in the wealth reallocation.
4.2.4. Depending on the price and subsequent events, one party may be perceived to have been a winner from the transaction and the other a loser, but this is a result of subsequent events and the realisation of risk.
4.2.5. Why is this relevant to pensions? Many transactions involving pensions are financial: the benefits granted, the contributions paid, the allocation of the assets, the payment of transfer values or commutation lump sums, the payment of fees to assets managers and advisors. All these represent financial transactions that do not create value but reallocate value between different stakeholders involved in pensions.
4.2.6. When carrying out actuarial valuations and agreeing contributions, it may be useful to consider that the decisions made allocate value between the stakeholders (for more on this approach see Chapman, Gordon and Speed – Pensions funding and risk).
4.3. The Law of One Price; Arbitrage Pricing
4.3.1. Consider a share that trades on more than one exchange. There is an expectation that the shares on the different exchanges trade at the same price at the same time after allowing for any currency effects. This is effectively the law of one price.
4.3.2. It is also referred to as arbitrage pricing; if there was a difference between the prices then it would be possible to simultaneously buy the cheaper share and sell the more expensive share and make a risk-less profit. This would be an arbitrage opportunity.
4.3.3. The act of buying (additional demand for the cheaper share) on one exchange creates upward pressure on the price, while the sale (additional supply of the more expensive share) creates downward price pressure this leads to the arbitrage opportunity being eliminated net of transaction costs. This simple but powerful process of arbitrage pricing underpins many significant results in financial economics.
4.3.4. And why is this relevant to pensions? The approach can be generalised to consider streams of cash flows that are equivalent. If two sets of cash flows are the same, in that they provide the same amounts at the same time with the same risks then, by the law of one price, they will have the same value. This leads directly to the conclusion that a portfolio of assets that replicates projected pension payments has the same value as the said pension promises.
4.3.5. It is important to note that DB promises in the United Kingdom were issued without caveats of default risk. This suggests that a gilt replicating portfolio provides the base value of a DB pension. This also provides the corollary that the value of the pension promise, assuming that it is to be delivered in full, is unaffected by the backing assets.
4.4. MM and the Irrelevance of Capital Structure
4.4.1. In a seminal paper in 1958 (Modigliani & Miller, Reference Modigliani and Miller1958) MM showed that the capital structure is irrelevant to the value of an enterprise. This is referred to as the MM irrelevance proposition.
4.4.2. Consider a company that is 100% owned by a shareholder and has no debt. The company issues a bond which is financed by the shareholder and buys back some of the equity. The shareholder now holds 100% of the equity and the debt. In other words the shareholder still owns all the cash flows generated by the firm, this is the same position as they were in previously and so the debt equity split has not affected the value of the company.
4.4.3. The MM irrelevance proposition tells us that the financing of a liability does not affect its value. This can be applied directly to pensions. Consider two identical pension schemes where one holds all assets in gilts and the other holds all assets in equities. The assets are just collateral for the pension benefits. Unless the different investment strategies lead to different benefits being paid, this leads to the conclusion that the asset allocation within a DB pension scheme does not impact the value of the liabilities.
4.4.4. MM is highly relevant in today’s pension regulatory framework with the focus on IRM, in particular linking the employer’s covenant to the risk of the pension scheme. Since 2003 the debt on the employer is the full cost of securing the buy-out liabilities. This unequivocally makes pension promises a debt on the employer, and reinforces the notion that pensions should be considered as part of the capital structure of the sponsor.
4.4.5. This leads to the observation that issuing pension-debt and holding matching bonds is neutral on the capital structure of a company, but issuing pension-debt and funding (or part funding) with equities or non-matching assets adds to the leverage and risk of the company. This in turn suggests that IRM should explicitly consider the leverage impact of the pension scheme on the sponsor. This idea is far from new, for example, see the augmented balance sheet introduced by Treynor (1972).
4.4.6. In the event a pension scheme is not matched, the ultimate shareholder of the company is then exposed to additional leverage. This is not value enhancing as the shareholders could gain leverage themselves. Presumably the shareholder invests in the company to get exposure to the business and the cash-flows it generates rather than generic equity market exposure. There is also the issue of agency costs (see 4.8 below) that will detract value from the shareholder.
4.4.7. As with any model there are underlying assumptions, and a key one regarding tax will be considered in the next section, but for a non-tax paying entity (e.g. a charity) the MM model provides a strong rationale to fully fund a pension with matching assets.
4.5. MM Allowing for Tax
4.5.1. The MM model can be extended to allow for tax. As before issuing pension-debt creates additional leverage and hence risk unless the risk is fully hedged, for example, with bonds to cover the pension payments.
4.5.2. However, there is now the situation where the company is subject to tax. Interest payments are now tax deductible for the company therefore there is a tax advantage to issuing debt by the firm. The basic MM irrelevance proposition is amended as debt is a tax efficient way to finance the company (note wealth is not created but the value is distributed differently between the stakeholders including the tax authorities). However, there are limits to the amount of debt that a company can assume and therefore any leverage in the pension fund, holding risk assets to cover pension-debt, reduces the debt the company can issue directly.
4.5.3. Making the model more realistic in this way, by adding in tax, strengthens the argument for holding matching bonds in the pension scheme. The value loss from adopting tax inefficient arrangements can be easily calculated (see e.g. Ralfe et al., Reference Ralfe, Speed and Palin2004). Note that the gain is a certain annual gain and not dependent on a particular market outcome.
4.5.4. The argument can be extended to consider the tax rates applied to individuals but this serves to reinforce the argument as personal tax arrangements usually favour equities so it is more efficient for individuals to hold equities and for the company to optimise its capital position using debt.
4.6. Risk and Time Horizons
4.6.1. Markets set prices at which securities trade. However, implicitly pension work assumes that market prices are incorrect. This is often in the context of considering long time horizons and believing that equities are “better value” over the long term. These beliefs are often supported by Asset–Liability Modelling (ALM), for example, “funnel of doubt” graphs that show over time the higher expected return and small probabilities of under-performance.
4.6.2. There appears to be some confusion between the equity risk premium, which is well recognised and documented, and the implication this has for risk over time. To quote from Ralfe “Why hold equities in the pension fund”:
“The truism that equities are expected to outperform bonds in the long run supports the proposition that the longer the time horizon, the more likely that equities will outperform bonds. This is then often mis-interpreted as ‘the risk of holding equities versus bonds decreases the longer the time horizon’. Pension funds can apparently be rewarded versus other investors for their ability to take a long term view. This argument is fatally flawed; there is not a free lunch for those with a long time horizon.”
4.6.3. The risk of an equity portfolio relative to a bond portfolio does not decrease over time even if it’s expected return increases – indeed it is because of this. Again, a simple thought experiment, backed up by market data, can show this. The question can be asked “what is the cost of insuring against a portfolio of equities underperforming a government bond portfolio”? If the risk really does decrease then the cost of the insurance should decrease over time. However the reverse is true. Options markets show that the cost increases the longer the time horizon. Below are closing prices on 30 August 2017 for listed options on the S&P500 index (ref price 2458) with a 2,450 strike, showing increasing value for both puts and calls as maturity increases.

Whilst the above table shows only two years of data, the same pattern continues, however, long the table is extended (albeit there is limited market liquidity for long dated options). This is logical from considering the returns from a portfolio of equities combined with put options giving downside protection, versus a holding of cash combined with call options giving the upside of equity performance. After allowing for yield differences it is clear that these two portfolios must give the same return and therefore have the same value. So, if call options are going to increase with duration then so must put options. Clearly market pricing does not show that equity risk decreases over time. Claiming that this is the case is an example of market inconsistency (see Bodie, 1995).
4.6.4. It would be possible to argue that the equity protected portfolio still has the upside outperformance potential and so the cost of insuring the downside may lead to a better outcome. Selling the equity upside could be considered – if both the equity upside and downside are sold then this results in a risk free return, the same as the original bond portfolio. This is just a statement that markets price risk. All parties involved with pensions should appreciate that expected out-performance from assets, is market compensation for risk. An approach which is counter to this effectively claims that £100 of risky assets (equities) is worth more than £100 of bonds.
4.6.5. This is far from a theoretical argument. Total return swaps are commonly traded where the total return on equities can be exchanged for the cash accumulation on the same initial notional amount. The economist Paul Samuelson went further stating it was a “blunder if not a crime” for a fiduciary trustee to believe that equities’ risk decreases over time.
4.7. CAPM and Diversification
4.7.1. The CAPM is a standard model widely taught. Indeed many ALM models use ideas from CAPM. As always it is important to recognise this as a model and not a statement of how markets actually work, although CAPM often provides useful input in constructing a portfolio.
4.7.2. The key insight from CAPM is that risk can be divided into systemic and non-systemic (or stock specific) risk. Non-systemic risk can be diversified away and it is only systemic risk that is rewarded. This provides the rationale for diversification of portfolios; systemic risk is the determinant of expected returns (Sharpe, Reference Sharpe1964; Markowitz, Reference Markowitz1952).
4.7.3. Many generalisations of CAPM, including Arbitrage Pricing Theory have been developed; these are arguably refinements and in subsequent models the key aspects of diversifiable risk, and rewarded risk remain.
4.7.4. What is the application of CAPM and other market pricing models in pensions? Currently these models are often applied in asset allocation decisions within the pension scheme which is a highly scheme centric approach. A broader application would be to consider the end shareholder of the sponsor. If the sponsor is, for example, a cheese producer then it is reasonable to assume that the investors hold the shares to get access to the competitive advantage the company has in cheese production. A pension scheme that is not fully matched represents a geared position (short pension-debt and long equities) which is not value enhancing to the shareholder as they already have access to these investments. From a CAPM point of view the pension scheme is effectively trying to guess what the end shareholder’s risk/return preferences are which it does not have sufficient information to do. From the shareholder’s viewpoint this is value destructive as agency costs are incurred (see below).
4.8. Agency Theory
4.8.1. Agency theory describes how principals (e.g. shareholders) employ agents (e.g. corporate managers) to act on their behalf (see agency costs model of Jensen & Meckling, Reference Jensen and Meckling1976). While in theory the agents act solely on behalf of the principals, the agents may have their own goals and incentives that may be in conflict to the principals. There are also costs associated with employing and monitoring the agents.
4.8.2. Within pensions there are numerous areas where there is potential for principal-agent conflicts: the members/beneficiaries are principals in this terminology, trustees are appointed to act on their behalf, who in turn appoint advisors and asset managers, at each link in the chain there is potential for conflicting priorities and incentives.
4.8.3. From a corporate point of view the shareholders are principals, they have company management acting as their agents and again there is potential conflict. In particular, the metrics which corporate management are measured on may not be aligned to the most efficient running of the pension scheme. For example, if corporate management are rewarded according to performance against accounting metrics, then they can be encouraged to take sub-optimal risk within a pension scheme which results in a beneficial accounting outcome. Shareholders then suffer the double pain of over-rewarding corporate management as well as suffering sub-optimal risk.
4.8.4. If the agent-principal issue is put together with the realisation that any transactions involving a pension scheme involve a reallocation of resources it is then possible to identify significant potential conflicts.
4.8.5. Past pension practice has resulted in a curious situation where DB promises are being granted (where schemes are not closed) which are being undervalued and understated to the beneficiaries (imagine telling an employee their wage was £400 and then paying them £500). It is interesting to consider the different motivations and structural impediments as to why this is the case.
4.9. Are Pensions Different?
4.9.1. While all the above should not come as a surprise there is still often heard the refrain that pensions are different. While accepting that pensions have their own peculiarities, this does not invalidate what has been covered in this chapter. Rather, it is for actuaries and others who work in pensions to work out whether there are special circumstances, and how these amend the conclusions above.
4.9.2. In many cases, rather than being different, pensions have provided good examples of how finance theory can work in practice. Examples include the valuation of guarantees, the hedging of LPI benefits and simple illustrations of whether cash equivalents offer value by asking how much would it cost to replicate the benefit forgone (i.e. how much should someone have to pay for an annuity that replicates the pension benefit foregone). One possible framework for thinking about DB pensions is illustrated Figure 10.
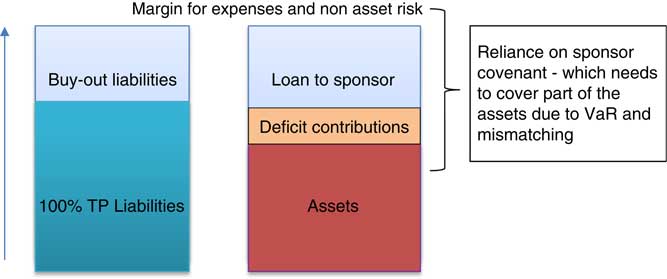
Figure 10 Possible framework for considering DB pensions.
4.9.3. This aims to demonstrate that a pension deficit is an unsecured loan to the sponsor (see Meulbroek, Reference Meulbroek2000). Parties engaged with pensions schemes should challenge themselves when taking decisions (or maintaining the status quo) to answer which stakeholder the arrangement benefits and whether suitable compensation for risk borne is being offered.
4.10. In Conclusion
4.10.1. There are strong theoretical reasons in the United Kingdom (where there are few if any discretionary benefits and, where, since 2003, pension promises are a statutory debt on the employer) why pension schemes should seek to fully fund the pension scheme with matching assets (i.e. bonds or possibly other asset classes which generate a predictable or known stream of cash flows).
4.10.2. Agency effects also suggest that an optimal framework for DB pension schemes is one in which trustees seek to match assets to liabilities and there is transparency on the nature and cost of the DB pension promise.
4.10.3. A pension deficit (calculated on a buy-out basis) is equivalent to an unsecured loan to the sponsoring employer, that is, self-investment. Indeed under the 2003 debt on the employer regulations, the trustees may have the power to collect this [Section 75] debt by triggering a wind-up of the pension scheme. To the extent that regulations permit and even encourage such unsecured loans, it is optimal for there to be transparency between all interested parties on the quantum and nature of such self-investment. Of course, this is not the same self-investment which has a 5% regulatory limit – although, economically, it is effectively the same. For the rest of this paper this self-investment implied by a pension deficit (calculated on a buy-out basis) is referred to as “implied self-investment”.
5. The Challenge of Security Versus Affordability Versus Adequacy
5.1. It is sometimes suggested that there is an implied social contract between members of a pension scheme and the employer, which governs the security of the benefits in a pension plan along the lines that:
∙ the employer did not set out to provide a guaranteed benefit, rather the pension promise was more of the nature of best endeavours; and
∙ the members have always understood that the benefit was not guaranteed and that there is some risk underlying the pension promise.
This may mean that a pension plan guarantee is generally accepted to be less secure than an insurance contract guarantee. However, communicating this additional risk to pension scheme members is very difficult and there are not many examples of where this has been done successfully.
5.2. It can be the case that there is a tension between the amount of the pension benefit provided and the risk attaching to the delivery of the benefit (Figure 11). Affordability constraints may mean that if there are demands for reducing pension plan risk, this can result in employers not being able to afford an adequate level of benefits. However, pension scheme risk is difficult for members to diversify and can be correlated with employment risk. Considerable care and transparent communication with members may therefore be required to explain the risks existing within the pension scheme.
Figure 11 Key influencing factors on Pension Plan design.
5.3. If the security of members’ benefits is the prime consideration in the design and regulatory environment for DB pension schemes, this is likely to lead to a much greater focus on lower risk bond-based investments. In turn this may also result in a high cash funding requirement. As some countries have sought to increase guarantees and protection for members’ benefits, so many employers have responded by reducing the coverage of their DB plans or replacing them with lower cost (lower value) DC plans.
5.4. The lesson from financial economics as described in chapter 4 is that when affordability is considered, this has to be more than just the affordability of cash funding. Clearly cash funding requirements are very important to many employers, but there is an economic cost of guaranteeing a pension benefit to a member, even if this is not reflected in the contribution requirement of that pension scheme. The cost of the pension guarantee should be reflected in any assessment of affordability. Where there are tax advantages in pre-funding pension promises made to individuals, as is the case in many countries, then affordability should really be assessed by reference to the cost of fully funding those pension promises (i.e. without any implied self-investment in the sponsoring employer). Problems arise in regulatory systems and frameworks where there is little or no transparency on this question of affordability. This can be most evident in public sector pension plans where there is little incentive for politicians and other parties involved to be transparent about the affordability of the pension promises they are making.
5.5. Had the lessons from chapter 4 been embraced when DB schemes were first set up, then it is likely that there would not be the same funding issues that exist in the UK today. However, UK pension schemes have been run for decades now, taking credit for potential outperformance of non-matching assets in their budgeting calculations. In part this was due to the fact that in the early days of DB pension schemes, a large part of the benefits were not guaranteed, but were linked to investment performance. Today, by contrast, there are few, if any discretionary benefits left and the overwhelming majority of DB benefits are guaranteed. The step move towards an approach driven purely by financial economic theory, while theoretically attractive, is financially unobtainable for many pension schemes and their sponsors. It is also difficult for pension schemes and their advisors to step away from the widely used approach to funding which anticipates the outperformance of non-matching assets, in particular when UK regulations list this as one of the viable options for selecting discount rates.
5.6. The next chapter looks at how other countries have tried to create optimal regulatory frameworks for the funding of their DB pension schemes.
6. Lessons From Overseas
6.1. This paper now looks at how some other countries with major DB pension systems approach the funding of pension schemes and the frameworks they have evolved to meet the challenges of security, sustainability, affordability and adequacy.
6.2. Canada
6.2.1. The provision of DB benefits in the private sector in Canada has been in decline for over 20 years, but there is still a wide network of DB pension schemes across Canada.
6.2.2. Regulations vary by province but typically require minimum funding tests against two funding objectives – going concern and solvency.
6.2.3. Under the going concern basis, the present value of accrued benefits are measured with an ongoing approach with an interest rate that approximates the expected asset return on a long-term basis. Actuaries will often build in some margins for adverse deviation within the assumptions.
6.2.4. Under the solvency basis, the accrued benefits are measured as if the plan would terminate and be wound-up on that day. The Canadian Institute of Actuaries publishes guidance on the assumptions to use for this basis. The assumptions are selected following a survey of the annuity market for benefits that would be transferred to an insurer following the termination and the current governmental bond market for benefits that would be paid in a lump sum.
6.2.5. If a deficiency on either basis exists, a recovery plan must be established under regulations which again vary by province. In general, any deficiencies are funded over a 15-year period on a going concern basis and 5 years under the solvency basis, although there are several different reliefs and exemptions. Pension plan funding is usually shared jointly by employers and employees. Employees are often asked to contribute to the funding of pension deficits and can be responsible for funding half of any deficit.
6.2.6. Canada is one of the few jurisdictions with solvency funding requirements and these have led to high and volatile contributions and have been a major contributing factor leading to employers closing down DB schemes. There have been discussions, which are ongoing, about replacing the solvency funding framework, possibly with an enhanced going-concern funding framework.
6.2.7. There have been many relief measures introduced over the last 10 years as a result of market conditions and low interest rates, typically modifying the length of recovery plans and introducing some smoothing for solvency valuations. These have led to calls for changes in funding regulations. Possible changes being considered include more smoothing, lengthening recovery plans and funding a percentage of the solvency liability.
6.2.8. There is some solvency protection available – in Ontario the Pension Benefits Guarantee Fund (PBGF) provides protection in the event of employer insolvency. But there have been challenges to the financing of the PBGF, with some dramatic rises in premiums and calls for changes to be made to the PBGF (even for it to be abolished).
6.2.9. In September 2017, the Nova Scotia Government initiated a review of pension funding in light of the continuing challenging environment, with the publication of a document “Pension Funding Framework Review and other issues affecting pension plans”. This review introduces three options for consideration: Maintain Full Solvency Funding; Eliminate Solvency Funding and Enhance Going Concern Funding; Reduce Solvency Funding.
6.3. Ireland
6.3.1. The pension framework in Ireland has many similarities with the United Kingdom. Pension schemes are established under trust and are managed by trustees who are independent of the employer. The legislation governing pension schemes is the Pensions Act 1990, and the regulator is the Pensions Authority. The trustees appoint an actuary to certify compliance annually with the statutory funding standard, which is reported to the Pensions Authority. If the actuary is unable to certify that a pension plan meets the statutory funding standard, a recovery plan must be submitted to the Pensions Authority.
6.3.2. There have been significant numbers of closures or restructuring of DB pension schemes in recent years, prompted by big increases in employer contribution requirements and the economic crisis. In particular, most plans have closed to new entrants, and a considerable number are closed to future accrual of benefits.
6.3.3. The statutory funding standard is similar to the old MFR basis in the United Kingdom and requires a pension scheme to have sufficient assets at the date of certification to provide for expenses of wind-up, purchase annuities for retirees and pay a standard transfer value (calculated based on assumptions determined by the Pensions Authority) for those not yet retired. Since 1 January 2016, a pension scheme is also required to hold a risk reserve calculated on a basis set out in legislation which reflects the extent to which liabilities are backed by assets other than bonds and cash, and any duration mismatch between bond assets and plan liabilities. If a pension scheme cannot meet the standard, the Trustees must submit to the Pensions Authority a funding proposal (recovery plan) designed to rectify the position over a period.
6.3.4. It is possible, in certain circumstances, to reduce accrued benefits by application to and with the approval of the Pensions Authority – if a pension scheme does not meet the funding standard and is unaffordable. A common approach has been to remove a guarantee of post retirement increases where this was written into the rules. In some cases, the normal retirement age has been increased to reflect recent and future increases in the State Pension Age.
6.3.5. The Government introduced legislation in 2012 which provides for a minimum level of benefits in cases of the insolvency of both the employer and the pension scheme. In general, this level is 50% of accrued entitlements, but for pensioners this is increased to the lesser of 100% of benefits and €12,000 p.a. (with no allowance for future increases). If the pension scheme’s assets are insufficient to provide these benefits, the State will top them up to this minimum level.
6.3.6. According to the latest figures from the Pensions Authority, 74% of Irish pension schemes met the minimum funding level at the last measure. However, the Irish DB industry has been in the spotlight in 2017 as politicians have sought to improve regulatory protections to stop employers walking away from underfunded pension schemes – following a decision by Independent News & Media to walk away from its DB pension scheme last year.
6.4. Japan
6.4.1. Private sector DB pension schemes in Japan are known as Defined Benefit Corporate Pension (DBCP) plans. Actuarial valuations are performed every year. Funding standards for DBCP plans are based on the twin-track approach of an ongoing test and a discontinuance test. There is no insolvency protection for DBCP plans.
6.4.2. Actuarial assumptions for the ongoing valuation should be reviewed at least every 5 years. The discount rate should be determined rationally based on the expected long-term rate of return on the plan assets (a typical assumption currently is around 2.5% p.a.). There is no explicit margin for prudence or solvency. The ongoing deficit is typically amortised over a period between 3 and 20 years.
6.4.3. Actuarial assumptions for the discontinuance valuation are largely prescribed by the Government. The discount rate is revised every year based on the average yield of long dated Japanese Government Bonds (currently a discount rate for discontinuance valuation is 1.76% p.a.). As benefits are generally not vested during the term of employment, the definition of accrued benefits used in the discontinuance valuation is different to that for the ongoing valuation. If the annual amount necessary to make up the deficit on the discontinuance basis exceeds that required on the ongoing valuation basis, the additional funding has to be made up by the employer on a tiered basis: over not more than 5 years to restore discontinuance funding to 80%; over not more than 10 years to restore discontinuance funding to 90%; and over not more than 15 years to restore 100% discontinuance funding.
6.4.4. Japanese law permits disadvantageous amendments to DBCP plans provided that the employer suffers financial distress and the Government is satisfied that the amendment meets certain requirements, in particular the proper explanation to and consent of the relevant participants.
6.4.5. At the end of March 2014, the average funding ratio of DBCP Plans was 115% on an ongoing basis and 110% on a discontinuance basis. This was based on 620 DBCP Plans polled by the Pension Fund Association.
6.5. The Netherlands
6.5.1. The Dutch Central Bank (DNB) examines the financial position of Dutch pension schemes. DNB assesses whether pension schemes are financially healthy and whether they can be expected to meet their future obligations. The DNB is also responsible for substantive regulation, such as monitoring that pension schemes comply with the standards set for them. There is no insolvency protection but benefit reductions can be applied when recovery to full funding is not possible.
6.5.2. On 1 January 2015 a new financial assessment framework (FTK) for pension plans was introduced. This covered rules for funding requirements, recovery plans and the circumstances when changes (reductions) are permitted to be made to benefits.
6.5.3. The FTK is built around the principles of market valuation, risk-based financial requirements and transparency. Under these requirements, the required reserve (the technical provision) is determined by discounting expected future cash flows against the current nominal term structure of interest rates, using the new ultimate forward rate (UFR). Additionally, risk-based reserves are required based on the pension scheme’s exposure to risk. Finally, transparency is required at disclosing a clear and objective view of the pension scheme’s financial position.
6.5.4. Before 2012, pension schemes had to discount their liabilities against a 3-month average of market rates. However, using a pure market rate caused too much funding volatility. This led to the introduction of the UFR. The UFR was initially fixed at 4.2% which was close to the fixed 4% rate for discounting liabilities that pension schemes used until the introduction of the initial FTK in 2007. The DNB sought to bring the UFR closer in line with market realities by calculating it on the basis of the 10-year average of the 20-year forward rate, which was 3.3% at the time of the 2015 FTK changes. But as interest rates were much higher a decade ago, the UFR will continue to fall in coming years.
6.5.5. It is possible to smooth discount rates over a (maximum) period of 10 years to determine the required contributions. It is also possible to use the expected return on assets (as a discount rate) to determine the required contributions under certain conditions, including financing and future conditional indexations (instead of the solvency buffer).
6.5.6. Strict funding rules apply for indexation to be granted, while benefit reductions, if necessary, are smoothed over time:
∙ Indexation is not allowed at funding ratios below 110%.
∙ Indexation must be future-proof.
∙ Rolling 10-year recovery plans apply when funding ratios are below the full funding level.
∙ Benefit reductions are required when recovery to full funding within 10 years is not expected. Reductions will amount to one-tenth of the deficit.
∙ Further benefit reductions apply when funding ratios are below 105% and a pension scheme does not expect recovery to full funding within 10 years to be economically viable.
6.6. South Africa
6.6.1. South African pension schemes are managed by boards of trustees made up of member and employer representatives. They must be registered with the supervisory authority and they are regulated to ensure they are financially sound. The pension plan must submit annual financial statements and statutory actuarial valuations to the regulatory authority at least once every 3 years.
6.6.2. The regulatory authority has issued legislation to establish a consistent actuarial valuation method and basis which sets out how statutory actuarial valuation reports have to be prepared and the financial position of the pension scheme determined. Under this legislation, best-estimate assumptions must be used in the determination of the accrued liabilities. However, the actuarial valuation basis used to determine the financial soundness of the pension scheme must be sufficiently conservative. For this purpose, a discount rate related to the expected return on assets may be used, with the condition that the risk premium on growth assets (e.g. equity) may not exceed 3% per annum. Surplus, however, may only be used if the value of the pension scheme assets exceeds the value of liabilities on a more conservative bond rates basis. This forms an inherent buffer to protect the fund against adverse experience.
6.6.3. Pension schemes are allowed to establish reserve accounts. From a supervisory perspective, the establishment and magnitude of such a reserve must be properly motivated. If a pension scheme has a deficit, a recovery plan must be submitted to remove the deficit within a prescribed period, generally three years, and this recovery plan must be accepted by the regulator.
6.6.4. There is no insolvency protection available to South African pension schemes. In the event of an employer insolvency where there is no other entity to take on responsibility for the pension scheme the pension scheme is dissolved and the available funds are transferred to alternative arrangements.
6.7. United States of America
6.7.1. DB pension plans are widespread in the United States but they are gradually being replaced by DC plans. There are two main types of DB pension plans in the private sector: single-employer (SE) plans and multiemployer (ME) plans. SE plans are generally sponsored and maintained by one employer or a group of employers under common control (parent and subsidiaries). The sponsoring employer funds the plan, sets the plan’s investment policy, oversees plan operations (including calculating and paying benefits), and fulfils other fiduciary duties.
6.7.2. ME plans are collectively bargained plans maintained by a union and two or more employers, usually within the same or related industries. These plans are particularly common in the building and construction industries, where union members often work for a number of employers during their careers. A joint board of trustees with equal employer and union representation typically governs and administers the plan.
6.7.3. The Internal Revenue Service/Department of Treasury has regulatory jurisdiction with respect to the conditions that pension plans must meet to be tax qualified, including MFRs and maximum tax-deductible contribution limits.
6.7.4. Minimum funding rules require that SE plans measure the present value of accrued benefits using prescribed discount rates on high quality corporate bonds and mortality tables – all other assumptions are best estimate – and target full funding within 7 years. This requirement was enacted in 2006 and effective in 2008, but was subsequently modified to ease funding burdens on employers, which had escalated in the wake of the 2008 financial crisis.
6.7.5. In 2012 a transport bill, more formally known as the Moving Ahead for Progress in the 21st Century Act (MAP-21), was enacted which included provisions to allow employers to measure pension liabilities using a 25-year moving average of interest rates. This had the effect of significantly reducing minimum required contributions (and in the process improving corporate profitability and providing additional tax revenues to finance the other provisions of the transport bill). This means SE plans that appear well funded on the current prescribed funding basis may actually be substantially underfunded on a solvency basis. Plans must disclose their funded status using unsmoothed discount rates in a supplement to the annual funding notice provided to members.
6.7.6. ME plans measure present values at expected rates of return and amortise most changes in unfunded liability over 15 years. Plans that are endangered (generally less than 80% funded) or critical (generally close to failing to meet projected minimum funding standards) must establish funding improvement or rehabilitation plans designed to meet specified funding benchmarks. Contributing employers to critical plans are subject to an automatic surcharge until collective bargaining agreements are renegotiated consistent with the funding rehabilitation plan.
6.7.7. Vested accrued benefits are guaranteed by the Pension Benefit Guaranty Corporation (PBGC), up to statutory limits. The PBGC is funded by premiums paid by covered plans. In the event the sponsor of an SE plan becomes unable to continue the plan, the PBGC may take over the assets and obligations of the plan and pay subsequent benefits up to certain limits. For SE plans, the maximum guaranteed benefit is adjusted annually for inflation. For SE plans terminating in 2017, the maximum guaranteed benefit starting at age 65 in the single-life annuity form is $64,431.84 per year. In a 2007 study the PBGC found that only 16% of retirees’ benefits were reduced after PBGC took over their SE plan and the average reduction was 28%.
6.7.8. ME plans generally continue to pay full benefits until their assets are exhausted at which time the PBGC will lend the ME plan funds sufficient to pay guaranteed benefits. The guarantee limits for ME plans are substantially lower than for SE plans and are not adjusted for inflation. The maximum amount the agency can pay to an ME member with 30 years of service is $12,870 per year. In a 2015 report the PBGC found that 21% of ME members in plans that are already receiving financial assistance have been affected by benefits reductions. But going forward, the agency expects 51% of members in insolvent plans will face a reduction – assuming the guarantee program itself does not become insolvent. The ME program is expected to be insolvent by 2025 unless the US Congress takes action to save it. If the program becomes insolvent, financial assistance will drop to the level that can be supported by current ME premium income.
6.7.9. The regulatory framework for ME plans was revised in late 2014 to permit some plans faced with insolvency within 20 years to “suspend” benefits in excess of 110% of the PBGC-guaranteed amount payable to non-disabled retirees under age 80 (with a phase-out between ages 75 and 80). This step is only available after the trustees have taken all other reasonable measures to prevent insolvency, and only if the benefit reductions are expected – but do not materially exceed reductions needed – to prevent future insolvency. The benefit suspension process is complex, requiring Treasury Department approval and a member vote. As of 31 December 2016, the Treasury Department has approved one application to suspend benefits, denied four applications and continues to review five applications.
6.7.10. In the public sector, the situation is very different. There are many challenges being faced in the United States when it comes to financing public sector pensions, which vary from very small plans covering a handful of employees up to state-wide plans covering hundreds of thousands of public sector workers. The many issues facing US public sector plans are beyond the scope of this paper. Big pension deficits have already contributed to the bankruptcy of several US cities, including Detroit. US public sector plans calculate liabilities using discount rates based on expected asset returns. Typically they are currently using discount rates of 7.5% or more. But they still have deficits (and growing liabilities even on this basis) and there is no insolvency protection for public sector pension plans.
6.7.11. The total officially recorded deficit in US state and local government plans currently stands at $1,378 billion. But this assumes a discount rate of 7.6%. Joshua Rauh, professor of finance at Stanford Graduate School of Business, has estimated the total deficit at $3,846 billion (Rauh, Reference Rauh2017), using a Treasury yield curve that matches the duration of the liabilities and results in a liability-weighted average discount rate of 2.8%.
6.7.12. For some of the worst affected, the numbers make grim reading. Joshua Rauh estimates that Chicago has a pension deficit equal to 19 years of the city’s tax revenues. This challenging situation is not doing any favours for the reputation of actuaries – the American businessman and politician, Michael Bloomberg was reported as saying on a trip to Albany in February 2012 “The actuary is supposedly going to lower the assumed reinvestment rate from an absolutely hysterical, laughable 8% to a totally indefensible 7% or 7.5%. If I can give you one piece of financial advice: If somebody offers you a guaranteed 7% on your money for the rest of your life, you take it and just make sure the guy’s name is not Madoff.”
6.8. In Conclusion
6.8.1. Across the world it is generally accepted by politicians and regulators that pension schemes can and should provide less security of income than would be available from an insurance company. The regulatory frameworks that exist, and most countries do have minimum funding standards for DB pension schemes, nearly all have target levels of funding which are not sufficient to guarantee the delivery of benefits in the event of the insolvency of the sponsoring employer. Some minimum funding standards are based on matching approach, others on a budgeting approach; Canada and Japan use both a matching and budgeting approach. But it is notable that all minimum funding standards have struggled to be robust in the face of the recent financial crisis. In particular most regulatory frameworks result in DB pension schemes creating implied self-investment in the sponsoring employer (as described in chapter 4). The systems that have possibly fared better have been those which do not encourage inappropriate risk taking, where there is greater transparency of risks and potential outcomes, and particularly where there is a clear understanding (and acceptance) of the implied self-investment (through the DB pension scheme) that the sponsoring employer is able to bear.
6.8.2. The United Kingdom is perhaps closest in regulatory environment to South Africa, although noting that South Africa does not have an equivalent of the PPF but it does typically have much shorter recovery periods. Both Ireland and the Netherlands have mechanisms to allow benefits to be reduced when they cannot be afforded, although this is a more established feature of the Dutch system. In Canada risk sharing is achieved by participants sharing in deficit funding. The Dutch system approach to risk sharing is interesting for its collaborative approach between employers and participants. Perhaps a more socialist outlook in the Netherlands means that when a pension scheme gets into difficulty, management and unions work together to find a fair solution. It is almost inconceivable in the Netherlands that an employer could be driven into insolvency by its pension scheme. But even the Dutch have had challenges implementing pension reductions. Insolvency protection appears in a number of countries, particularly the United Kingdom and the United States, and this does provide another layer of protection. But at the same time it can create moral hazard challenges, by potentially encouraging risk-taking.
6.8.3. All countries have struggled with the multiple and often conflicting challenges of security, sustainability, affordability and adequacy, particularly in the wake of the recent financial crisis. As a result, DB pension schemes across the world are being replaced by DC schemes and typically at rates of contribution that are going to mean significantly poorer retirement outcomes for participants, particularly as life expectancy continues to improve.
7. What Question is This Paper Trying to Answer?
7.1. Meeting TPR’s Challenge of IRM
7.1.1. Chapter 3 highlights that there appears little correlation between the strength of the employer covenant and the assumptions used in determining technical provisions across UK DB pension schemes. This raises serious questions about the successful operation of scheme specific funding. It could even lead to suggestions that it might have been better to stay with the old MFR and simply update it as market conditions changed which could make for cheaper actuarial valuations as these would simply be a number crunching exercise with little or no need for costly and lengthy interventions from TPR. If actuaries are to demonstrate the value that they can bring, it is important that the outcomes from scheme specific funding are seen to be better than the outcomes from a formulaic approach. It is a key objective of this paper to suggest a framework for a scheme specific approach that will deliver better outcomes.
7.1.2. As noted in the Introduction, the funding of a pension scheme is simultaneously trying to achieve two distinct objectives which are not always aligned:
∙ Financing a long term obligation – funding benefits as they fall due
∙ Providing security for members’ benefits
Any optimal scheme specific funding framework needs to be clear about what it is trying to achieve in the context of each of these objectives.
7.1.3. The Thornton & Wilson paper focussed very much on the first of these objectives, using best estimate assumptions to calculate the financing of a long-term obligation. However, the importance of security and the solvency position was recognised by many contributors to the subsequent discussion. Indeed Paul Thornton himself said presciently: “The need to ensure that discontinuance solvency is covered with a suitable contingency margin is likely to assume increasing importance in future.” At this point it is helpful to revisit the IFoA’s discount rate project.
7.2. IFoA Discount Rate Project
7.2.1. The IFoA commissioned a working party to undertake a research project on the use of discount rates in actuarial calculations. The task set was to create a framework by which actuaries, in whatever area of work, might better understand why they use a particular approach to setting a discount rate. This would then allow the creation of a structure by which actuaries might better explain to their clients what they have done.
7.2.2. Discount rates are used to calculate the present value of future cash flows. Actuaries consider many different financial problems, most of which can be characterised as an analysis of a series of future cash flows, or a comparison between different sets of future cash flows. For example, will a series of future cash inflows (an asset) be adequate to meet a separate series of future cash outflows (a liability)?
7.2.3. The technique of “present values” or “discounted cash flows” is an approach to summarising a series of future cash flows in a more manageable way – to create a summary value in today’s monetary terms. There is a loss of information in moving to an equivalent single present value but, whilst discounted cash flow analysis is not always the best way of analysing or presenting financial data, it is a very useful and widespread tool. In particular, it is fundamental to many financial transactions, for example, the sale of a book of insurance business, or of an individual policy. If a transaction involves the transfer of a series of cash flows, there is a need to establish a transaction value. Even if a transaction is not expected to take place, a transaction value can be a useful piece of information if it exists or can be estimated. However, it is also important to realise that an estimated value of the current transaction price could be a poor indicator of future transaction prices, particularly where transactions rarely take place.
7.2.4. A number of pension schemes in the United Kingdom have been placing less emphasis on present values and discounted cash flows and instead have been attempting to focus on the cash flows as they fall due. An example of this analysis is to explore whether the income (and growth in income) from the asset portfolio will deliver sufficient cash flows to meet the benefit payments as they fall due. This approach necessarily assumes that the pension scheme will be run on a going concern basis (see chapter 8 for a discussion on funding objectives) for the rest of the life of the scheme and that the scheme will continue to be reliant on the employer covenant over the long run. This approach does have some attractions as it avoids the loss of information in moving to a single present value but it does add considerable complexity to an analysis of a scheme funding position. It also places great reliance on the continued existence of the employer for the next 40 or 50 years or more.
7.2.5. Despite the difficulties, it is important to have manageable present value numbers to aid decision making by company management and pension fund trustees and for use in communicating information to pension scheme members.
7.2.5. There is therefore a wide range of situations where calculations involving discount rates are necessary. The appropriate approach to setting a discount rate for such calculations is normally determined by the purpose and context of the analysis. However, a number of different approaches and methodologies can be employed.
7.2.6. The choice of discount rate can be hugely significant in actuarial calculations (a small change in the discount rate can have a large impact on the outcome) so it is vital that users of actuarial advice, who are normally non-actuaries, understand the analysis with which they are presented.
7.2.7. The IFoA framework is described in Appendix 1. Essentially the IFoA recommended separating calculations into two categories – “matching” calculations and “budgeting” calculations. Matching calculations show how to price a DB pension liability for the purposes outlined in chapter 4 (e.g. transactions). Budgeting calculations offer information on the accumulation of assets to meet liability cash flows as they fall due. The connection with the objectives in 7.1.2 is clear. Financing a long term obligation is a budgeting question; providing security for members’ benefits is a matching question.
7.3. Application to the UK Regulatory Framework
7.3.1. The scheme specific funding framework outlined in chapter 3 is essentially a budgeting framework. UK politicians and regulators have agreed that pension schemes do not have to provide full security for the delivery of members’ benefits. But security of members’ benefits is clearly part of the scheme specific framework linked to the strength of the employer covenant – not least because of the need to provide some protection for the PPF. However, as noted in Appendix 1 a budgeting framework provides no useful information on the adequacy of assets in a matching framework (either currently or in the future) and specifically, therefore, little or no information on the security of members’ benefits.
7.3.2. Consequently in order to meet the challenges of IRM and the lessons of financial economics outlined in chapter 4, there is a need to overlay both a link to the strength of the sponsoring employer (the employer covenant) as well as transparency on the level of self-investment in the sponsoring employer implied by the target level of funding (i.e. by means of a matching calculation).
7.3.3. The challenge set in this paper is therefore two-fold:
∙ How to establish a funding framework with an obvious link to the strength of the employer covenant?
∙ How to overlay matching calculations to the budgeting process of setting funding objectives and assumptions which ensures that there is transparency, understanding and agreement on the level of risk being run within the pension scheme?
7.3.4. In meeting this challenge the following framework is therefore proposed, which is described in detail in the following chapters:
A. A model is suggested for setting the funding objective and funding assumptions which has a direct link to the strength of the employer covenant. For the purposes of this paper this model uses TPR’s categorisation of the employer covenant, but alternative approaches to covenant assessment could equally be applied.
B. The implied level of self-investment should be calculated and the trustees should check that the employer balance sheet is able to support this. If necessary they should establish the maximum level of implied self-investment which can be supported by the employer’s balance sheet.
C. There may be a joint desire from the employer and the trustees to be more prudent and reduce this target level of implied self-investment below this model (suggested in A) or maximum (suggested in B) level.
D. If there is a need to target a different level of implied self-investment (under B or C above) then the funding assumptions implied by the model (under A), need to be adjusted accordingly – by changing the level of prudence.
7.3.5. Further features of this funding framework are then suggested to aid transparency and understanding:
A. The recovery plan should always use “best estimate” assumptions based on the pension scheme investment strategy.
B. The length of the recovery plan should also be linked, systematically to the strength of the employer covenant, having regard to affordability levels for the sponsoring employer.
C. The Scheme Actuary should provide illustrations of the expected variance in the possible outcomes at the end of the recovery period.
D. Disclosures to members on the funding of the pension scheme should include both the current level of implied self-investment and the target level of implied self-investment.
E. A simplified IRM statement should be produced and shared with members. This would comprise a joint Statement of Investment Principles (SIP) and Statement of Funding Principles, also embracing the impact of the strength of the employer covenant.
8. Funding Objective
8.1. As noted in previous chapters, UK legislation in the scheme specific funding regime encourages trustees and advisors to consider individual scheme and sponsoring employer circumstances when setting a funding objective. This chapter discusses a range of funding objectives and how trustees and employers decide on what their funding objective should be.
8.2. Funding Objectives
8.2.1. The selection of a transparent and well understood funding objective for a pension scheme is a crucial step in developing an appropriate funding strategy. Without a clear funding objective it is much more difficult to arrive at a consistent and robust funding and investment strategy and it is impossible to measure progress against an objective that is not clearly defined.
8.2.2. The “default” funding strategy for a pension scheme is for it to be run on a going concern basis. Under this objective the trustees and sponsoring employer agree to run the scheme until the last benefits are paid out to the last members – which could be up to 90–100 years in the future. Importantly, under this objective the pension scheme will continue to be reliant on the employer covenant for the remaining life of the scheme. The employer will continue to have to stand behind the scheme, in particular if the assumptions made in the funding plan are not borne out in practice. Under this approach the scheme can adopt a scheme specific investment strategy which aims to achieve a balance between cost and risk. Further references to a “going concern” basis in this paper imply an assumed continued exposure to investment and other market risks.
8.2.3. At the other end of the spectrum, the objective may be to buy out the pension scheme with an insurer. Under this objective the aim is to pass all risks of the scheme to the insurer over an agreed timeframe and so there would be no further reliance on the employer covenant. However, the ability of the scheme to reach the funding target is also affected by insurance company pricing which can vary as a result of market conditions, changes in rules and regulations and competition in the insurance market.
8.2.4. There is also a third, intermediate option, which is often referred to as self-sufficiency. The term self-sufficiency is widely used across the pension industry but is not well defined, with various interpretations. These interpretations are discussed below.
8.3. Self-Sufficiency
8.3.1. Arguably, from a layman’s perspective, a self-sufficiency funding target should represent a position where the pension scheme is no longer reliant, in any circumstances, on further support from its sponsoring employer.
8.3.2. However, if this definition is followed in its strictest sense then it inevitably implies that self-sufficiency needs to be the same as, or indeed more expensive than, the cost of securing the pension scheme with an insurer. To have no reliance on further support from the sponsoring employer requires all risk to be eliminated. While investment and inflation-related risks can be managed effectively for the majority of schemes in most economic scenarios, this is not absolute. Investment and financial risks will remain in practice in the event of material shocks in economies/markets and failure, for example, in collateral arrangements. In addition, other major risks include:
∙ Longevity risk (both general population longevity and individual scheme variation risks)
∙ Other demographic risks (e.g. withdrawal rates, early retirement incidence and commutation rate take up)
∙ Future administrative expenses and the uncertainty around these
∙ Future PPF levies and the uncertainty around these
∙ Operational risk (which includes the risk of changes in legislation and Regulatory “guidance”)
8.3.3. The only sensible way of achieving self-sufficiency in its purest form, once all these risks and appropriate reserves are quantified, is through a buy-out – even for the largest pension schemes. This is because to assign capital against these risks (some of which are difficult to quantify) is inefficient from an employer perspective on a scheme by scheme basis and more effective when an insurer pools risks across schemes through the buy-out route. In addition the holding of these contingency reserves, which by definition might not be needed, significantly increases the likelihood of stranded surplus arising in pension schemes.
8.3.4. Another common interpretation lies at the other end of the scale and only focusses on removing investment risk. Self-sufficiency is sometimes defined as being fully funded on a “gilts-flat” or “swaps-flat” basis. This method is often used by investment consultancies and investment managers. While this method is straightforward to measure and understand, even a pension scheme fully funded on a gilts-flat basis still runs other significant risks over a long time horizon.
8.3.5. An alternative definition of self-sufficiency is where the pension scheme is in a position where it places an acceptably low level of reliance on its sponsoring employer, based on a current assessment of risks in the scheme.
8.3.6. Under this definition, it is acknowledged that it is impossible to run a pension scheme as a going concern with zero risk attached. After a certain point there will be diminishing returns from eliminating further risk and so a “real-world” interpretation of self-sufficiency is to acknowledge that some risk must continue to be borne but the pension scheme is in a position where the likelihood of needing to rely on the employer for further support is limited to a low probability. Further references to a “self-sufficiency” basis in this paper imply this acceptably low level of reliance on the sponsoring employer.
8.3.7. An analogy comes from considering the buy-out premium charged by an insurance company for taking on the risks of a pension scheme. This is the insurance company’s version of a self-sufficiency target based on its capital adequacy requirements, expense loadings, and of course profit loadings (although, in passing, it is noted that these profit loadings are likely to be less than the profit loadings including in the cost of running a pension scheme on a going concern basis). The insurance company cannot rely on further premiums from the sponsoring employer and so it will run the scheme in such a way as to minimise future risks. However, it is important to note that even the insurance company will not aim to eliminate risk completely. For example, capital adequacy requirements under Solvency II require the insurer to be able to withstand a 1 in 200 year event.
8.3.8. A key characteristic of a self-sufficiency funding basis is that it should be set independently from the strength of the sponsoring employer’s covenant – a self-sufficiency target for a particular pension scheme will be the same whether the sponsoring employer has a high or low risk covenant (a possible exception being very high risk employers). A self-sufficiency funding basis should also aim to capture all future expenses and levies related to running the pension scheme which are usually excluded from a prudent funding strategy. In effect the pension scheme is being assessed as a standalone entity and, as such, the likelihood of it being able to sustain itself in the long term can be considered.
8.4. How to Choose a Funding Objective
8.4.1. In simple terms, the funding objective must be consistent with what the employer and the trustees are trying to achieve with the pension scheme, supported by the funding and investment strategies. It is important that the trustees and employer agree on the funding objective and then work together towards this common goal.
8.4.2. However, in practice the choice of funding objective may be constrained by the strength of the employer covenant. A strong employer can choose to run the scheme on a going concern basis, and can also choose to target buyout over a reasonable period. As the employer is strong, the trustees can agree to run the scheme on either basis. On the other hand, a weak employer may be unable to support a pension scheme on a going concern basis, particularly if it is unlikely to still be in existence over the longer term. This is simply because the employer may not be in a position to make good any emerging deficit, particularly if its business is in decline.
8.4.3. It is often the case that the employer’s objective will be to target buy-out. However, the gap to buy-out can often be so large as to be seen as unaffordable. This sometimes means that the trustees default to running the scheme on a going concern basis, simply because the employer does not raise the issue. If the employer’s goal is to target buy-out then it is clearly in its interests to make this clear to the trustees so that it can be established whether the objective is realistic, and if so how best to set strategy to achieve the objective.
8.4.4. When considering the choice of scheme funding objective it should be noted that the magnitude of the pension scheme liabilities will usually continue to increase even when the pension scheme is mature. Indeed, it is quite possible for a very mature pension scheme still to be showing year on year increases in liabilities – and this may coincide with an expected decline in the size of the employer. Therefore when considering the choice of funding objective it is important to consider the likely trend in the relative size of the pension scheme and employer in the timeframe over which the scheme aims to achieve that objective.
8.4.5. A primary focus of government legislation on minimum funding is to provide security to members, as witnessed by the comment from Paul Myners noted in 2.4.6. This was recognised by the IFoA when they recommended that the MFR should be replaced by an approach based solely on adjusted bond yields. This message from the IFoA was later reinforced in the discount rate project which concluded that a budgeting calculation provides no information about the adequacy of assets in the matching framework (either currently or in the future). It might therefore appear logical (and more transparent) to have a funding objective or a minimum funding test linked to a percentage of the buy-out liabilities. This was, in fact, the recommendation and conclusion of the Cowling et al. paper (Reference Cowling, Gordon and Speed2004). However, UK regulations moved in a different direction – as described in chapters 2 and 3.
8.5. In Summary There are Therefore Three Primary Options When Selecting a Funding Objective
∙ Going concern, or meeting the benefits as they fall due
∙ Low risk self-sufficiency
∙ Buy-out
The trustees, their advisors and the sponsoring employer need to work together to arrive at an agreed objective, noting that pension schemes with a strong employer covenant probably have more flexibility to choose between these different objectives. Pension schemes with weaker covenants need to consider funding objectives and assumptions that assume much less, if any, reliance on the sponsor (i.e. much lower implied self-investment in the sponsoring employer).
9. Developing a Funding Framework Linked to the Investment Strategy and SIP
9.1. Introduction
9.1.1. The requirement for occupational pension schemes of more than 100 members to maintain a SIP was enshrined in legislation in the Pensions Act 1995. The Statement was to set out trustees’ compliance on, amongst other things, considering the appropriateness of investments, diversification and obtaining suitable written advice. Matters originally highlighted were as follows:
∙ the kinds of investments to be held,
∙ the balance between different kinds of investments,
∙ risk,
∙ the expected return on investments,
∙ the realisation of investments and
∙ such other matters as may be prescribed.
9.1.2. In practice, the vast majority of SIPs tend to begin with high level objectives along the lines of the following:
The Trustees’ primary investment objective for the Scheme is to achieve an overall rate of return that is sufficient to ensure that assets are available to meet all liabilities as and when they fall due. In doing so, the Trustees also aim to maximise returns at an acceptable level of risk taking into consideration the circumstances of the Scheme.
Statements such as the following are also common:
The Trustees have determined their investment strategy after considering the Scheme’s liability profile and their own appetite for risk, the Sponsoring Employer’s appetite for risk, and the strength of the Sponsoring Employer’s covenant.
9.1.3. Typical further information included is details of risk and return targets, asset allocation, investment managers and their mandates, the mix between investments, allowable investments, socially responsible investment policies and details of trustee responsibilities and delegation.
9.1.4. What is very rarely seen is detail on the principles that have been used to determine whether the strategy is appropriate to the strength of employer covenant. This is evidenced in chapter 3 of this paper, which includes analysis on the relationship, or lack thereof, between the proportion of return seeking assets and the strength of the employer covenant. It is possible that trustees faced with a weak covenant conclude that too conservative an investment strategy puts unmanageable strain on the sponsor and this may not necessarily be in the best interests of ensuring members’ benefits are paid in full, or as close to full as possible. In making such an assessment the trustees are implicitly relying on the existence of the PPF – or are simply looking to avoid confrontation with the employer on the additional deficit funding that a more prudent investment strategy might demand.
9.1.5. A different approach is needed to ensure that risk is taken into account explicitly in the setting of assumptions, whilst addressing the trustee dilemma described above.
9.2. Choosing the Right Assumptions
9.2.1. Chapter 8 discussed the options for choosing a funding objective, in particular that there are three primary choices:
∙ Going concern, or meeting the benefits as they fall due
∙ Low risk self-sufficiency
∙ Buy-out
9.2.2. Once the funding objective is agreed it is necessary to consider how this is going to be achieved and the assumptions that will be set in the actuarial valuation to assess progress towards that funding objective. This paper proposes that the starting point for determining the funding assumptions to be used and in particular the discount rate should be the documented and adopted investment strategy. In this way there should be an explicit link between the Statement of Funding Principles and the SIP. This paper further suggests that future anticipated changes in the investment strategy should equally be explicitly allowed for in both the SIP and the Statement of Funding Principles.
9.2.3. Beyond the starting point of the investment strategy there is a regulatory requirement (and sensible trustee perspective) to be prudent in the choice of the assumptions dependent on the strength of the employer covenant. This paper proposes that the allowance for the employer covenant be achieved by an explicit link in the choice of discount rate(s) to the probability of achieving a certain level of return from the scheme’s investment strategy.
9.2.4. Thornton and Wilson proposed that a prudent assumption is one which has a 60% probability of being achieved. They further proposed that a cautious assumption is one which has a 70% probability of being achieved. However, these probabilities were proposed at a time (before the Maxwell affair became public) when the solvency of pension schemes was generally regarded as less of an issue. To quote again from Paul Thornton on the discussion of their paper: “Where we might perhaps have placed more emphasis is on the importance of investigating the discontinuance position, where the level of solvency may these days be much closer to solvency on an ongoing basis than formerly.” Thus it is proposed that a greater degree of caution is required where there is a weak or tending to weak employer covenant.
9.2.5. This therefore suggests the following example of a framework for assessing the discount rate, linked to the probability of meeting the investment return, that trustees can adopt and which should be reflected in their Statement of Funding Principles and SIP:

The exact percentages noted above are simply a proposal for discussion and great care is needed about attaching too much reliance on such percentages, which will only be as good as the model which has produced them. It is noted in passing that the PPF is targeting a 90% likelihood of meeting its 2030 self-sufficiency target which possibly therefore represents a sensible maximum likelihood test for any pension scheme. But what is important is that the model is based on the expected returns from the investment strategy and with a direct link to the strength of the employer covenant.
9.2.6. Chapter 10 explores one way in which trustees can analyse their investment strategies to generate the possible investment returns and probabilities shown in the right hand column above. It is accepted that there are many ways in which this might be tackled. Some may prefer to use gilts (or swaps) as a starting reference (the so called “gilts+” basis); others may prefer to use an entirely different approach to modelling expected investment returns. Another area worthy of detailed consideration is the timeframe over which the investment returns are considered. Different timeframes may possibly lead to different model outcomes and care may be needed in interpreting these.
9.2.7. By adopting the approach described above, trustees can ensure that their funding and investment principles are explicitly tied to the strength of the employer covenant. Moreover, this provides a process not only for choosing appropriate assumptions linked to the pension scheme’s circumstances but also a transparent mechanism for how those assumptions might change as the scheme’s circumstances change. Additionally, the adoption of such an approach would ensure that scheme specific funding linked to the strength of the employer covenant would be much more prevalent than is evident from chapter 3.
9.2.8. This approach on its own does not address the issue of the affordability of the resultant cash funding. Applying the above approach for weak covenants may put unmanageable strain on the employer and could possibly lead to a funding strategy that accelerates a worse outcome for members. This paper proposes that this issue is addressed within the recovery plan.
9.2.9. The widespread use of “best estimate” returns within the recovery plan will help manage affordability – it is the authors’ experience that recovery plan assumptions frequently still include some prudence. Here “best estimate” assumptions are taken to mean the same as “neutral” estimates or assumptions within the context of the FRC’s Technical Actuarial Standards. However the encouragement of best estimate assumptions in the recovery plan must go hand in hand with encouraging discipline in the length of the recovery plan. A framework for determining the length of recovery plan, and therefore contributions can be adopted by expanding the previous table, as follows:

The suggested recovery plan lengths noted above are again simply a proposal for discussion. They should, of course, have regard to the affordability levels of the sponsoring employer.
9.2.10. It is important in the above approach that the level of risk within the investment strategy is appropriate for the circumstances of the pension scheme, not only at the present time, but also for the duration of the recovery plan. This is addressed in the remainder of this chapter.
9.2.11. A particular risk to acknowledge is the probability of the default of the sponsoring employer. This invariably increases with time and is more acute for weaker companies. It is exactly why the long- and short-term risks of an investment strategy must be considered in the context of the particular pension scheme situation.
9.2.12. The purpose of the alternative funding methodology described within this paper is to manage and balance the competing needs of security and affordability in a transparent way and thus to maximise the chances of members receiving their benefits in full. Not acknowledging the conflict between trustees and employers can lead to inappropriate strategies and assumptions and members suffering as a result. In extreme cases an inappropriate pension scheme funding strategy or level of risk accepted can lead to the demise of a company which otherwise may have a chance of improving its situation. Furthermore, this methodology has to embrace the dynamic situation of an employer covenant that can and will shift over time.
9.3. Can the Employer Covenant Support the Current Level of Investment Risk?
9.3.1. The investment return that corresponds with the percentages in the table in 9.2.5 will be determined by the initial investment strategy together with any planned de-risking or other changes in asset allocation.
9.3.2. Most asset models will show that, over a long enough time period, a pension scheme will be rewarded for taking risk. This can lead to the conclusion that taking a large amount of risk is the most optimal strategy. However as noted in 4.6.3 equity risk does not decrease over time, irrespective of the length of the time period considered, but as noted in 9.2.11 the probability of employer failure increases with time. Thus it is essential to consider whether the employer covenant is able to support the level of investment risk taken in the pension scheme both in the short term and into the future.
9.3.3. TPR’s IRM framework is a very good way to consider whether the investment strategy is appropriate based on scheme circumstances and the strength of employer covenant. The following paragraphs detail a process by which pension schemes can set appropriate investment strategies. It is acknowledged that many pension schemes that have adopted the risk management framework will already follow this or a similar approach.
9.3.4. Step 1 is to set out possible market scenarios that may materialise between the point of setting assumptions and the next actuarial valuation, or over a shorter (e.g. a 1 year) period. This should at least include a positive, neutral and negative scenario but can be split further and into more detailed scenarios.
9.3.5. Step 2 is to assess the risk to the deficit in each of these scenarios. The definition of risk within an investment strategy, and therefore how to measure it, can be somewhat subjective. Additionally, the approach to valuing the liabilities and, for example, the level of hedging of the liabilities within the investment strategy can all affect how this risk analysis is carried out. There are three options considered here, all of which have some merit and can be used within the process. Value at Risk (VaR) modelling simulates the scheme’s assets and liabilities through many thousands of scenarios. This gives a distribution of funding levels and deficits, the latter of which should be the focus. A 95% VaR would show that the deficit is expected to increase by this amount or more in the worst 5% of outcomes. The modelling should show the attribution to this figure from the key factors affecting assets and liabilities: interest rates, inflation expectations, market volatility, credit spreads, longevity and diversification (because not all risks are realised to the same extent at the same time). Such an approach is also consistent with the assessment of expected investment returns covered in 9.2.5 and developed in chapter 10. Alternatives to VaR include stressing the assets and liabilities in a deterministic way; either choosing a set of assumptions which represents a stressed scenario, or choosing historical events, for example, the 2007/8 financial crisis, and applying the market conditions of those events to the assets and liabilities. Again this paper is not proposing that any particular approach to such analysis is right or better. Rather it is outlining a framework within which others can develop their own analysis and models.
9.3.6. Step 3 is to consider the impact on the sponsor in each of these scenarios. Impact may be assessed in a number of ways including on the employer’s balance sheet or in terms of implications for the cash funding requirement. Does the covenant weaken significantly? Factors such as whether the sponsor is in a cyclical business, or its sensitivity to inflation (can it pass it on?) may also need to be considered in each of the scenarios.
9.3.7. Step 4 is to assess the sponsor’s ability to withstand the change in the deficit in each of the scenarios, taking account of the potential impact on the sponsor should that market scenario be realised. This is clearly a difficult assessment to make. Trustees need to consider the reliance on the sponsor, as explained in sections 3.3 and 4.9 of this paper, as well as the ability of the sponsor to increase deficit recovery contributions.
9.3.8. A formal and independent assessment of the strength of the employer covenant and its possible future development, in the context of the employer’s ability to support the pension scheme, is important in answering the questions in 9.3.6 and 9.3.7 above. It is acknowledged that the costs of such a covenant review can be prohibitive. Trustees should consider the costs in the context of the size of the pension scheme liability, but they can and should also be considering characteristics of the sponsoring employer versus the potential increase in deficit and increase in recovery contributions. These include but are not limited to market capitalisation, net debt, profit before tax, dividends paid and net assets excluding pensions. It is noted that TPR provides some very helpful guidance for pension schemes and trustees on assessing the strength of the employer covenant.
9.3.9. Defining and then incorporating the maximum accepted VaR (or whichever measure is chosen for stressing the scheme’s assets and liabilities) relative to some or all of these measures should be incorporated into the trustees’ policies, including statement of funding principles and SIP. This instils an objective approach into the setting of future assumptions.
9.3.10. Step 5 of the process is then to conclude whether the risk within the investment strategy is able to be supported by the strength of the sponsor covenant, having regard also to possible future changes in the sponsor covenant. If it is not, a revised strategy must be considered and the process repeated. This may include, for example, targeting specific risks, such as by increasing liability hedging; or replacing equities with less volatile growth asset classes.
9.4. De-Risking
9.4.1. The above framework would much more closely align the investment strategy with the circumstances of the employer, and provide a process for how the strategy needs to change for changing circumstance; both in the size of the company and the size of the pension scheme.
9.4.2. However, revisiting the earlier comment of an increasing probability of company failure with time, it is the desirable intention of many trustees, and frankly many sponsors, to reduce the reliance on the sponsor over time. Following the process outlined in 9.3, trustees may be able to accept a higher level of risk initially than is their longer-term target. In addition, the framework above could mandate a move to reducing investment risk over time:
∙ Whilst virtually all pension schemes are maturing, the vast majority are expected to get bigger in monetary terms before they get smaller;
∙ The effect of investment returns and, crucially deficit recovery contributions, will increase the value of assets which, all else being equal, naturally increases Value at Risk (there is more to lose!).
9.4.3. Considering risk over the longer term requires different analysis than the shorter-term market shock analysis described above. In particular, there is a risk that asset returns will be insufficient to meet the liabilities.
9.4.4. A corollary to this is, even if the level of risk, as measured by Value at Risk and scenario analysis is acceptable relative to the sponsor situation, is the level of risk necessary to achieve the required returns to meet the agreed upon objective?
9.4.5. Trustees should therefore have a clear understanding of the expectation of the development of the funding level. The SIP should state how often this is measured and if there is deviation compared to expectation for the:
∙ funding level;
∙ size of assets;
∙ value placed on liabilities;
∙ therefore the risk measures indicated earlier.
9.4.6. It should be documented within the SIP what actions to take should deviation be outside pre-specified parameters, as well as any specific de-risking that has been agreed at certain funding levels/points in time. In this way, the SIP is consistent with the trustees’ long term strategy and accepted levels of risk.
9.4.7. Finally in this chapter it is necessary to strike a word of caution. If funding assumptions are linked directly to the investment strategy, there is the possible temptation to increase investment risk in order to get a more favourable outcome from a funding calculation. This is addressed further in the following chapters and in particular in paragraphs 10.4.3 and 11.2.4.
10. Modelling Expected Investment Returns
10.1. Introduction
10.1.1. The previous chapter introduced the concept of assigning a probability to achieving a certain level of return for a given investment strategy. To be able to do this requires some form of distribution of returns. From this distribution, it is then possible to say what percentage of returns fall above or below a certain level. Put another, it is possible to say what level of return corresponds to each percentile. This is illustrated in the following example.

10.1.2. Such analysis needs to be clear on exactly what return is being measured, as well as how the distribution is arrived at. This chapter considers the following:
∙ Over what time period is the analysis being undertaken?
∙ Should the return be in absolute terms or relative to some measure, for example, gilts, cash or inflation?
∙ How should the distribution be derived?
∙ How to take account of cash flows and changing strategies?
10.2. Appropriate Time Frames
10.2.1. Historical evidence suggests that the variability of annualised returns is different depending on the timeframe over which those returns are being analysed. This is well illustrated in the following chart from the 2017 Barclays Equity Gilt Study (Figure 12). However, there is no guarantee such returns will always be repeated. In particular, the 20-year returns below represent only five independent periods whereas potential future scenarios are very many. Indeed, the sample set for all the periods can be considered as somewhat limited when considering the impact of sampling error.

Figure 12 Maximum and minimum real returns over different periods.
10.2.2. The previous chapter discussed the differences between short- and long-term risk. The approach proposed will take account of the shorter-term risks in how the strategy is set. But the use of a long-term expected return is consistent with the duration of the pension liabilities.
10.2.3. Noting the sensitivity to short-term risk, the analysis over shorter-time periods is also informative to setting an appropriate starting strategy. Analysing over a three year period, to the next formal actuarial valuation, will illustrate the possible volatility at the next valuation and test the ability of the covenant to support the investment strategy. That is, will the sponsor be able to afford the implied increase in contributions from an adverse scenario?
10.3. What Returns to Measure?
10.3.1. The vast majority of pension schemes use a gilt or swap based discount rate to measure the value placed on the liabilities and therefore the funding level. This “mark to market” approach is consistent with standard accounting practices for valuing assets. It is also consistent with how any Section 75 debt on the employer would be assessed. One can argue therefore that it is the return achieved relative to gilts that is important and that this is what should be measured.
10.3.2. The counter argument to this is that, to pay pensions, it is absolute or inflation linked returns that are required and therefore this, or some combination reflecting the inflation linkage within the pension scheme, is correct.
10.3.3. In the majority of cases, a return relative to gilts and index-linked gilts (or swaps) will be appropriate. This reflects the understanding that only buying out liabilities with an insurance company can remove the risks faced to members; or at least to the extent that that risk is the responsibility of trustees and the sponsor.
10.3.4. Nonetheless, individual circumstances should be taken into account and where there is a strong sponsor that can withstand unexpected increases and calls to provide new contributions, and where there is an expectation to run the scheme as a going concern for the very long term, absolute returns may be appropriate.
10.4. Deriving the Distribution of Possible Investment Returns
10.4.1. There are three main options trustees can consider using. Each has its drawbacks and advantages.
a) Historical returns
It is possible to chart the historical returns for a selected time period. It would then be possible to measure what level of return corresponds with the required level of confidence for the given strategy.
One issue with this approach is the availability of information. Whilst there is a reasonable data set for equity and gilt returns, the vast majority of pension schemes now diversify to alternative assets for which historical data is limited. For example, even corporate bond indices do not exist for periods before 1990.
A further issue is the old adage; historical performance is not a guide to future performance. An example of this might be the impact of maturing, de-risking pension schemes on the gilts market, and how this may affect future investment returns compared to the past.
In summary whilst historical returns could be used for simpler strategies, this approach is not preferred.
b) A deterministic forecasting approach
This method is highly subjective. Whilst it is the case that asset managers, investment banks and other financial and economic institutions will have forecasts for future returns, this is not normally in the form illustrated at the start of this section.
In addition, as investment strategies have become increasingly complex, it is important to understand the relationship between different types of assets in different scenarios. Forecasting this in a subjective way is not practical.
A further issue with this method is dealing with changing strategies. The need to take account of anticipated changes in the investment strategy is discussed later. But this adds further complexity to the forecasting.
This method is therefore not preferred.
c) Use of asset models/economic scenario generators
There is wide availability of economic scenario generators. These models typically forecast a range of asset classes, year by year, across many thousands of scenarios.
Use of these generators allows the analysis to be undertaken relatively easily. However, there is a high dependency on the integrity of the asset model. In particular, models that rely on assumption of normal distributions are likely to underestimate the frequency and magnitude of adverse events.
It is also important to understand the biases of asset models. Over a long enough time period, they will favour equity and other growth assets over bonds. This is not necessarily inappropriate, particularly with reference to historical experience; but there are periods where this is not borne out and the earlier warnings against using historical data are again highlighted.
Nonetheless, whilst trustees should have a clear understanding of the assumptions within any asset model, this is the preferred approach in determining confidence levels of achieving a set level of return.
10.4.2. The following (Figure 13) is an example of how different strategies show different levels of return for each level of confidence.

Figure 13 Distribution of annualised returns above gilts after 15 years.
It is important to note that the above example shows the distribution of returns above gilts in each scenario rather than the absolute return. It is also possible to show the return in absolute terms or other “liability drivers” such as cash or inflation, depending on the trustees’ beliefs and the scheme situation.
10.4.3. The scheme that has a “strong” sponsor covenant would use a higher discount rate if selecting the investment return at the 60% or 70% level of confidence. That scheme may also have been able to select a higher risk strategy following the process described in chapter 9. This highlights one of the challenges of the philosophy of the funding approach outlined in this paper. Taking on more investment risk can have a very significant downside effect if the returns actually generated are poor. The sponsor has to be able to support any shortfall and hence the trustees of a pension scheme with a weak sponsor covenant must seek greater confidence of achieving the returns that have been assumed.
10.5. Accounting for Cash Flows and Evolving Strategies
10.5.1. It is possible to analyse investment returns in isolation. However, the actual experience of the scheme will involve cash flows; monies out from benefit payments and monies in from deficit recovery contributions. Where the cash flows are material compared to the size of the scheme, it can have a material impact on returns.
10.5.2. It is acknowledged that modelling that takes into account scheme specific cash flows can have prohibitive costs, but where it is possible it is preferred. Despite this, where it is not possible more approximate analysis still yields valuable insights.
10.5.3. What is more important is to take account of expected changes to the investment strategy. It is of limited, if any, use to model a strategy over a period where the expectation is that strategy will not be used. As noted in the previous chapter, many schemes will have the intention to de-risk in one way or another, whether it is to increase liability hedging, decrease the allocation growth assets or something else. This de-risking needs to be taken into account in every scenario modelled to provide the required information.
11. Proposed IRM Approach
11.1. Employer Covenant Analysis
11.1.1. The starting point for an IRM approach needs to be an assessment of the strength of the employer covenant. This paper references the Pension Regulator’s categorisation of employer covenant (CG1 to CG4) but there are many providers of employer covenant assessment services with their own models and categorisation systems which could be equally adapted to the IRM approach outlined in this paper.
11.1.2. However, it is not enough to look simply at the current strength of the employer covenant. In making a judgement on appropriate levels of risk to run in a DB pension scheme, trustees should consider the both the size of the pension scheme relative to the size of the employer and look at the future. This might cover trends in both the relative size of the pension scheme and the strength of the employer covenant, at least over the length of any recovery plan.
11.2. Investment Strategy
11.2.1. Chapter 4 gives a brief overview of the financial economic case for bond investment in DB pension schemes in the United Kingdom. However, whilst bond investment has been steadily increasing over the last 10–20 years in UK pension schemes, it is still the case that a substantial proportion of pension scheme assets are invested in equities and other growth assets. This situation is likely to continue as many pension schemes are relying on their growth assets to deliver outperformance over bonds and avoid an otherwise significant increase required in employer contributions.
11.2.2. If the pension scheme is going to continue to hold growth assets, the trustees need to check that the employer covenant can support the current level of investment risk in the pension scheme. Moreover, consideration should also be given to the likely future direction of the investment strategy given the maturing pension liabilities and considering the possible future strength of the employer covenant. It is recommended that this is then documented in the SIP.
11.2.3. The trustees should then analyse the current (and future) investment strategy, from the SIP, as illustrated in chapter 10. This will determine not only the best estimate expected investment return, but also a model of the possible future investment returns (relative to a matched portfolio of bonds) at different levels of likelihood.
11.2.4. It is particularly important that the trustees do not take on more investment risk than is appropriate for the circumstances of the pension scheme. It is a consequence of budgeting calculations that they will look more favourable (i.e. present a better funding position) the greater is the investment risk taken on and assumed. However, as already noted, budgeting calculations on their own, give little useful information on the security of members’ benefits. Moreover, now that there are few if any discretionary benefits awarded to members of DB pension schemes there is little benefit that falls to members from the trustees taking on investment risk. Trustees should therefore, in most circumstances, be looking to reduce investment risk wherever possible. Perhaps if the employer wishes the trustees to take on more investment risk, to reduce the cash funding costs, the employer should directly underwrite the implications of poor investment returns – possibly with a formal agreement to accelerate additional contributions if the investment strategy is not successful.
11.3. Funding Strategy
11.3.1. The trustees and the employer should agree first on their funding objective, as described in chapter 8, based on the primary choices of:
∙ Going-concern, or meeting the benefits as they fall due
∙ Low-risk self-sufficiency
∙ Buy-out
11.3.2. The choice of discount rate should then be derived from the employer covenant assessment and the modelling of the possible future investment returns as illustrated in chapter 9 and the following table:

It should be noted that such analysis could yield a single point discount rate, a series of discount rates (including separate pre- and post-retirement rates if that aligns with the documented investment strategy) or even a full yield curve. This paper expresses no preference on the use of single discount rate versus yield curves, except to note that analysis of settlement options (including buy-out) is possibly easier and better done using the information available from a full yield curve.
11.3.3. It is possible that the modelling envisaged in 11.3.2 could result in an implied discount rate which is less than a gilts based discount rate. It is suggested that, in any event, a gilts based discount rate would represent the minimum that would be adopted. It is possible that such a minimum discount rate could be set a little higher, at say gilts+0.3%, representing a low risk self-sufficiency target.
11.3.4. The trustees should then carry out a check that the employer covenant is able to support the level of implied self-investment represented by the pension scheme. A suggested test for this is that funding objective should represent a maximum level of implied self-investment of 50% of the employer’s current balance sheet. Other tests (or percentages) are possible, but a robust objective and transparent test is preferable to avoid protracted negotiations whenever it might apply. The 50% limit is suggested to give a margin against a possible deterioration in the employer’s balance sheet and also to reflect the likelihood that the balance sheet value on insolvency may be lower. At the same time the trustees may need to consider whether the assets shown on the balance sheet are included at a fair value. This is something that should be available from the employer covenant analysis.
11.3.5. The 50% limit suggested in 11.3.4 may be compared with the Pension Regulator’s definition of “insufficiently resourced” used by the Regulator to decide whether a corporate group is able to support a scheme (Section 44 of the Pensions Act 2004). “A company is insufficiently resourced if it is unable to meet 50% of the scheme’s liabilities (calculated on a full buy-out basis) in circumstances in which one other group member, whether on its own or collectively with any connected and associated entities, can bridge that gap from its (their) available resources. If that is the case, each and every such associated or connected person is susceptible to a financial support direction.”
11.3.6. If the maximum cap in 11.3.4 applies or the trustees and employer jointly agree to a more prudent approach (i.e. lower implied self-investment) than suggested by the model output in 11.3.2 then the discount rate assumption(s) can be modified accordingly, by adopting a higher probability of meeting the investment return (i.e. a lower discount rate).
11.3.7. For a recovery plan it is suggested that best estimate assumptions are used, taken from the investment return analysis already carried out. Paragraph 9.2.9 suggested maximum recovery plans linked to the strength of the employer covenant. It is important that a robust approach is taken to the length of the recovery plans as a balance to the use of best estimate assumptions and also as evidence of the employer’s willingness as well as ability to pay any deficit contributions. It is equally important that the trustees consider whether, in the particular circumstances of a pension scheme and the sponsoring employer, a shorter (or possibly longer) recovery plan may be more appropriate, linked to consideration of affordability and the future of the sponsoring employer and other relevant factors such as the availability of a charge over employer assets.
11.3.8. Finally a check is needed on the overall robustness of the resulting strategy. This might be achieved by the Scheme Actuary providing illustrations of the expected variance in the possible outcomes at the end of the recovery period.
11.3.9. Appendix 2 contains an illustration of applying this approach to an example pension scheme.
11.4. IRM Statement
11.4.1. Disclosure regulations as well as a desire by trustees and employers to provide comprehensive information to pension scheme members often results in members being swamped by a confusing mass of information. Often this means that some of the key information is lost in the wealth of information that is provided or available. A short (3 or 4 pages) IRM statement which could be made available to all members and other relevant parties, including shareholders, would improve transparency and aid understanding of the management of the pension scheme. Such a statement might include:
a) A brief summary of the analysis of the employer covenant.
b) A brief summary of the current (and future) investment strategy and how this is supported by the employer covenant, together with the analysis of the possible future investment returns.
c) A brief description of the funding objective (including the discount rate assumptions and their derivation from the employer covenant and the investment strategy) and what this means for the implied level of self-investment and the reliance on the continuing support of the employer.
d) A brief summary of the agreed recovery plan, including justification for the length of the recovery plan.
12. Conclusions and Recommendations
12.1. The funding of DB pension schemes in the United Kingdom has evolved over many decades and under very different market conditions and regulatory environments. But the challenge of simultaneously meeting the twin objectives outlined in paragraph 1.2.1 is one that has consistently caused problems for actuaries and regulators alike – both in the United Kingdom and overseas. The issues have been debated (many times) before – as noted in the references to the papers of McLeish & Stewart and Thornton & Wilson. Yet still in 2017, as noted in paragraph 1.1.2, the debate continues.
12.2. In the United Kingdom, a combination of changes in regulations and common practice mean that most if not all benefits in DB pension schemes are fully guaranteed. Unlike in many European countries, there is very little scope to adjust (reduce) DB benefits even if conditions become extremely difficult. This increases the challenge of providing security for members’ benefits and possibly suggests that security should be the prime focus of funding regulations. The Myners Review was published in March 2001 and was a core contribution to the Government making a commitment at the same time to replace the MFR with a long-term scheme specific funding standard with additional protective measures. As noted in paragraph 2.4.6 Paul Myners had earlier commented (in November 2000): “Providing security for members of defined benefit pension schemes is an essential objective for any responsibly run pensions system.”
12.3. Scheme specific funding has faced many challenges since its introduction and arguably it has not proved the success that Paul Myners and the Government had hoped, albeit in the face of some very challenging market conditions in the wake of the financial crisis. During this time TPR has overseen the operation and governance of scheme specific funding and has recently issued guidance on IRM which is to be welcomed. This paper has sought to meet the challenges of scheme specific funding and recommend a way forward that embraces this IRM framework in a way that is open, transparent and focussed on meeting customer needs.
12.4. Conclusions
∙ There is little evidence that scheme specific funding is indeed scheme specific, at least in terms of links to the strength of the employer covenant and the actual investment strategy, both current and future.
∙ For all its faults it is not clear that the much maligned MFR, had it been updated (e.g. along the lines as applies in Ireland) would have provided worse outcomes than our current scheme specific framework in the United Kingdom – and it would likely be cheaper in terms of adviser costs. Indeed it might have provided better outcomes in terms of encouraging better levels of funding and lower risk taking, particularly for very mature schemes.
∙ Minimum funding approaches based on budgeting approaches are not optimal for solvency purposes and are always susceptible to adverse outcomes in challenging financial conditions, particularly where the level of asset/liability matching is poor.
∙ Member communication based on a budgeting calculation gives misleading information about the security of members’ benefits. Just because a pension scheme is 100% funded on a budgeting calculation does not mean that members will get 100% of their benefits in the event of an employer insolvency.
∙ Scheme specific funding has also faced criticism that the prudence built into assumptions means that actuarial valuations present an overly pessimistic view of the ability of a pension scheme to meet the benefits as they fall due.
∙ The IRM framework promoted by TPR creates an opportunity to align funding and investment strategies better with the employer covenant.
12.5. Recommendations
∙ A better minimum funding standard would be one linked to a matching calculation – as recommended by the IFoA in their May 2000 Review of the MFR.
∙ A more transparent, and therefore fairer to members from a “treating customers fairly” perspective, approach would be to agree to a funding target which is an agreed percentage of the buy-out basis. But this would only be possible by a change in regulations.
∙ Staying within the existing scheme specific regulations, there should be a clear and robust link between funding, investment and employer covenant as proposed in chapter 11. In particular the discount rate(s) assumed should be directly linked to a likelihood of achieving an expected return on the pension scheme’s investments, such likelihood to be linked to the strength of the employer covenant.
∙ The funding objective should be clearly stated and understood and the implied self-investment (and attaching solvency risks), both currently and at the target funding objective, should be transparently communicated to pension scheme members.
∙ The recovery plan should use “best estimate” assumptions based on the pension scheme investment strategy.
∙ The length of the recovery plan should also be linked, systematically to the strength of the employer covenant.
∙ The Scheme Actuary should provide illustrations of the expected variance in the possible outcomes at the end of the recovery period.
∙ A simplified IRM statement as described in chapter 11, should be produced and shared with pension scheme members.
Disclaimer
The views expressed in this publication are those of invited contributors and not necessarily those of the IFoA. The IFoA do not endorse any of the views stated, nor any claims or representations made in this publication and accept no responsibility or liability to any person for loss or damage suffered as a consequence of their placing reliance upon any view, claim or representation made in this publication. The information and expressions of opinion contained in this publication are not intended to be a comprehensive study, nor to provide actuarial advice or advice of any nature and should not be treated as a substitute for specific advice concerning individual situations. On no account may any part of this publication be reproduced without the written permission of the IFoA or the authors.
Acknowledgements
The authors would like to thank the two scrutineers whose valuable comments helped improve this paper. In addition, the authors thank Cliff Speed, Phil Wadsworth and John Wilson for their invaluable help in the drafting of this paper.
Appendix 1: IFoA Discount Rate Framework
The research carried out by the IFoA shows that most actuarial calculations involving discount rates can be separated into two categories – “matching” or “budgeting”.
Matching Calculations
This is the family of calculations where the liability is valued by reference to market instruments (or models to simulate market instruments) that seeks to match the characteristics of the liability cash flows. Generally, the discount rates used are those implicit in the market prices of the matching market instruments or a reasoned best estimate if there is no deep liquid and transparent market.
Budgeting Calculations
This is the family of calculations where the valuation of the liability is approached from the viewpoint of how the liability is going to be financed and so the discount rate is often based on the expected returns from an agreed investment strategy.
Matching calculations can be particularly appropriate for transactional work. This includes the calculation of liabilities for company accounts, solvency reserves and in circumstances where it is desired to create an investment portfolio to match or hedge a liability. Budgeting calculations can be appropriate in long term financial planning where a portfolio of investments is expected to accumulate to meet a liability. This categorisation is not perfect and there are some situations where a blended approach involving elements of both matching and budgeting calculations may be helpful.
Whether the actuarial analysis involves matching calculations or budgeting calculations the choice of an appropriate discount rate will require the use of “building blocks”. These building blocks show how the discount rate is made up and justify the choice of the discount rate by the actuary.
Matching Calculations
Matching calculations have the common theme of valuing a liability with reference to the discount rate (or curve of discount rates) implicit in the market price of a replicating portfolio of investments or market instruments (normally a portfolio of investments is required to create the matching asset). Such calculations are commonly described as being “market consistent”. The relevant portfolio is one that mirrors the characteristics of the liability cash flows in question.
For example, an insurer has contracted to provide a series of cash flows to policyholders. Suppose that the insurer can find a “replicating portfolio” of bonds whose cash flows exactly replicate those contracted to the policyholders, in all possible outcomes. In that special case, assets and liabilities would be expected to be assessed consistently, since the timing, probability and amount of each payment is identical, so that their respective values are equal. This implies that the market consistent value of the liabilities is the market value of the corresponding replicating portfolio.
However, it is rare to be able to construct an exactly replicating portfolio, so there are limits to this matching process. In such circumstances it can still be possible to develop an appropriate proxy discount rate that is market consistent by the use of “building blocks” that are normally derived from known characteristics and features of investment markets.
Limitations of Matching Calculations
It is important to note that matching calculations have two key limitations:
∙ A matching framework does not imply the adequacy of assets to meet liabilities at all times unless the investment strategy provides a perfect match.
∙ Often there are no assets that replicate the liability cash flows exactly. In such circumstances, where matching calculations develop an appropriate proxy discount rate that is market consistent, it is appropriate to highlight:
○ the subjectivities involved,
○ the assumption that if a portfolio closely replicates the liability cash flows its price will be close to the price of the exactly replicating theoretical portfolio, and
○ the impact of the resulting potential volatility in the calculated results.
Budgeting Calculations
The family of budgeting calculations covers those where the measurement of the liability is approached from the viewpoint of how the liability is going to be financed. The discount rate used in such calculations is often chosen relative to the expected returns from a particular investment strategy. The discount rate therefore usually retains a much larger element of embedded risk, for example, incorporating credit for equity risk premium or some proportion of credit spread. As a result, if circumstances are adverse, relative to the assumptions, the calculated financing cost might appear (and actually prove to be) inadequate. Such calculations generally arise where a long term series of future cash flows needs to be met and resources are accumulated to pay for them. Budgeting calculations do not necessarily provide a value assessment at a particular point in time and are not generally associated with a specific, commercial transaction.
If should be noted that the increased embedded risk (typically) in budgeting calculations puts a greater onus on actuaries to communicate the risks and the implications of adopting a budgeting calculation approach.
In determining the appropriate degree of risk to adopt, a distinction may be drawn between future cash flows that are already determined and future cash flows to which the provider is not yet committed (e.g. linked to some future discretionary practice that may, in turn, be linked to future investment returns).
Limitations of Budgeting Calculations
It is important to note that budgeting calculations have two key limitations:
∙ A budgeting calculation provides no information about the adequacy of assets in the matching framework (either currently or in the future).
∙ A budgeting calculation provides no information on the transactional value of the future cash flows.
When is each calculation type appropriate?
Actuarial calculations that require discount rates to be determined for placing values on cash flows include:
a) Solvency – where the purpose is to assess the assets that might be required to meet the liability cash flows in the absence of any other supporting financial entity.
b) Transactions – where the purpose is to assess a (fair) value of assets to be transacted in exchange for the liability cash flows.
c) Funding – where the purpose is to advise on the accumulation of assets to meet the liability cash flows as they fall due, when the likely sufficiency of the assets to meet the future cash flows (e.g. following the failure of any supporting financial entity) at any point in the interim can be ignored.
The matching framework will generally be more suitable for type ‘a)’ and type ‘b)’ calculations, whereas a budgeting framework may be more suitable for type ‘c)’ calculations.
The IFoA made an important recommendation that when the discount rate framework is being applied it would be good practice, where appropriate, for any material divergence between the values placed on contractual asset or liability cash flows and their corresponding market or market consistent values to be highlighted in actuarial work and analysis, together with an explanation of the main contributors to this divergence. This will aid transparency of actuaries’ work.
Appendix 2: Example of Proposed Funding Approach
Example scheme:
∙ Scheme with £100 m of assets and roughly 60% non-pensioner and 40% pensioner liabilities.
∙ Duration of scheme is 15 years.
Step 1: Setting funding objective
∙ Trustees agree to run the pension scheme on a going concern basis with ongoing reliance on the employer covenant.
Step 2: Employer covenant analysis
∙ The employer has £500 m of net assets on the balance sheet and the trustees have assessed the employer covenant to be strong, that is equivalent to CG1 using TPR’s covenant grading system.
Step 3: Investment strategy
∙ The scheme’s current investment strategy is to invest in 50% return seeking and 50% matching assets with no current intention to de-risk the investment strategy (Figure 14).

Figure 14 Scheme specific distribution of annualised investment return above gilts over the next 15 years.
∙ The long-term expected returns (and their likelihood) is then modelled with the following results.
∙ The best estimate return (i.e. 50% likelihood) from this model is gilts plus 2.2% per annum and as there is current intention to de-risk the investment strategy, this single rate applies for the lifetime of the scheme.
∙ For this simple example it is assumed that a single equivalent interest rate is calculated (1.9% per annum) to represent the full gilt yield curve. Also the model in this example looks at expected investment returns versus gilts, but it might just as easily be based on expected absolute returns.
Step 4: Funding strategy
∙ Discount rate now derived from investment strategy and the covenant strength as follows:
Strong (CG1) covenant → 60% likelihood
60% likelihood → gilts plus 1.8% per annum
∙ This therefore implies the single [prudent] discount rate of 3.7% per annum
∙ The best estimate return for the recovery plan is similarly calculated as 4.1% per annum.
Step 5: Valuation calculations
∙ Initial results calculated as follows:

∙ Implied level of self-investment of £102.4 m.
∙ Best estimate assumptions (including an expected return on assets of 4.1% per annum) used to calculate possible recovery plan contributions:

Step 6: Valuation questions to address
∙ What is the security of members’ benefits? Are the trustees happy with this?
∙ What is affordable to the employer?
∙ Does the employer want to aim for a more prudent funding target or pay off the deficit quicker than implied by the valuation?
∙ It is assumed that the trustees and employer agree that an annual contribution of £6.0 m is affordable giving a recovery plan of 4 years and 7 months.
∙ The expected funding position in 5 years’ time is:

∙ Implied self-investment at end of recovery period is £64.8 million.
Step 7: Test robustness of resulting strategy
∙ Considering the variance in the possible outcomes at the end of the recovery period, for example (Figure 15):

Figure 15 Scheme specific distribution of annualised investment return above gilts over the next 5 years.
∙ Based on this model there is a 10% chance that returns will be 3% per annum below gilts over the next 5 years, giving a projected funding position as follows:

∙ This implies that based on the current investment and funding strategy there is a 1 in 10 chance that the deficit will increase by £7.4 m over the 5-year period and the implied self-investment will move to £99.2 million, despite the employer contributing £6.0 m a year to the position.
∙ Is this downside risk acceptable to the trustees?
∙ Can the employer support this level of investment and pension risk – both to balance sheet and likely future contributions?
∙ If there is a possibility that the employer might decline in strength in the future should a funding objective with a reduced reliance on the employer covenant be considered?
∙ Should the trustees consider and plan for future changes in the investment strategy and reflect these in the valuation?
∙ What is the longer-term outlook for the employer and the pension scheme? Does this need to be reflected in the valuation?
Step 8: Documentation
∙ Produce simple IRM statement highlighting:
○ Employer covenant analysis;
○ Investment strategy, both current and future; together with brief analysis of ability of employer to support level of investment risk;
○ Funding objective and derivation of discount rate assumptions from investment strategy and employer covenant analysis;
○ Policy on implied self-investment
○ Summary and justification of recovery plan based on affordability analysis.
∙ Member communication to focus on security of their benefits highlighting reliance on employer covenant and implied self-investment.


 Open access