


1. Introduction
Vortex induced vibrations (VIV) are a common phenomenon when structures are immersed in flowing media. Implications may be destructive for pipelines in ocean engineering applications or electricity power lines in the atmospheric boundary layer (Blevins Reference Blevins1977; Naudascher & Rockwell Reference Naudascher and Rockwell2012). Alternatively, VIV may be harnessed for green energy applications (Bernitsas et al. Reference Bernitsas, Raghavan, Ben-Simon and Garcia2008). In recent decades, VIV of bluff bodies such as cylinders and spheres have been studied extensively. However, compared with VIV of elastically mounted cylinders (Bearman Reference Bearman1984; Williamson & Govardhan Reference Williamson and Govardhan2004), relatively little work has been done on tethered spheres. Moreover, most published research has focused on sphere dynamics and relatively little is known about the details of the three-dimensional (3-D) flow field. The latter information is essential to improve our understanding of VIV which is characterised by intricate coupling between structural and flow dynamics.
Since VIV are preceded by stationary structural conditions, it is of interest to first review the wake flow behind stationary spheres immersed in uniform flow. In this case, the governing non-dimensional parameter is the Reynolds number,  $Re = U_\infty D/\nu$, where
  $U_\infty$ denotes the characteristic fluid velocity at the sphere position,
  $D$ denotes the sphere diameter and
  $\nu$ the kinematic fluid viscosity. The study of the flow in the wake of spheres has a long history. In early days, most efforts were focused on measuring the drag force exerted on a sphere exposed to a uniform flow at high Reynolds numbers (e.g. Möller Reference Möller1938; Achenbach Reference Achenbach1974). However, due to the inherent three-dimensionality of the flow and technological limitations, the exact details of vortex shedding in the wake of the sphere remained a subject of discussion. Until approximately two decades ago, the only instantaneous information on the 3-D flow structure in the wake of a sphere was based on dye or smoke visualisations (e.g. Magarvey & Bishop Reference Magarvey and Bishop1961; Leweke et al. Reference Leweke, Provansal, Ormieres and Lebescond1999). The emerging picture from these studies was that, beyond the critical Reynolds number for unsteady vortex shedding (
 $Re \approx 270$), a train of interconnected, one-sided hairpin vortices was shed. As
  $Re$ was increased, these large-scale vortices became increasingly fragmented and beyond
  $Re \approx 800$, the vortex shedding frequency bifurcated into two branches (Sakamoto & Haniu Reference Sakamoto and Haniu1990); a low frequency branch associated with the large-scale structures and a high frequency branch associated with the small-scale structures that were the result of shear layer instabilities. The paradigm of a shed sequence of one-sided hairpin vortices was questioned by the direct numerical simulations (DNS) performed by Johnson & Patel (Reference Johnson and Patel1999). Their simulations showed that, in contrast to the visualisations, so-called ‘induced’ hairpin vortices were shed in addition to the train of primary hairpin vortices observed in the visualisations. These induced vortices were periodically generated with their ‘heads’ pointing in the opposite direction from those of the shed primary hairpin vortices. The appearance of these induced vortices has only recently been experimentally validated by Eshbal et al. (Reference Eshbal, Rinsky, David, Greenblatt and van Hout2019b), who showed that they were the result of a rearrangement of generated vorticity by the action of the primary vortices.
The first exploratory results that showed that, much like elastically mounted cylinders (Bearman Reference Bearman1984; Sarpkaya Reference Sarpkaya2004; Williamson & Govardhan Reference Williamson and Govardhan2004), tethered spheres also undergo VIV, were published by Govardhan & Williamson (Reference Govardhan and Williamson1997). In the case of a tethered sphere undergoing VIV, besides  $Re$, several other non-dimensional parameters are important such as (i) the reduced velocity,
  $U^{*} = U_\infty /(f_ND)$, where
  $f_N$ denotes the tethered sphere's natural frequency; (ii) the mass ratio,
  $m^{*}\equiv m/m_f$, defined as the ratio between the structural mass,
  $m$, and the displaced fluid mass,
  $m_f$; (iii) the normalised tether length,
  $L^{*}\equiv L/D$, defined as the ratio between the tether length,
  $L$, and the sphere diameter; and (iv) the damping factor,
  $\zeta$.
In this work, we are especially interested in the range of  $U^{*} (2 < U^{*} < 7)$ around which the onset of VIV of a tethered sphere occurs
  $(U^{*} \approx 4)$. As the sphere starts to oscillate, different oscillation modes have been identified with increasing reduced velocity. Of particular interest to this research are the periodic modes I and II at relatively low
  $U^{*}$ that are both associated with classic ‘lock-in’ of the sphere vortex shedding frequency with
  $f_N$ (Jauvtis, Govardhan & Williamson Reference Jauvtis, Govardhan and Williamson2001). Note that the transition between modes I and II is associated with a changing vortex phase,
  $\phi _v$, defined as the phase difference between the vortex force and the transverse sphere displacement, and a jump in the total phase,
  $\phi _t$, defined as the phase difference between the total transverse force and the transverse sphere displacement (Govardhan & Williamson Reference Govardhan and Williamson2005). These phase changes point at the close coupling between sphere displacement and vortex shedding. The highest transverse oscillation amplitudes (of the order of
  $D$) are obtained in mode II.
Planar particle image velocimetry (PIV) measurements by Govardhan & Williamson (Reference Govardhan and Williamson2005) showed that, in the ‘lock-in’ region (modes I and II), transverse fluid forcing on the sphere was the result of a train of alternately shed hairpin vortices exhibiting a symmetry plane perpendicular to gravity. These hairpin vortices expelled fluid in alternating transverse directions and in accordance with Newton's third law, the fluid applied a reaction force (so-called vortex force) of equal but opposite sign on the sphere, much like wing tip vortices behind airplanes (Govardhan & Williamson Reference Govardhan and Williamson2005). More recent studies, using (high-speed) planar PIV and tomographic PIV (tomo-PIV) have further confirmed this mechanism (van Hout, Krakovich & Gottlieb Reference van Hout, Krakovich and Gottlieb2010; Eshbal, Krakovich & van Hout Reference Eshbal, Krakovich and van Hout2012; van Hout, Katz & Greenblatt Reference van Hout, Katz and Greenblatt2013b; Krakovich, Eshbal & van Hout Reference Krakovich, Eshbal and van Hout2013; Sareen et al. Reference Sareen, Zhao, Sheridan, Hourigan and Thompson2018; Eshbal et al. Reference Eshbal, Kovalev, Rinsky, Greenblatt and van Hout2019a). Depending on the system properties, such as  $f_N$,
  $D$ and
  $U_\infty$,
  $Re$ can be relatively small and lie in the range
  $200 < Re < 800$. Therefore, prior to the onset of VIV
  $(U^{*} < 4)$, the tethered sphere's wake is expected to be characterised by periodically shed hairpins having the same orientation and a single plane of symmetry as in the case of a stationary sphere (Johnson & Patel Reference Johnson and Patel1999; Eshbal et al. Reference Eshbal, Rinsky, David, Greenblatt and van Hout2019b). Since no net forces perpendicular to the plane of symmetry are exerted on the sphere, it remains stationary, and the onset of VIV (at
  $U^{*} \approx 4$) must be the result of symmetry breaking. Recently, there has been interest in symmetry breaking of wakes behind bluff bodies. Chrust, Goujon-Durand & Wesfreid (Reference Chrust, Goujon-Durand and Wesfreid2013) found that, for a fixed sphere, the critical
  $Re$ above which the flow loses planar symmetry was approximately
  $Re \approx 375$, in good agreement with numerical results by Mittal (Reference Mittal1999). The loss of planar symmetry at these low
  $Re$ is accompanied by small-scale variations in the azimuthal angle of vortex formation. Szaltys et al. (Reference Szaltys, Chrust, Przadka, Goujon-Durand, Tuckerman and Wesfreid2011) experimentally studied the nonlinear evolution of instabilities behind fixed spheres and disks through a modal decomposition of the streamwise vorticity for
  $Re$ up to 450 (sphere) and 500 (for the disk). They showed that, for the sphere, axisymmetry was lost at
  $Re = 212$, and the onset of time dependence occurred at
  $Re = 268$, i.e. close to the well-accepted value of
  $Re \approx 270$. Grandemange, Cadot & Gohlke (Reference Grandemange, Cadot and Gohlke2012) reported on reflectional symmetry breaking of a laminar 3-D wake which persisted even at large
  $Re$ and led to a bistable turbulent wake. In a subsequent study, Grandemange, Gohlke & Cadot (Reference Grandemange, Gohlke and Cadot2014) showed that, even when the instantaneous velocity deficit centroid of the turbulent sphere wake tended to be off the symmetry axis, in the absence of azimuthal disturbances, statistically all possible azimuths were equally explored. Upon introducing azimuthal disturbances, the wake ‘selected’ one or several preferred orientations. In the case of a tethered sphere, symmetry breaking is expected to lead to small fluctuating forces acting on the sphere that through mutual reinforcement between sphere displacement and vortex shedding will lead to VIV.
Relatively few numerical simulations have been performed on VIV of spheres having multiple degrees of freedom. Unlike experiments, an advantage of numerical simulations is that  $Re$ and
  $U^{*}$ can be independently fixed. Numerical simulations at different, fixed
  $Re$ were performed by Rajamuni, Thompson & Hourigan (Reference Rajamuni, Thompson and Hourigan2018, Reference Rajamuni, Thompson and Hourigan2020). Increasing
  $Re$ widened the synchronisation (lock-in) region and increased the transverse response amplitude (up to
  $Re = 2000$). However, the topology of the wake structure remained the same as that measured at much higher Reynolds numbers (Govardhan & Williamson Reference Govardhan and Williamson2005). Behara, Borazjani & Sotiropoulos (Reference Behara, Borazjani and Sotiropoulos2011) and Behara & Sotiropoulos (Reference Behara and Sotiropoulos2016) solved the unsteady, incompressible Navier–Stokes equations for the flow coupled with the Lagrangian sphere motion equations using an immersed boundary approach for an elastically mounted sphere having three linear degrees of freedom (no rotation). Note that this allowed full 3-D movement, unlike a tethered sphere whose motion is restricted to a 2-D spherical surface. Behara et al. (Reference Behara, Borazjani and Sotiropoulos2011) kept
  $Re (= 300)$ fixed and showed that, for a heavy sphere (
 $m^{*} = 2$), two distinct transverse response modes, a hairpin and a spiral mode, were observed in the range
  $4 < U^{*} < 9$. In the hairpin mode, the sphere moved along a linear transverse path while in the spiral mode, it moved along a circular path. ‘Lock-in’ regimes extended to larger
  $U^{*}$ ranges in the spiral mode (Behara & Sotiropoulos Reference Behara and Sotiropoulos2016). Wake modes and associated sphere trajectories strongly depended on
  $Re$ with spiral vortices being shed up to
  $Re \approx 500$ transitioning to hairpin vortex shedding in the range
  $500 < Re < 600$. For
  $Re > 600$, sphere oscillation became non-stationary.
Lee, Hourigan & Thompson (Reference Lee, Hourigan and Thompson2013) and Rajamuni et al. (Reference Rajamuni, Thompson and Hourigan2020) performed numerical simulations of VIV of a neutrally buoyant ( $m^{*} = 1$), and a light (
 $m^{*} = 0.8$) tethered sphere, respectively. Lee et al. (Reference Lee, Hourigan and Thompson2013) covered a
  $Re$ range of
  $50 \leq Re \leq 800$, corresponding to a narrow range of reduced velocities,
  $34 \leq U^{*} \leq 44$, while Rajamuni et al. (Reference Rajamuni, Thompson and Hourigan2020) fixed
  $Re (= 500$, 1200 and 2000) while changing the reduced velocity
  $(3 \leq U^{*} \leq 32)$. Results of Lee et al. (Reference Lee, Hourigan and Thompson2013) indicated that axisymmetry of the sphere wake was lost at
  $Re \approx 210$ and a two-threaded steady wake was observed in agreement with results for a stationary sphere (Johnson & Patel Reference Johnson and Patel1999). They further showed that the sphere started to vibrate at
  $Re \approx 270$, i.e. at the same critical
  $Re$ as for a stationary sphere, indicating that the ability of the sphere to move did not affect the onset of unsteadiness. At
  $Re \approx 280$, planar symmetry was broken and vibration shifted to the azimuthal direction. In total, they defined seven different regimes spanning a wide
  $Re$ range,
  $50 \leq Re \leq 12\ 000$, where the high
  $Re$ regimes were based on experimental sphere tracking experiments. Rajamuni et al. (Reference Rajamuni, Thompson and Hourigan2020) found that increasing
  $Re$ increased the transverse amplitude response, especially for mode II.
All of the above discussed studies have been performed under steady upstream flow conditions, and an important question that has not been answered is ‘what is the chain of events leading to VIV of a tethered sphere?’ In addition, except for the tomo-PIV measurements by Eshbal et al. (Reference Eshbal, Kovalev, Rinsky, Greenblatt and van Hout2019a), no experimental information is available on the instantaneous, 3-D flow field in the wake of a tethered sphere. The goal of the present study is to simultaneously track the motion of a heavy, tethered sphere as well as the sphere wake's dynamic flow topology (i) before and after the onset of VIV under steady upstream flow conditions, and (ii) under transient upstream flow conditions while crossing the onset of VIV. These measurements provide much needed insight into the changes that the wake undergoes as VIV are initiated as well as on the associated transverse forcing on the sphere.
The transient flow conditions were imposed by stepwise changing  $U^{*}$ from 2.2 to 4.5, i.e. crossing the Hopf bifurcation. This allowed us to continuously follow any changes in the wake flow as the sphere crossed the onset of VIV. This research is part of an ongoing effort of our group to elucidate the 3-D vortex shedding in the wake of stationary spheres as well as in the wakes of tethered spheres undergoing VIV. The experimental set-up and data processing is succinctly described in § 2, results in § 3 and a summary and discussion is presented in § 4.
2. Experimental system and data processing
The present experiments were performed in a closed-loop water tunnel (cross-section  $50 \times 50$ mm
 $^{2}$), described in detail by Eshbal et al. (Reference Eshbal, Kovalev, Rinsky, Greenblatt and van Hout2019a). A stainless steel sphere (
 $D = 5.97 \pm 0.05$ mm,
  $m^{*} = 7.77 \pm 0.05$) was tethered to the top of the test section using a nylon monofilament (diameter
  $d = 70\ \mathrm {\mu }$m, tether length
  $L = 16.8 \pm 0.1$ mm, i.e.
  $L^{*} = L/D = 3.3 \pm 0.1$). The natural frequency of the tethered sphere including added mass (Govardhan & Williamson Reference Govardhan and Williamson2005) was
  $f_N=({1}/{2{\rm \pi} })\sqrt {({g}/{L})(({m^{*}-1})/({m^{*}+C_A}))} = 3.21\pm 0.02$ Hz, where
  $g$ is the gravitational acceleration, and
  $C_A = 0.5$ is the added mass coefficient for a sphere. The damping factor equalled
  $\zeta = 0.025\pm 0.003$, based on free decay measurements. Note that the present measurements were performed using a similar sphere (material and size) as that used by van Hout et al. (Reference van Hout, Krakovich and Gottlieb2010) and Eshbal et al. (Reference Eshbal, Kovalev, Rinsky, Greenblatt and van Hout2019a). However, in the present case, attachment of the tether to the upper tunnel wall was different and, together with small changes in the sphere's mass and tether length, resulted in a slightly different
  $f_N$ and damping factor. In the experiments by van Hout et al. (Reference van Hout, Krakovich and Gottlieb2010) and Eshbal et al. (Reference Eshbal, Kovalev, Rinsky, Greenblatt and van Hout2019a), the tether was attached to the upper part of the acrylic lid by passing it through a hole and keeping it in place by a piece of adhesive tape. Furthermore, van Hout et al. (Reference van Hout, Krakovich and Gottlieb2010) used a human hair as tether (
 $d = 58\ \mathrm {\mu }$m) while Eshbal et al. (Reference Eshbal, Kovalev, Rinsky, Greenblatt and van Hout2019a) used a nylon filament (
 $d = 70\ \mathrm {\mu }$m). In the current study, the tether was tied to the eye of a sewing needle that was tightly fit in the acrylic lid's hole such that the tether's attachment point was flush with the bottom of the lid. The tether was attached to the sphere by drilling a small hole into it, filling the hole with glue, and inserting the tether after which the glue was made to harden. In this way, kinks in the tether near the attachment point as well as glue protrusions from the sphere's surface were avoided. In addition, the tomo-PIV measurements reported by Eshbal et al. (Reference Eshbal, Kovalev, Rinsky, Greenblatt and van Hout2019a) focused on the ‘far wake’ of the sphere and were acquired within a volume located 4
 $D$ downstream of the sphere while in the current measurements the start of the volume of interest (VOI) was located 0.8
 $D$ downstream of the sphere centroid (when at rest). A right-handed Cartesian coordinate system with its origin at the sphere centre (when at rest) was adopted as shown in figure 1, where
  $x_i (i = 1,2,3)$ denote the streamwise and both transverse directions, respectively;
  $U_i$ denote the corresponding instantaneous flow velocities. Vectors and tensors are printed in bold typeface, and a prime, ‘
 $..^{\prime }$’, denotes the root mean square (r.m.s.) value.

Figure 1. Schematic layout of set-up (not to scale). (a) Tomo-PIV (top view), (b) sphere tracking (side view). Employed coordinate system and VOI are also indicated.
The flow field downstream of the tethered sphere was measured using a tomo-PIV system (LaVision GmbH) consisting of four CCD cameras (Imager SX 4M,  $2360\times 1776$ pixels, an Nd:YAG laser (Quantel 532 nm, max. 120 mJ at 15 Hz), laser volume optics and a water prism to reduce image distortion due to refraction (see figure 1a). The illuminated VOI was
  $50\times 50\times 16$ mm
 $^{3}$ (
 ${\rm length} \times {\rm height} \times {\rm width}$), positioned
  $0.8D$ downstream of the sphere's centroid position when at rest. The cameras were arranged in a ‘line set-up’ (Adrian & Westerweel Reference Adrian and Westerweel2011) placed at angles of
  $40^{\circ },0^{\circ },-20^{\circ }$ and
  $-40^{\circ }$ (figure 1) relative to a line perpendicular to the flow direction. Cameras were equipped with Scheimpflug adapters to ensure good focus across the field of view and lenses having a focal length of 105 mm (Nikon, MicroNikkor). An f-number (defined as the ratio between the focal length of the lens and the diameter of its clear aperture) of 22 was used to ensure focus across the depth of the VOI.
Prior to the start of the measurements, calibration was performed across the whole depth of the VOI in 9 planes spaced 2 mm apart, using a dual-plane calibration plate (LaVision, Type 22). The sphere's translational motion was tracked using a 5th CCD camera (Imager Pro 4M,  $2048 \times 2048$ pixels) that captured the sphere's centre position from the top (figure 1b), while ensuring synchronisation between sphere tracking and flow field measurements.
In the current research, several sets of tomo-PIV measurements were performed for steady upstream flow conditions at  $U^{*} = 1.9$, 3.2, 4.5 and 7.2 (
 $\pm 0.1$ in all cases) corresponding to
  $Re = 230, 383, 532$ and 850 (
 $\pm 2.5$% in all cases), respectively. In addition to steady upstream flow conditions, data were also acquired for transient upstream flow conditions by stepwise changing
  $U^{*}$ from 2.2 to 4.5 corresponding to
  $263 < Re < 532$. In total, five data sets were acquired at 15 Hz (four at steady and one at transient upstream flow conditions). Note that, in experiments, unlike numerical studies (Behara et al. Reference Behara, Borazjani and Sotiropoulos2011),
  $Re$ and
  $U^{*}$ are coupled for a given fluid–tether–sphere combination. The present range of
  $Re$ was chosen to ensure that the vortex shedding in the wake of the sphere was characterised by large-scale vortices without the break-up and fragmentation observed at higher
  $Re$ as a result of instabilities (Sakamoto & Haniu Reference Sakamoto and Haniu1990). This enables the accurate measurement (given the limited spatial and temporal measurement resolution) of the 3-D vortex shedding topology. Since increasing
  $Re$ does not strongly affect the large-scale vortex shedding topology in the synchronisation regime (Rajamuni et al. Reference Rajamuni, Thompson and Hourigan2018, Reference Rajamuni, Thompson and Hourigan2020) and the present tethered sphere's amplitude response is similar as that obtained at higher
  $Re$ (e.g. Govardhan & Williamson Reference Govardhan and Williamson2005), we are confident that our results will also be relevant at a higher Reynolds number range. For the transient case, measurements were initiated at
  $U^{*} = 2.2$ and every 3.3 s (50 frames),
  $U^{*}$ was stepwise increased by
  ${\rm \Delta} U^{*} = 0.15$ until
  $U^{*} = 4.5$ was reached at
  $t^{*} = tU_\infty /D = 718$, after which data acquisition continued until
  $t^{*} = 1442$. Note that we investigated the effect of changing the time duration between steps (within a limited range) on the sphere's amplitude response and did not detect great sensitivity to it (not shown here). In all cases, the onset of VIV occurred after reaching the final value of
  $U^{*} = 4.5$. Small differences in the rate of increase of the sphere's amplitude response were attributed to random variability between experiments. Therefore, the chosen time duration between steps was a trade-off between the observed insensitivity of the response of the sphere to this, and the amount of data that could be processed.
Data processing of the sphere tracking results (Camera V) and the tomo-PIV images (Cameras I to IV) was different. Images containing the sphere were processed by multi-step, iterative image processing similar as by van Hout et al. (Reference van Hout, Krakovich and Gottlieb2010) and described in the following. An example, cropped raw image containing the sphere is depicted in figure 2(a). The raw image was first converted to a binary image by thresholding (figure 2b). Next, small objects were filtered based on size (figure 2c) and the boundary of the sphere was detected as the first encountered ‘white’ pixel (encircled by a red circle in figure 2d) after which the remaining boundary pixels were detected (shown as the red curve in figure 2d). Based on the detected sphere boundary points, the sphere radius as well as the sphere centroid position was estimated by a least-squares fitted circle (sphere perimeter denoted by a green dash circle and its centroid by a yellow  $\times$ symbol in figure 2e). This procedure was iteratively repeated while discarding detected sphere boundary points that exceed one standard deviation of the radius estimated in the previous iteration (figure 2f). The algorithm was repeated until the coordinates of the sphere's centroid position converged to within 0.01 pixel. By applying this method, sub-pixel accuracy (
 $\pm$0.6 pixels) was achieved. Note that the accuracy of the applied procedure was verified by applying the algorithm to an exact circle as well as several circles with artificially added noise. Given the present imaging resolution of 94.1 pixels mm
 $^{-1}$, the measurement uncertainty was
  $\pm$0.001
 $D$. This data processing procedure resulted in time series of the sphere centroid position,
  $x_{i,c}(t^{*})$, where the subscript ‘
 $c$’ denotes ‘centroid’. In order to characterise the tethered sphere's streamwise and transverse amplitude response, normalised r.m.s. amplitudes based on the sphere centroid positions were determined by:
  $A^{*}_i = \sqrt {2}x^{\prime }_{i,c}/D$, for
  $i = 1, 3$.

Figure 2. Overview of the different steps in the sphere centroid detection algorithm illustrated for an instantaneous cropped image containing the sphere; (a) raw data, (b) thresholded, (c) after small ‘blob’ removal, (d) detection of first point on the sphere boundary (indicated by red circle) and all points belonging to the sphere's edge (red curve), (e) first estimate of sphere centroid (perimeter indicated by green dash circle), ( f) final result of the iterative least-squares fit procedure. The yellow  $\times$ symbol in (e) and ( f) denotes the determined sphere centroid based on the estimated sphere radius.
Data processing of the tomo-PIV images was similar to that employed by Eshbal et al. (Reference Eshbal, Rinsky, David, Greenblatt and van Hout2019b). Three-dimensional vector maps were obtained by multi-pass, 3-D cross-correlation (DaVis 8.4, LaVision GmbH) with a final interrogation volume size of  $56 \times 56 \times 56$ voxels with 75 % overlap, corresponding to a vector spacing of 0.22 mm (0.037
 $D$). Between passes, universal outlier detection based on a median filter was performed (Westerweel & Scarano Reference Westerweel and Scarano2005) while at the end of each pass, a
  $3 \times 3 \times 3$ Gaussian smoothing filter was applied. The resulting vector maps were further spatially smoothed using a quadratic regression over 15 points in each direction (Elsinga et al. Reference Elsinga, Adrian, van Oudheusden and Scarano2010) corresponding to 0.5
 $D$. This is not expected to remove any relevant large-scale flow structures in the sphere wake. Spatial velocity gradients were based on the locally fitted quadratic regression (Elsinga et al. Reference Elsinga, Adrian, van Oudheusden and Scarano2010), and the data quality was assessed by evaluating the residual of the continuity equation for an incompressible fluid,
  ${\partial U_i}/{\partial x_i} = 0$ (
 $R^{2}$ values exceeded 0.87, see also van Hout et al. Reference van Hout, Eisma, Elsinga and Westerweel2018).
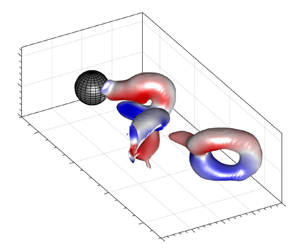
In the following, instantaneous vortices are visualised as iso-surfaces of the  $Q$-criterion (Hunt, Wray & Moin Reference Hunt, Wray and Moin1988) that defines vortices as regions where the magnitude of the rate-of-rotation exceeds that of the rate-of-strain,
 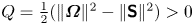 $Q = \frac {1}{2} ( \| \boldsymbol {\varOmega } \| ^{2} - \| \boldsymbol{\mathsf{S}} \| ^{2} ) > 0$. Here,
  $S_{ij} = \frac {1}{2} ({\partial U_i}/{\partial x_j} + {\partial U_j}/{\partial x_i})$ defines the rate-of-strain tensor, and
  $\varOmega _{ij} = \frac {1}{2} ({\partial U_i}/{\partial x_j} - {\partial U_j}/{\partial x_i})$ defines the rate-of-rotation tensor;
  $\| .. \|$ denotes the norm of a tensor, e.g.
  $\| \boldsymbol \varOmega \| = [tr ( \boldsymbol \varOmega \boldsymbol \varOmega ^{T} )]^{{1}/{2}}$, where
  $tr$ denotes the trace of the tensor. The iso-surfaces are overlaid by the components of the normalised vorticity,
  $\omega _i^{*} = \omega _iD/U_\infty$, where
  $\omega _i = {\partial U_k}/{\partial x_j} - {\partial U_j}/{\partial x_k}$ (
 $i,j,k$ are dummy indices).
3. Sphere and wake dynamics: steady conditions
The normalised streamwise and transverse r.m.s. amplitudes,  $A^{*}_i (i=1,3)$, of the tethered sphere under steady upstream flow conditions are plotted in figure 3 in the range
  $0 < U^{*} < 16$, together with relevant literature data for heavy tethered spheres. Note that differences in the transverse amplitude response reported in prior work of our group (van Hout et al. Reference van Hout, Krakovich and Gottlieb2010; Krakovich et al. Reference Krakovich, Eshbal and van Hout2013; Eshbal et al. Reference Eshbal, Kovalev, Rinsky, Greenblatt and van Hout2019a) for a stainless steel sphere with similar
  $m^{*}$ and
  $L^{*}$ are mainly due to different values of
  $\zeta$ that changed as a result of the way the tether was attached to the upper channel wall (see § 2). As discussed by Govardhan & Williamson (Reference Govardhan and Williamson2005), increasing the mass-damping parameter,
  $(m^{*} + C_A)\zeta$, beyond 0.02 narrows the width of the lock-in region (modes I and II) and reduces the peak response value of
  $A^{*}_3$ below its saturation value of 0.9. For example, when
  $(m^{*} + C_A)\zeta = 0.428$ (Eshbal et al. Reference Eshbal, Kovalev, Rinsky, Greenblatt and van Hout2019a) the normalised transverse r.m.s. amplitude did not exceed
  $A^{*}_3 = 0.35$ (at
  $U^{*} = 5.5$), while for
  $(m^{*} + C_A)\zeta = 0.167$ (Krakovich et al. Reference Krakovich, Eshbal and van Hout2013),
  $A^{*}_3$ reached 0.55 at
  $U^{*} \approx 8$ (mode II). In the present measurements,
  $\zeta$ was slightly larger than in Krakovich et al. (Reference Krakovich, Eshbal and van Hout2013), which narrowed the synchronisation region (see figure 3). Note that the peak amplitude response corresponds well to those in the Griffin plot (
 $A^{*}_3$ vs
  $(m^{*} + C_A)\zeta$) reported by Govardhan & Williamson (Reference Govardhan and Williamson2005).

Figure 3. Normalised transverse amplitude as a function of the reduced velocity. Present data:  $m^{*} = 7.77, (m^{*}+C_A)\zeta = 0.207: i = 3$ (
 $\diamond$ – red, and 1 (
 $\unicode{x29EB}$ – red); Literature data (
 $i = 3$):
  $\square$ – blue (Eshbal et al. Reference Eshbal, Kovalev, Rinsky, Greenblatt and van Hout2019a)
  $m^{*} = 7.77, (m^{*}+C_A)\zeta = 0.428$,
  $\circ$ (Krakovich et al. Reference Krakovich, Eshbal and van Hout2013)
  $m^{*} = 7.87, (m^{*}+C_A)\zeta = 0.167, \times$ (Govardhan & Williamson Reference Govardhan and Williamson2005)
  $m^{*} = 2.8, (m^{*}+C_A)\zeta = 0.029$. Vertical bars denote extreme values.
In addition to  $A_3^{*}$, the normalised streamwise r.m.s. amplitude,
  $A_1^{*}$, is also plotted in figure 3 for the present measurements. As expected for a heavy tethered sphere, values of
  $A_1^{*}$ remain low and do not exceed
  $A_1^{*} = 0.06$ (at
  $U^{*} = 4.5$). Here, we are interested in the changing vortex shedding as the sphere crosses the onset of VIV, and we will focus on
  $U^{*} = 1.9$, 3.2, 4.5 and 7.2 in §§ 3.1 and 3.2.
3.1. Prior to the onset of VIV:  $U^{*} = \textit{1.9}$ and 3.2

The tracked streamwise and transverse sphere centroid positions, associated power spectra and phase diagrams depicting the sphere centroid positions in the  $x_1$–
 $x_3$ plane, are shown in figure 4. It is interesting to see that, in both cases (
 $U^{*} = 1.9$ and 3.2), the sphere is not completely stationary (figure 4a,d,f,i), and, although displacements are small (up to
  $|0.01D|$), for
  $U^{*} = 3.2$ (figure 4f–j) the power spectrum based on the time series of
  $x_{1,c}$ (figure 4j) displays a small but distinct peak at
  $f_s/f_N = 0.94$, where
  $f_s$ denotes the sphere oscillation frequency. This indicates that, at
  $U^{*} = 3.2 (Re = 383)$, sphere oscillations in the streamwise direction ‘lock-in’ to the natural frequency. Note that in the transverse direction, the power spectrum (figure 4h) shows only a very small peak (pointed at by the arrow in figure 4h) almost indistinct from the noise level. For
  $U^{*} = 1.9$, the power spectra (figure 4c,e) do not indicate any peaks that rise above the noise level.

Figure 4. VIV response of the tethered sphere under steady upstream flow conditions at  $U^{*} = 1.9$ (a–e) and
  $U^{*} = 3.2$ (f–j). (a,d, f,i) Examples of normalised sphere centroid positions for
  $0 < t^{*} < 15$: (a, f)
  $x_{3,c}/D$ and (d,i)
  $x_{1,c}/D$; (c,e,h,j) associated power spectra; (b,g) phase diagrams of sphere centroids in the
  $x_1$–
 $x_3$ plane for
  $U^{*} =$ (b) 1.9 and (g) 3.2.
In order to investigate the generated vortices in the wake of the tethered sphere prior to the onset of VIV, the 3-D vortex shedding measured at  $U^{*} = 1.9 (Re = 230)$ and
  $3.2 (Re = 383)$ under steady upstream flow conditions is presented in figures 5 and 6 (see also associated supplementary movies ‘Fig 5.mp4’ and ‘Fig 6.mp4’). These figures depict sequences of snapshots of the vortices in the wake of the tethered sphere as visualised by iso-surfaces of the
  $Q$-criterion overlaid by the normalised streamwise and transverse vorticity components. Focusing first on the vortices in the wake of the sphere at
  $U^{*} = 1.9 (Re = 230$, figure 5), unsteady vortex shedding is observed. This was unexpected at such a low
  $Re$ and differs from that reported for a fixed sphere immersed in a steady uniform flow (Johnson & Patel Reference Johnson and Patel1999; Szaltys et al. Reference Szaltys, Chrust, Przadka, Goujon-Durand, Tuckerman and Wesfreid2011) as well as for a neutrally buoyant tethered sphere (DNS, Lee et al. Reference Lee, Hourigan and Thompson2013). For a fixed sphere, it has been reported that wake axisymmetry is lost at
  $Re \approx 210$ and a ‘double-threaded’ steady wake (Magarvey & MacLatchy Reference Magarvey and MacLatchy1965; Johnson & Patel Reference Johnson and Patel1999; Ormières & Provansal Reference Ormières and Provansal1999; Tomboulides & Orszag Reference Tomboulides and Orszag2000; Szaltys et al. Reference Szaltys, Chrust, Przadka, Goujon-Durand, Tuckerman and Wesfreid2011) appears up to
  $Re \approx 270$, beyond which unsteady vortex shedding in the form of hairpins occurs. We surmise that, for the present case, the observed unsteadiness is due to the use of a tether that allows constraint sphere movement. Even small disturbances in the upstream flow induce small sphere movements (see figure 4a,d, f,i) that introduce azimuthal disturbances close to the point where the tether is attached to the sphere and the boundary layer separates. As a result, we surmise that the double-threaded wake becomes unstable and develops into unsteady vortex shedding at a lower
  $Re$ than for a fixed sphere. This mechanism also ensures that the generated primary hairpin vortices are shed with their ‘heads’ pointing upwards in the direction of the tether (see figure 5e). Note that time-resolved, planar PIV measurements performed by David et al. (Reference David, Eshbal, Rinsky and van Hout2020) on a fixed smooth sphere at
  $Re = 226$ in the same facility did not exhibit unsteady vortex shedding, strengthening our point that the tethered sphere's ability to move is crucial. In the present measurements at
  $U^{*} = 1.9$, the ratio between the vortex shedding frequency,
  $f_v$ (determined directly from the sequence of snapshots), and
  $f_N$ equalled
  $f_v/f_N = 0.29$. This value is far from lock-in, which explains the lack of a distinct peak in the power spectra based on
  $x_{i,c}$ (figure 4c,e).

Figure 5. Sequence of snapshots (at one third of the actual temporal resolution,  ${\rm \Delta} t^{*} = 1.24$) of the instantaneous vortex structure visualised by iso-surfaces of the
  $Q$-criterion overlaid by
  $\omega _1^{*}$ (a–d) and
  $\omega _3^{*}$ (e, f). Here,
  $U^{*} = 1.9, Re = 230$. Link to supplementary movie ‘Fig 5.mp4’ is available at https://doi.org/10.1017/jfm.2022.428. Arrow next to
  $g$ denotes direction of gravity.

Figure 6. Sequence of snapshots (at half the actual temporal resolution,  ${\rm \Delta} t^{*} = 1.38$) of the instantaneous vortex structure visualised by iso-surfaces of the
  $Q$-criterion overlaid by
  $\omega _3^{*}$ (a,b) and
  $\omega _1^{*}$ (c–f). Here,
  $U^{*} = 3.2, Re = 383$. Link to supplementary movie ‘Fig 6.mp4’ available at https://doi.org/10.1017/jfm.2022.428. Insets in (a) and (d) depict side views of the primary hairpins. Arrow next to
  $g$ denotes direction of gravity.
For both reduced velocities ( $U^{*} = 1.9$ and 3.2 in figures 5 and 6, respectively), ‘primary’ hairpin vortices are shed with their ‘heads’ rotating in the clockwise direction (
 $\omega _3^{*} < 0$, figures 5e, fand 6a,b). The induced flow field due to the rotation of the hairpin legs causes the hairpins to ‘lift up’. This is especially clear at
  $U^{*} = 3.2$ (figure 6) where the primary hairpin inclination angles measured from the horizontal, increase with increasing
  $x_1/D$ from approximately 40
 $^{\circ }$ to 73
 $^{\circ }$ (see insets in figure 6a,d). Further downstream the hairpins are expected to develop into vortex rings (Eshbal et al. Reference Eshbal, Kovalev, Rinsky, Greenblatt and van Hout2019a). Note that, for
  $U^{*} = 1.9$ (figure 5), the arches spanning the transverse gap between the hairpin legs are weak and are not always observed in the
  $Q$-criterion iso-surfaces. However, contour plots of
  $\omega _3$ in equatorial (
 $x_1$–
 $x_2$) planes (not shown) showed clear vorticity ‘blobs’ (
 $\omega _3^{*} < 0$) at the location of the presumed hairpin heads at all stages of vortex shedding.
For  $U^{*} = 3.2$ (
 $Re = 383$, figure 6), ‘primary’ hairpin vortices were periodically shed at
  $f_v/f_N = 0.5$, i.e. closer to ‘lock-in’ (see power spectra in figure 4h,j). In contrast to
  $U^{*} = 1.9$, as the primary hairpins move downstream, the legs of secondary (or ‘induced’) vortices of opposite sign appear at
  $x_1/D \approx 3$ (see also Johnson & Patel Reference Johnson and Patel1999; Eshbal et al. Reference Eshbal, Rinsky, David, Greenblatt and van Hout2019b). Note that, within the current extent of the VOI, they do not become fully developed hairpins. However, generation of the induced vortices doubles the vortex shedding frequency such that
  $f_v/f_N \approx 1$, in agreement with the frequency peak observed in the power spectrum associated with
  $x_{1,c}(t)$ (figure 4j). Furthermore, as the symmetry plane of the shed vortices is parallel to gravity, little forcing is expected to be imposed in the
  $x_3$-direction, explaining the lack of a distinct frequency peak in the power spectrum of
  $x_{3,c}(t)$ (figure 4h).
To obtain more insight into the vortex shedding dynamics, the instantaneous centroid position of the velocity deficit,  $x_{i,c}^{d} (i = 2,3)$, in a transverse plane downstream of the sphere (figure 7a) was determined by (Grandemange et al. Reference Grandemange, Gohlke and Cadot2014)
 \begin{equation} x_{i,c}^{d}/D = \frac{\displaystyle\iint_A\frac{x_i}{D}\left(1- \frac{U_1}{U_\infty}\right)\, {\rm d}{A}}{\displaystyle \iint_A\left(1- \frac{U_1}{U_\infty}\right)\, {\rm d}{A}},\end{equation}
for  $i = 2,3$, where the superscript ‘
 $d$’ denotes ‘associated with the velocity deficit’. Here,
  $A$ is the integration domain (limited to
  $U_1/U_\infty < 0.5$) in the
  $x_2$–
 $x_3$ plane. The centroid positions of the velocity deficit relative to the (non-oscillating) sphere centre were characterised by their radial positions,
  $\rho ^{d}$, and in-plane angles,
  $\theta ^{d}$ (measured clockwise from the horizontal), as illustrated in figure 7(a).

Figure 7. Definition of the angles and distances in a transverse plane at  $x_1/D = 2$ associated with (a) the centroid position of the velocity deficit and (b) the orientation of the shed vortices. The dashed circle denotes the perimeter of the tethered sphere. The direction of the vector associated with
  $F_v$ in (b) denotes the vortex force exerted on the fluid in the
  $x_3$-direction. Centroids are denoted by
  $\bigoplus$.
In addition to  $x_{i,c}^{d}/D$, changes in the orientation of the shed hairpins’ symmetry plane are important to understand the onset of VIV (see also Chrust et al. Reference Chrust, Goujon-Durand and Wesfreid2013). This was studied here by determining the instantaneous relative position of the longitudinal, counter-rotating vortex ‘legs’ as they crossed the transverse plane at
  $x_1/D = 2$. An example contour plot showing two ‘blobs’ of opposite sign
  $\omega _1^{*}$ associated with the longitudinal vortices, is depicted in figure 7(b). Their relative position was defined by the angle,
  $\theta ^{v}$, and the distance between the centroids,
  $\rho ^{v}$ (see figure 7b), where the superscript ‘
 $v$’ denotes ‘associated with the vortex legs’. The uncertainty of
  $\rho ^{v}$ was estimated as
  $\pm 0.04D$, i.e. twice the uncertainty associated with the ‘blobs’ centroid positions. Note that
  $\theta ^{v}$ was measured from the negative vorticity blob to the positive one (figure 7b), and as a result,
  $\theta ^{v} = 0^{\circ }$ corresponds to a symmetry plane parallel to gravity, whereas
  $\theta ^{v} = \pm 90^{\circ }$ corresponds to one perpendicular to gravity.
Results for ( $\theta ^{d}$,
  $\rho ^{d}/D$) and (
 $\theta ^{v}$,
  $\rho ^{v}/D$) are plotted in figure 8 for
  $U^{*} = 1.9$ and 3.2. For both
  $U^{*}$,
  $\theta ^{d}$ (figure 8a) and
  $\rho ^{d}/D$ (figure 8b) oscillate at the primary vortex shedding frequency. Oscillation amplitudes increase with increasing
  $U^{*}$. The oscillations of
  $\theta ^{d}$ indicate that the instantaneous wake (as characterised by the velocity deficit) exhibits small transverse deviations that increase with increasing
  $U^{*}$ just prior to the onset of VIV.

Figure 8. Instantaneous centroid positions of the velocity deficit (a,b) and the orientations and separation distances of the shed vortices (c,d) evaluated at a transverse plane located at  $x_1/D = 2.0$ (see figure 7). (a)
  $\theta ^{d}$, (b)
  $\rho ^{d}/D$, (c)
  $\theta ^{v}$, (d)
  $\rho ^{v}/D$. Here,
  $U^{*} = 1.9$ (
 $\circ$ – red), 3.2 (
 $\square$).
The orientation of the symmetry plane of the vortices crossing the transverse plane is depicted in figure 8(c). For both  $U^{*}$,
  $\theta ^{v}$ mostly fluctuate around
  $0^{\circ }$ since these represent the dominant primary hairpins crossing the transverse plane at
  $x_1/D = 2.0$. However, for
  $U^{*} = 3.2$, values of
  $\theta ^{v} = \pm 180^{\circ }$ represent induced vortices whose rotation direction is flipped. Note that, although values of
  $\theta ^{v}$ associated with
  $U^{*} = 3.2$ are more scattered around 0
 $^{\circ }$, the shed vortices’ symmetry planes are still predominantly in the direction of gravity. The distance between the legs of the shed vortices mostly fluctuates in the range
  $0.35 < \rho ^{v}/D < 1.0$ (figure 8d). Maximum values of
  $\rho ^{v}/D$ obtained just after the hairpin head crosses the transverse plane, slightly precede those of
  $\rho ^{d}/D$ (figure 8b,d), more so for
  $U^{*} = 1.9$. As the hairpin vortex crosses the plane,
  $\rho ^{v}/D$ decreases (see for example figure 6c). Further downstream, the legs unite and a vortex ring is formed (figure 6d).
3.2. Beyond the onset of VIV: $U^{*} = 4.5$ and 7.2

Transverse and streamwise sphere centroid positions as a function of  $t^{*}$, associated power spectra and phase diagrams are displayed in figure 9 for
  $U^{*} = 4.5$ (mode I) and 7.2 (mode II). Both fall within the synchronisation or ‘lock-in’ region (see figure 3) and
  $|x_{3,c}/D|$ reach approximately 0.3 and 0.4 for
  $U^{*} = 4.5$ and 7.2, respectively (figure 9a, f). Note that although the sampling frequency was sufficiently high to resolve periodicity (according to the Nyquist criterion), extreme values of
  $x_{3,c}/D$ are undersampled and fluctuate somewhat. Although streamwise oscillation amplitudes (figure 9d,i) have increased compared with those for
  $U^{*} = 1.9$ and 3.2 (figure 4d,i), they remain mostly below 0.04
 $D$, i.e. an order of magnitude lower than in the transverse direction. Sphere trajectories in the
  $x_1$–
 $x_3$ plane depicted in figures 9(b) and 9(g), follow more or less linear paths at slightly changing orientation angles. For both
  $U^{*}$, the power spectra based on the time series of
  $x_{i,c}$ (
 $i = 1$, 3, figure 9c,e,h,j) indicate strong frequency peaks close to the natural frequency (a clear sign of ‘lock-in’) with
  $f_s/f_N = 0.95$ and 0.99 for
  $U^{*} = 4.5$ and 7.2, respectively.

Figure 9. VIV response of the tethered sphere under steady upstream flow conditions at  $U^{*} = 4.5$ (a–e) and
  $U^{*} = 7.2$ ( f–j). (a,d, f,i) Examples of normalised sphere centroid positions for
  $0 < t^{*} < 15$: (a, f)
  $x_{3,c}/D$, and (d,i)
  $x_{1,c}/D$; (c,e,h,j) associated power spectra; (b,g) phase diagrams of sphere centroids in the
  $x_1$–
 $x_3$ plane for
  $U^{*} =$ (b) 4.5 and (g) 7.2.
Three-dimensional views of the vortex shedding sequence visualised by iso-surfaces of the  $Q$-criterion and overlaid by
  $\omega _1^{*}$ and
  $\omega _2^{*}$ are depicted in figures 10 and 12 for
  $U^{*} = 4.5$ and 7.2, respectively. Associated top views are depicted in figures 11 and 13. Note that, due to the limited transverse extent of the VOI, the present measurements only fully capture one side of the vortex shedding sequence. However, since vortex shedding at
  $U^{*} = 4.5$ and 7.2 is symmetric about the
  $x_1$–
 $x_2$ plane (
 $x_3/D = 0$), the shedding sequence can be analysed using one side only. In contrast to
  $U^{*} = 1.9$ and 3.2 (figures 5 and 6), vortex shedding is now characterised by hairpin vortices exhibiting a symmetry plane perpendicular to gravity. The chain of events accompanying the change in the orientation of the symmetry plane as
  $U^{*}$ is increased and VIV is initiated, is analysed and discussed in detail in § 4. The hairpin vortices provide the transverse forcing on the sphere in analogy with trailing wing tip vortices as discussed by Govardhan & Williamson (Reference Govardhan and Williamson2005) and Eshbal et al. (Reference Eshbal, Krakovich and van Hout2012) and further analysed in § 3.2.1.

Figure 10. Sequence of snapshots (at actual temporal resolution,  ${\rm \Delta} t^{*} = 0.96$) of the instantaneous vortex structure in the wake of the tethered sphere undergoing VIV,
  $U^{*} = 4.5, Re = 532$. The structures are visualised by iso-surfaces of the
  $Q$-criterion and overlaid by
  $\omega _1^{*}$ (a–d) and
  $\omega _2^{*}$ (e, f). Link to supplementary movie ‘Fig 10.mp4’ available at https://doi.org/10.1017/jfm.2022.428. Values within parentheses denote the instantaneous sphere centroid positions,
  $(x_{1,c}/D, x_{2,c}/D, x_{3,c}/D)$. Arrow next to
  $g$ denotes the direction of gravity.

Figure 11. Top view of the same sequence of snapshots depicted in figure 10.
We will first discuss the shedding and advection of the vortices in the wake of the tethered sphere for  $U^{*} = 4.5$ (figures 10 and 11, see also the associated supplementary movie ‘Fig 10.mp4’). Close to the sphere, a fully developed hairpin vortex (denoted by ‘HP1’ in figures 10 and 11) is observed as the sphere is close to its extreme transverse position (
 $x_{3,c}/D = 0.37$, figures 10a and 11a). In the next frame (figure 10b) as the sphere changes direction and moves towards the origin (
 $x_{3,c}/D = 0.28$ in figure 10b), the next hairpin vortex (denoted by ‘HP2’ in figures 10b and 11b) is generated. As HP1 is advected downstream and transitions into a vortex ring, the angle it makes with the transverse direction reduces from
  $37^{\circ } \pm 1^{\circ }$ to
  $11^{\circ } \pm 1^{\circ }$ as can be clearly observed in the top views depicted in figure 11. This changing orientation is the result of the unequal strength of the counter-rotating vortices comprising the vortex ring in the
  $x_1$–
 $x_3$ plane (at
  $x_2/D = 0$, not shown, see also Leweke, Le Dizes & Williamson Reference Leweke, Le Dizes and Williamson2016). In contrast, in the immediate proximity of the sphere, the orientation angle of HP3 increases upon shedding (figure 11e, f) as the head of HP3 is stretched due to its exposure to the fast moving incoming flow while its base is sheltered behind the sphere. The estimated advection velocity based on the tip positions of HP1 equalled 0.84
 $U_\infty$ comparing well with the values reported by Krakovich et al. (Reference Krakovich, Eshbal and van Hout2013).
As previously shown in the bifurcation diagram (figure 3),  $A^{*}_3$ was significantly higher for
  $U^{*} = 7.2$ than for
  $U^{*} = 4.5$. The sequence of 3-D plots of the instantaneous wake structure depicted in figures 12 and 13 shows how this is associated with a change in the vortex shedding pattern (see also associated supplementary movie ‘Fig 12.mp4’). While for
  $U^{*} = 4.5$, two hairpin vortices were shed per oscillation cycle (figure 10), for
  $U^{*} = 7.2$ four were shed per cycle (figure 12). The shedding sequence for
  $U^{*} = 7.2$ is started as a hairpin vortex (denoted by ‘HP4’ in figures 12a and 13a) is generated when the sphere is moving in the negative
  $x_3$-direction. As the sphere is close to its extreme position (
 $x_{3,c}/D = -0.45$ in figures 12b and 13b) and HP4 detaches from it, a small hairpin head (denoted by ‘HP5’ in figures 12b and 13b) appears and bridges between the ‘legs’ of HP4. In subsequent snapshots (figures 12c–e and 13c–e), HP5 develops into a hairpin vortex while HP4 starts to resemble a vortex ring. The top view of the sequence depicted in figure 13 reveals that the symmetry plane for HP5 as it is advected downstream does not lie in the
  $x_1$–
 $x_3$ plane in contrast to that of HP4. They appear to disconnect in figure 13(d) after which HP4 develops into a vortex ring much like HP1 (
 $U^{*} = 4.5$, figure 10). Note that, in the supplementary movie file (‘Fig 12.mp4’), an additional third hairpin vortex develops downstream of the sphere. This third vortex appears not to be associated with the actual shedding from the sphere but is rather a result of the instability of the legs of the second hairpin vortex as it develops into a vortex ring.

Figure 12. Sequence of snapshots (at actual temporal resolution,  ${\rm \Delta} t^{*} = 1.54$) of the instantaneous vortex structure in the wake of the tethered sphere undergoing VIV,
  $U^{*} = 7.2, Re = 850$. The structures are visualised by iso-surfaces of the
  $Q$-criterion overlaid by
  $\omega _1^{*}$. Link to supplementary movie ‘Fig 12.mp4’ available at https://doi.org/10.1017/jfm.2022.428. Values within parentheses denote the instantaneous sphere position,
  $(x_{1,c}/D, x_{2,c}/D, x_{3,c}/D)$. Arrow next to
  $g$ denotes the direction of gravity.

Figure 13. Top view of the same sequence of snapshots depicted in figure 12.
In the literature, few studies mention the shedding of four hairpins (or vortex rings) in the wake of a sphere. Based on dye visualisations, Horowitz & Williamson (Reference Horowitz and Williamson2010) reported four vortex rings per oscillation cycle (so-called ‘4R’ mode) in the wake of a light, freely rising sphere (zig-zag trajectory) that vibrates periodically. Interestingly, they showed that the generation of the ‘4R’ mode only occurred when streamwise body vibrations were present, similar to the case in the present measurements (see figure 9).
In addition, time-resolved PIV measurements by van Hout et al. (Reference van Hout, Krakovich and Gottlieb2010) also reported the planar ‘signatures’ of four vortices shed per oscillation cycle for a tethered sphere at similar  $U^{*}$ and
  $Re$. However, they did not measure the 3-D vortex shedding structure which remained obscure.
An interesting question is, why are the ‘double’ hairpins generated for  $U^{*} = 7.2 (Re = 850)$ and not for
  $U^{*} = 4.5 (Re = 532)$? The DNS study by Rajamuni et al. (Reference Rajamuni, Thompson and Hourigan2020) of a tethered neutrally buoyant sphere provides an indication. While keeping
  $U^{*}$ constant, they reported that multiple loops were shed per oscillation cycle when
  $Re$ was increased from 500 to 1200. Therefore, the answer must be related to the time scales associated with hairpin generation. Since in both cases,
  $f_N$ is the same, the convective flow time scale,
  $t_f = D/U_\infty$, must play an important role. The ratio between the sphere's oscillation period,
  $T_s = 1/f_s \approx 1/f_N$ (lock-in), and
  $t_f$ equals
  $T_s/t_f \approx (U_\infty f_N)/D \approx U^{*}$, i.e.
  $T_s/t_f$ increases with
  $U^{*}$ (or
  $Re$ when keeping
  $U^{*}$ constant as in Rajamuni et al. Reference Rajamuni, Thompson and Hourigan2020). This indicates that, during one transverse ‘sweep’ of the sphere, more fluid passes it with increasing
  $U^{*}$. Therefore, as long as
  $f_s \approx f_N$ (i.e. in the lock-in region), one hairpin vortex will be generated for every
  ${\rm \Delta} (T_s/t_f) \approx 3$, and additional hairpins may be generated providing
  $T_s/t_f$ is sufficiently large, i.e. a multiple of
  $\sim$3, and ‘lock-in’ (
 $f_s \approx f_N$) occurs. We will show in § 3.2.1 that the hairpins shed at
  $U^{*} = 7.2$ provide more transverse forcing on the sphere resulting in a larger transverse amplitude response.
Similar to the cases of  $U^{*} = 1.9$ and 3.2 (see § 3.1, figures 7 and 8), the instantaneous wake characteristics were analysed in transverse planes located at
  $x_1/D = 1.0$ and 3.0. Results depicting (
 $\theta ^{d}, \rho ^{d}/D$) and (
 $\theta ^{v}, \rho ^{v}/D$) are presented in the left and right columns of figure 14, respectively. In agreement with the alternately shedding of hairpin vortices having a symmetry plane perpendicular to gravity, values of
  $\theta ^{d}$ mainly switch between 0
 $^{\circ }$ and 180
 $^{\circ }$ (figure 14a) indicating that
  $x_{i,c}^{d}/D$ (3.1) is located on the equatorial
  $x_1$–
 $x_3$ plane. The distance from the origin,
  $\rho ^{d}/D$ (figure 14b), fluctuates in the range
  $0.05 < \rho ^{d}/D < 0.8$ and
  $0.05 < \rho ^{d}/D < 0.5$ for
  $U^{*} = 4.5$ and 7.2, respectively. This shows that despite the increased transverse sphere oscillation amplitude at
  $U^{*} = 7.2$, maximum values of
  $\rho ^{d}/D$ at
  $x_1/D = 1.0$ are less than those for
  $U^{*} = 4.5$ at the same transverse plane as a result of the increased advection velocity of the hairpins for
  $U^{*} = 7.2$.

Figure 14. Instantaneous centroid positions of the velocity deficit (a,b) and the orientations and separation distances of the shed vortices (c,d) evaluated at a transverse plane located at  $x_1/D = 1.0$ (a,b) and 3.0 (c,d); (a)
  $\theta ^{d}$, (b)
  $\rho ^{d}/D$, (c)
  $\theta ^{v}$, (d)
  $\rho ^{v}/D$. Here,
  $U^{*} = 4.5$ (
 $\circ$ – red), 7.2 (
 $\square$).
Values of  $\theta ^{v}$ concentrate in bands around
  $\pm 90^{\circ }$ (figure 14c), indicating that hairpin symmetry planes are perpendicular to gravity, in contrast to
  $U^{*} = 1.9$ and 3.2, where values of
  $\theta ^{v}$ concentrate around 0
 $^{\circ }$ (figure 8c). The distance between the shed hairpin legs fluctuates approximately in the range
  $0.4 < \rho ^{v}/D < 0.8$ (figure 14d) for both
  $U^{*}$ and will be used in the next section to determine the vortex force acting on the sphere. In § 4, we will further use this analysis to elucidate the chain of wake events accompanying the onset of VIV of a tethered sphere.
3.2.1. Vortex force acting on the sphere
For  $U^{*} = 4.5$ and 7.2, the tethered sphere's amplitude response is within the ‘lock-in’ region and the shed vortices (Wu, Lu & Zhuang Reference Wu, Lu and Zhuang2007) provide the transverse forcing that causes large amplitude, transverse oscillations. The force that causes the perturbation and pushes the sphere out of equilibrium is the so-called ‘vortex force’ (Lighthill Reference Lighthill1986; Govardhan & Williamson Reference Govardhan and Williamson2005; Krakovich et al. Reference Krakovich, Eshbal and van Hout2013) which can be determined from the measured flow field in analogy with wing tip vortices. For example, the legs of hairpins HP1 and HP3 (
 $U^{*} = 4.5$, figure 10), expel fluid in the negative
  $x_3$-direction and, according to Newton's third law, a reaction force (the vortex force) acts on the sphere in the positive
  $x_3$-direction. Upon shedding HP1 (figure 10a), fluid forcing in the positive
  $x_3$-direction stops and gravity reverses the direction of the sphere's motion. This leads to the generation of HP2 (figure 10b) and fluid forcing on the sphere in the negative
  $x_3$-direction as this cycle repeats itself periodically.
The expression for the vortex force coefficient is given by Govardhan & Williamson (Reference Govardhan and Williamson2005) and Krakovich et al. (Reference Krakovich, Eshbal and van Hout2013) as
 \begin{equation} C_v = \frac{F_v}{\frac{1}{2}\rho_f U_\infty^{2}A_s} = \frac{-U_v\varGamma \rho^{v}}{\frac{1}{2}U_\infty^{2}A_s}, \end{equation}
where  $\rho _f$ is the fluid density,
  $A_s$ denotes the cross-sectional area of the sphere,
  $U_v$ denotes the hairpin's advection velocity and
  $\varGamma$ is the circulation associated with the vortex legs. The normalised circulation was determined as the hairpin crossed the transverse plane at
  $x_1/D = 2.0$ (figure 7) by summing
  $\omega _1$ over the area,
  $A_v$, associated with the vortex cores of the hairpin legs (see figure 7b)
 \begin{equation} \varGamma^{*} = \frac{1}{U_\infty D}\sum_{A_v}\omega_1\, {\rm d}{A}_v. \end{equation}
 Instantaneous values of  $x_{3,c}/D$,
  $\varGamma ^{*}$,
  $\rho ^{v}/D$ and
  $C_v$ as a function of
  $t^{*}$ are plotted in figures 15 and 16 for
  $U^{*} = 4.5$ and 7.2, respectively. The time series of
  $x_{3,c}/D$ in figures 15(a) and 16(a) show the periodic oscillations of the sphere for both
  $U^{*}$ (see also figure 9). Values of
  $\rho ^{v}/D$ (figures 15c and 16c) do not drop below 0.5 and maxima reach
  $\rho ^{v}/D \approx 1$ for
  $U^{*}= 4.5$ and are slightly lower for
  $U^{*} = 7.2$. Although the data are somewhat scattered as a result of the relatively low sampling frequency as well as difficulties in detecting clear vortex cores (especially for
  $U^{*} = 7.2$), the periodic nature of the determined
  $C_v$ can be clearly observed in figures 15(d) and 16(d). Peak values of
  $C_v$ are approximately 0.2 for
  $U^{*} = 4.5$ and reach about 0.3 for
  $U^{*} = 7.2$, in agreement with the increased transverse amplitude response at this
  $U^{*}$. Note that these values correspond well to those reported by Govardhan & Williamson (Reference Govardhan and Williamson2005) and Krakovich et al. (Reference Krakovich, Eshbal and van Hout2013). Further note that peak values of
  $|C_v|$ are asymmetric about zero as a result of the limited transverse extent of the VOI (see figures 11 and 13). A comparison between
  $x_{3,c}/D(t^{*})$ (figures 15a and 16a) and
  $C_v(t^{*})$ (figures 15d and 16d) reveals that the vortex phase,
  $\phi _v$, shifts from 0
 $^{\circ }$ for
  $U^{*} = 4.5$ to
  $180^{\circ }$ for
  $U^{*} = 7.2$, i.e. in agreement with the transition from mode I to mode II for these
  $U^{*}$ (Govardhan & Williamson Reference Govardhan and Williamson2005).

Figure 15. Analysis of the instantaneous vortex force coefficient as a function of  $t^{*}$ evaluated at a transverse plane located at
  $x_1/D = 2.0, U^{*} = 4.5$; (a)
  $x_{3,c}/D$, (b)
  $\varGamma ^{*}$, (c)
  $\rho ^{v}/D$ and (d)
  $C_v$.

Figure 16. Analysis of the instantaneous vortex force coefficient as a function of  $t^{*}$ evaluated at a transverse plane located at
  $x_1/D = 2.0, U^{*} = 7.2$; (a)
  $x_{3,c}/D$, (b)
  $\varGamma ^{*}$, (c)
  $\rho ^{v}/D$ and (d)
  $C_v$.
4. Sphere and wake dynamics: transient conditions
Up to this point, the vortex shedding in the wake of a tethered, heavy sphere has been characterised under steady, uniform upstream flow conditions and the results clearly indicated that crossing the Hopf bifurcation (onset of VIV) led to a 90 $^{\circ }$ change in the orientation of the symmetry plane of the shed hairpin vortices. In order to elucidate the changes in the flow field accompanying the onset of VIV, the tethered sphere was exposed to a time-dependent uniform upstream velocity,
  $U_\infty (t)$, by stepwise increasing
  $U^{*}$ from 2.2 (
 $t^{*} = 0$) to 4.5 (
 $t^{*} = 725$) (see figure 17a). Simultaneously, the sphere's centroid position was tracked and its transverse and streamwise positions (relative to the sphere at rest) are depicted in figures 17(b) and 17(c), respectively. The vertical dash lines in figure 17 indicate the time (
 $t^{*} = 718$) at which
  $U^{*} = 4.5$ was reached and kept constant. Due to the drag force, the sphere is increasingly displaced in the streamwise direction (figure 17c) as
  $U^{*}$ is increased to 4.5. For
  $t^{*} > 1100 (U^{*} = 4.5)$, fluctuations of
  $x_{1,c}/D$ about its mean value compare well with those obtained under steady upstream flow conditions (see figure 9d). In the transverse direction, the sphere only started to oscillate shortly after reaching
  $U^{*} = 4.5$ at
  $t^{*} \approx 800$ (figure 17b). Its maximum transverse centroid position,
  $(x_{3,c}/D)_{max}$, increased at first slowly up to
  $t^{*} \approx 900$, and subsequently at an increasing rate between
  $900< t^{*} < 1100$. Beyond
  $t^{*} \approx 1100, (x_3/D)_{max} \approx 0.3$, i.e. comparable to that attained for the steady state case at the same
  $U^{*}$ (figure 3). Note that the observed fluctuations of
  $(x_{3,c}/D)_{max}$ are the result of the limited sampling frequency. Further note that the power spectrum based on
  $x_{3,c}/D(t^{*})$ for
  $t^{*} > 1100$ (not shown here), was similar as the one obtained under steady upstream flow conditions (see figure 9c) with
  $f_s/f_N = 0.94$.

Figure 17. Transient upstream flow conditions: (a) stepwise increase in  $U^{*}$ (and
  $Re$) as a function of
  $t^{*}$, and the simultaneously measured sphere centroid positions in the (b) transverse and (c) streamwise directions. Dashed line indicates the time (
 $t^{*} = 718$) at which
  $U^{*} = 4.5$ is reached.
Four snapshots of the vortex structure in the wake of the tethered sphere at  $U^{*} = 2.8 (t^{*} = 134.2)$, 3.9 (
 $t^{*} = 465.9$), 4.2 (
 $t^{*} = 592.0$) and 4.5 (
 $t^{*} = 1419.7$) are depicted in figure 18. The snapshots at the two lowest
  $U^{*}$ (figure 18a,b) clearly show that the vortex structure resembles the one observed under steady upstream flow conditions at similar
  $U^{*}$. For example, the pair of counter-rotating longitudinal vortices in figure 18(a) strongly resembles those observed in figure 5(c), and the uplifted hairpin vortex and the legs of the induced vortices depicted in figure 18(b) are almost identical to those in figure 6(d). At
  $U^{*} = 4.2$ (figure 18c), the symmetry plane of the shed hairpins becomes unstable, as illustrated by the appearance of ‘twisted’ hairpins shed at this instant. For
  $t^{*} = 1419.7 (U^{*} = 4.5)$, alternately shed, single hairpin vortices with their symmetry planes perpendicular to gravity are observed (figure 18d) similar to those depicted in figure 10 under steady upstream flow conditions. However, the hairpins observed at this stage were never as pronounced as those observed under steady upstream flow conditions (figure 10), and in most cases only the counter-rotating legs were observed.

Figure 18. Example snapshots of the vortex shedding structure in the wake of the tethered sphere under transient upstream flow conditions visualised by  $Q$-criterion iso-surfaces overlaid by
  $\omega ^{*}_1$; (
 $U^{*}, t^{*}$) = (a) (2.8,134.2), (b) (3.9,465.9), (c) (4.2,592.0) and (d) (4.5,1419.7).
In order to gain more insight into the wake dynamics accompanying the onset of VIV of the tethered sphere, the transient data set was analysed using the two approaches presented in §§ 3.1 and 3.2 (see figures 8 and 14). The centroid positions of the velocity deficit and the relative positions of the hairpin legs were analysed in transverse planes located at  $x_1/D = 1.0$ (velocity deficit), and
  $x_1/D = 3.0$ (hairpin legs). Instantaneous values of
  $\theta ^{d}$ and
  $\rho ^{d}/D$ are depicted in figures 19(a) and 19(b), respectively, as a function of both
  $U^{*}$ and
  $t^{*}$, superimposed on the transverse response ‘envelope’ of the sphere (depicted as a light blue, semi-transparent surface). As expected for an uplifted wake with a symmetry plane aligned with gravity, up to
  $U^{*} \approx 4 (Re < 470, t^{*} < 600)$,
  $\theta ^{d}$ remains nearly constant at 90
 $^{\circ }$ (figure 19a), while
  $\rho ^{d}/D$ slightly decreases from
  $\rho ^{d}/D \approx 0.3$ to 0.26 between
  $t^{*} = 0$ and 600, respectively.

Figure 19. Instantaneous values of (a)  $\theta ^{d}$, and (b)
  $\rho ^{d}/D$ as a function of
  $U^{*}$ and
  $t^{*}$ overlaid on the transverse sphere response (light blue envelope, secondary
  $y$-axis).
Beyond  $U^{*} \approx 4 (t^{*} \approx 600)$, values of
  $\theta ^{d}$ and
  $\rho ^{d}/D$ drastically change. Between
  $U^{*} = 4$ and 4.5 while the sphere remains almost stationary (figure 17b,c),
  $\rho ^{d}/D$ quickly reduces to almost zero (figure 19b). At the same time,
  $\theta ^{d}$ shows a preference for angles smaller than 90
 $^{\circ }$. The strong reduction of
  $\rho ^{d}/D$ is due to the loss of the preferred orientation of the symmetry plane of the shed vortices as illustrated in figure 18(c). Consequently, the repeating self-induced upward inclination of the shed hairpins is lost, and
  $x_{i,c}^{d}/D$ becomes centred at the origin. Between
  $t^{*} = 718 (U^{*} = 4.5)$ and the onset of transverse sphere motion (
 $t^{*} \approx 800$, see figure 17a),
  $\rho ^{d}/D$ remains close to zero (figure 19b) while
  $\theta ^{d}$ ‘samples’ all possible angles (figure 19a). This indicates that, due to system inertia, it takes time before a preferred orientation and lock-in is attained. As the sphere starts to move and transitions to its maximum transverse response (
 $800 < t^{*} < 900$),
  $\rho ^{d}/D$ remains close to zero while
  $\theta ^{d}$ remains scattered. However, in the range
  $900 < t^{*} < 1100$, as the transverse sphere response quickly grows (figure 17b), values of
  $\theta ^{d}$ converge to two branches having mean values of
  $\theta ^{d} \approx 0^{\circ }$ and 180
 $^{\circ }$, while values of
  $\rho ^{d}/D$ fluctuate between
  $0 < \rho ^{d}/D < 0.4$. Beyond
  $t^{*} = 1100$, as the shed vortices in the wake of the tethered sphere (figure 18d) increasingly resemble those observed under steady upstream flow conditions (figure 10), the two
  $\theta ^{d}$ branches become highly pronounced and correspond to the wake ‘flipping’ sides as the hairpin vortices are periodically shed from alternating sides (see figures 10 and 12).
In conclusion, our results show that, prior to the onset of VIV between  $4 < U^{*} < 4.5$, the pending transition manifests itself in the wake by (i) a strong decrease of
  $\rho ^{d}/D$ to zero and by (ii) initially small deviations from
  $\theta ^{d} = 90^{\circ }$ (symmetry breaking). After reaching
  $U^{*} = 4.5$, the wake is initially disorganised without any preferred orientation of the shed vortices, i.e.
  $\theta ^{d}$ samples all possible values while
  $\rho ^{d}/D$ remains close to zero. As transverse sphere movement starts, the wake is reorganised and values of
  $\theta ^{d}$ converge in two branches,
  $\theta ^{d} = 180^{\circ }$ and 0
 $^{\circ }$, in agreement with alternately shed hairpin vortices having a horizontal plane of symmetry (figures 10 and 12).
The structure and organisation of the shed vortices is further analysed by the instantaneous values of  $\theta ^{v}$ and
  $\rho ^{v}/D$ that are depicted in figures 20(a) and 20(b), respectively. As expected, up to
  $U^{*} = 3, \theta ^{v} \approx 0^{\circ }$ (figure 20a), while
  $\rho ^{v}/D \approx 0.5$ up to
  $U^{*} \approx 2.8$ (figure 20b). In the range 3
  $\leq U^{*} \leq 3.6$, two additional branches appear at
  $\theta ^{v} = \pm 180^{\circ }$ (figure 20a). These are linked to the induced vortices (figure 6d–f) whose counter-rotating longitudinal legs are of opposite sign compared with those of the primary hairpin vortices (see figure 18b). Therefore, as a result of measuring
  $\theta ^{v}$ in the direction from negative to positive vorticity,
  $\theta ^{v}$ flips from
  $0^{\circ }$ to
  $\pm 180^{\circ }$ when their symmetry plane is almost perpendicular to gravity. While induced vortices have been identified numerically (Johnson & Patel Reference Johnson and Patel1999) as well as experimentally (Eshbal et al. Reference Eshbal, Rinsky, David, Greenblatt and van Hout2019b) for fixed spheres, these results show that they first appear at
  $Re \approx 360 (U^{*} \approx 3)$ for a tethered sphere. Note that, at the same time,
  $\rho ^{v}/D$ fluctuates between
  $0.3 < \rho ^{v}/D < 0.9$ (figure 20c).

Figure 20. Instantaneous values of (a)  $\theta ^{v}$, and (b)
  $\rho ^{v}/D$ as a function of
  $U^{*}$ and
  $t^{*}$ overlaid on the transverse sphere response (light blue envelope, secondary
  $y$-axis). Dash red lines in (a) illustrate trends.
Beyond  $U^{*} = 3.6 (t^{*} \approx 343, Re \approx 430)$, values of
  $\theta ^{v}$ become scattered and are in the range
  $-180^{\circ } \leq \theta ^{v} < 180^{\circ }$ (figure 20b), while those of
  $\rho ^{v}/D$ remain scattered with a slightly larger likelihood of being close to 0.5. This region extends to
  $t^{*} \approx 800$ and can be considered the region in which the symmetry plane orientation becomes unstable while transverse sphere oscillations are absent (figure 17b). The Reynolds number,
  $Re \approx 430$ (at
  $t^{*} = 343, U^{*} = 3.6$), for the onset of planar symmetry loss is somewhat higher than
  $Re = 375$ reported by Chrust et al. (Reference Chrust, Goujon-Durand and Wesfreid2013), but similar to that reported by Sakamoto & Haniu (Reference Sakamoto and Haniu1990) (
 $Re = 420$) for a fixed sphere. Just after reaching
  $U^{*} = 4.5$, the sphere starts to oscillate in the transverse direction (
 $t^{*} \approx 800$, figure 17b) and the transition to a symmetry plane perpendicular to gravity (figure 10) is manifested by the convergence of the values of
  $\theta _v$ into two branches,
  $\theta _v = \pm 90^{\circ }$ for
  $U^{*} > 4.5, t^{*} > 800$ (trends are highlighted by dash red lines in figure 20a). Note that this is similar to what was obtained under steady conditions at
  $U^{*} = 4.5$ (figure 14c).
5. Summary and discussion
We have presented a detailed analysis of the changes in the vortex shedding patterns accompanying the onset of VIV for a heavy, tethered sphere. The analysis was based on the results of simultaneous 3-D flow field measurements (tomo-PIV) and sphere position tracking. The 3-D flow field in the wake of the tethered sphere was measured under both steady and transient upstream flow conditions. The former were performed at  $U^{*} = 1.9$, 3.2, 4.5 and 7.2 corresponding to
  $Re = 230$, 383, 532 and 850, respectively, while transient upstream flow conditions were imposed by stepwise increasing
  $U^{*}$ within the range,
  $2.2 < U^{*} < 4.5 (263 < Re < 532)$. Note that
  $U^{*}$ and
  $Re$ are not independent, and while both are proportional to
  $U_\infty$,
  $Re$ and
  $U^{*}$ are proportional and inversely proportional to
  $D$, respectively. Therefore, increasing
  $Re$ while keeping
  $U^{*}$ in the ‘lock-in’ regime would require to increase the sphere diameter (for given fluid kinematic viscosity and tether length). The present range of
  $Re$ was chosen such that distinct, well-organised large-scale vortex shedding was obtained that could be well resolved (both spatially and temporally) by the employed tomo-PIV method.
The combination of measurements under steady and transient upstream flow conditions allowed for (i) a detailed comparison between the observed vortex shedding patterns, and (ii) us to elucidate the chain of wake events accompanying the onset of VIV. The latter was quantified by the instantaneous centroid positions of the velocity deficit and the instantaneous symmetry plane orientations of the shed longitudinal vortices in the near wake of the sphere. Our results showed that sphere VIV are initiated through a complex chain of events first manifested by ‘lock-in’ of streamwise sphere oscillations due to the appearance of induced vortices at  $U^{*} \approx 3 (Re \approx 360)$. As the shed hairpins become unstable with increasing
  $U^{*}$, their small transverse perturbations are transferred to the tethered sphere, which leads to amplification of its transverse oscillation and greater instability of the shed hairpins. With the tether constraining the sphere's motion, this process mutually reinforces transverse oscillation and reorganises the flow field such that the shed hairpins’ symmetry planes are flipped by 90
 $^{\circ }$ and their forcing sustains VIV.
Several stages were identified in the onset of VIV. First, at low  $U^{*} (< 3)$, shed primary hairpin orientations were stable exhibiting a symmetry plane oriented in the streamwise direction parallel with the tether. The wake was consistently lifted upwards due to self-induced motion (
 $\rho ^{d}/D \approx 0.3$,
  $\theta ^{d} \approx 90^{\circ }$). In the second stage (
 $3 < U^{*} < 4.2$), induced vortices appeared that led to lock-in of the sphere's streamwise oscillations, prior to lock-in in the transverse direction. In the third stage, for transient upstream flow conditions in the range
  $4.2 < U^{*} < 4.5$, impending sphere oscillations were manifested by a rapid decrease of
  $\rho ^{d}/D$ to almost zero due to loss of the hairpin's preferred orientation. At this stage, the wake's velocity deficit became centred in the downstream direction (along
  $x_2 = x_3 = 0$). After reaching
  $U^{*} = 4.5$ (fourth stage, transient conditions), transverse sphere oscillations only started after a delay (
 ${\rm \Delta} t^{*} \approx 100$) due to system inertia. During this stage, vortex shedding was unorganised, lacking any preferred orientation. However, the interaction between the shed vortices and the tethered sphere's constrained ability to move, led to concurrent amplification of the sphere's transverse oscillation amplitude and simultaneous reorganisation of the shed hairpin orientations into two branches (
 $\theta ^{v} = \pm 90^{\circ }$) reaching the same state as for
  $U^{*} = 4.5$ under steady upstream flow conditions.
After crossing the onset of VIV, the tethered sphere exhibited streamwise and transverse periodic oscillations at a frequency close to  $f_N$ within the lock-in region at
  $U^{*} = 4.5$ (mode I) and 7.2 (mode II). Shedding was characterised by a sequence of alternately shed hairpin vortices having a symmetry plane perpendicular to gravity with the transverse r.m.s. oscillation amplitude for
  $U^{*} = 7.2$ exceeding that for
  $U^{*} = 4.5$. The elevated transverse r.m.s. oscillation amplitude at
  $U^{*} = 7.2$ was accompanied by shedding of pairs of double hairpin vortices per oscillation cycle. In contrast, at
  $U^{*} = 4.5$ only pairs of single hairpins were shed per oscillation cycle. Calculation of the instantaneous vortex force exerted on the sphere by the fluid showed that maximum magnitudes of the vortex force exerted on the sphere at
  $U^{*} = 7.2$ exceeded those at
  $U^{*} = 4.5$ in accordance with the increased transverse oscillation amplitude. We associated the generation of multiple single-sided hairpin vortices per oscillation cycle with the ratio
  $T_f/t_s \approx U^{*}$ (as long as
  $f_s \approx f_N$), i.e. multiple single-sided hairpins may be generated during one transverse sweep of the sphere providing
  $U^{*}$ is large enough (multiple of approximately 3) and within the lock-in region. Note that, for a light sphere (
 $m^{*} < 1$), the lock-in region widens (Govardhan & Williamson Reference Govardhan and Williamson2005) and, according to the suggested mechanism, multiple (three or more) single-sided hairpins may be shed during one oscillation cycle with increasing
  $U^{*}$.
It should be noted that the basic mechanism for the onset of VIV lies in boundary layer and shear layer instabilities that develop close to the sphere's surface (van Hout, Katz & Greenblatt Reference van Hout, Katz and Greenblatt2013a; van Hout et al. Reference van Hout, Katz and Greenblatt2013b), and are difficult to resolve experimentally even at the relatively low Reynolds number range that was chosen. However, the present results show that the signature of these boundary layer instabilities can be detected in transverse planes, downstream of the sphere. A higher Reynolds number range can be explored by choosing a larger sphere (while keeping  $m^{*}$ the same). Although we expect that similar physical mechanisms also act at higher Reynolds numbers (based on similar vortex shedding topology and transverse sphere response, see Govardhan & Williamson Reference Govardhan and Williamson2005, Rajamuni et al. Reference Rajamuni, Thompson and Hourigan2018, Reference Rajamuni, Thompson and Hourigan2020), vortex shedding patterns may become less organised and more fragmented, possibly affecting some of the present findings regarding the change of the velocity deficit centroid positions and the relative position of shed longitudinal vortices. This is outside the scope of the present investigation and will be investigated in future studies.
Furthermore, while the present results have provided much insight into the sequence of events leading to VIV of a tethered sphere, time scales associated with the changing upstream flow field and associated response of the tethered sphere (dependence of  $m^{*}$) were outside the scope of the present investigation. However, they are clearly of interest in practical applications and will be pursued in future research.
Supplementary movies
Supplementary movies are available at https://doi.org/10.1017/jfm.2022.428.
Funding
This research was supported by the Israel Science Foundation under grant no. 1596/14.
Declaration of interest
The authors report no conflict of interest.


 Open access