


INTRODUCTION
Glaciers and ice sheets have been recently recognized as a terrestrial biome in their own right (Anesio and Laybourn-Parry, Reference Anesio and Laybourn-Parry2012) because they host different ecosystems dominated by microorganisms (Hodson and others, Reference Hodson2008; Boetius and others, Reference Boetius, Anesio, Deming, Mikucki and Rapp2015). Among glacial environments, cryoconite holes are considered hot spots of biodiversity (Cook and others, Reference Cook, Edwards, Takeuchi and Irvine-Fynn2016a, Reference Cookb). These peculiar structures are small ponds that form on glacier surface when the cryoconite, a fine-grained wind-borne sediment, accumulates in small depressions and locally decreases the albedo promoting the underlying ice melting. The ponds are then filled by the meltwater and the cryoconite remains at the bottom where it promotes microorganism growth (Wharton and others, Reference Wharton, Mckay, Simmons and Parker1985).
Cryoconite holes range in diameter from few centimetres to more than a metre and host the most metabolically active ecological communities in glacier ecosystems (Laybourn-Parry and others, Reference Laybourn-Parry, Tranter and Hodson2012). These microhabitats host bacteria, tardigrades, rotifers, collembola, algae, viruses and nematodes (Hodson and others, Reference Hodson2008; Cook and others, Reference Cook, Edwards, Takeuchi and Irvine-Fynn2016a, Reference Cookb) and have been studied on glaciers in different geographical areas, such as the Alps (Edwards and others, Reference Edwards2013; Franzetti and others, Reference Franzetti2017a), Arctic (Gokul and others, Reference Gokul2016), Greenland (Uetake and others, Reference Uetake2016), Antarctica (Cameron and others, Reference Cameron, Hodson and Osborn2012), Himalaya (Takeuchi and others, Reference Takeuchi, Kohshima, Yoshimura, Seko and Fujita2000) and Karakoram (Ambrosini and others, Reference Ambrosini2017). Bacterial communities of cryoconite holes seem to vary according to ecological conditions of the holes, particularly with their size and pH (Ambrosini and others, Reference Ambrosini2017), sediment thickness and organic matter content (Telling and others, Reference Telling2012) and the hydrology of the glacier surface (Edwards and others, Reference Edwards2011), as well as their location within a glacier (Stibal and others, Reference Stibal2015). Variability among glaciers has also been reported (Franzetti and others, Reference Franzetti2016; Liu and others, Reference Liu2017).
Bacterial communities of cryoconite holes seem dominated by Cyanobacteria, Actinobacteria, Proteobacteria and Bacteroidetes on both polar and temperate glaciers (Musilova and others, Reference Musilova, Tranter, Bennett, Wadham and Anesio2015; Ambrosini and others, Reference Ambrosini2017; Gokul and others, Reference Gokul2016; Franzetti and others, Reference Franzetti2017a). However, most of the studies conducted so far investigated cryoconite bacterial populations by snapshot sampling, probably because of logistic limitations to the sampling design, and almost neglected the temporal variability of the ecological communities of cryoconite holes (e.g. Takeuchi and others, Reference Takeuchi, Nishiyama and Li2010; Singh and others, Reference Singh, Singh and Dhakephalkar2014; Ambrosini and others, Reference Ambrosini2017). Indeed, to the best of our knowledge, only a few studies investigated the temporal variability of bacterial communities of cryoconite holes. For instance, Takeuchi and others (Reference Takeuchi, Nishiyama and Li2010) showed that cryoconite grains form as a consequence of biological activity, especially of filamentous Cyanobacteria. Similarly, Franzetti and others (Reference Franzetti2017a) indicated that Cyanobacteria are one of the prevalent taxa in cryoconite holes at the beginning of the ablation season on a temperate glacier, but their relative abundance declines in later stages of the melting season, when heterotrophic taxa such as Actinobacteria, Proteobacteria and Bacteroidetes dominate. Hence, cryoconite bacterial communities seem to show temporal variability during one ablation season, shifting from a condition with a prevalence of phototrophs to a prevalence of heterotrophs. This process is probably driven by the increase in the organic matter content of the cryoconite. In contrast, Musilova and others (Reference Musilova, Tranter, Bennett, Wadham and Anesio2015) showed that bacterial communities inhabiting cryoconite holes on the Greenland ice sheet seem stable during one ablation season. This result is supported by the study of Cook and others (Reference Cook, Edwards, Takeuchi and Irvine-Fynn2016a, Reference Cookb), which showed that a perturbation of Greenland cryoconite holes did not change the status of net autotrophy.
Different studies thus provided contrasting results on the temporal dynamics of cryoconite hole bacterial communities, the main difference being the evidence, on the one side, of a community stability in Arctic glaciers and, on the other side, of temporal dynamics in cryoconite holes on temperate glaciers. This difference may be due to the fact that, on polar glaciers, holes can persist for years (Porazinska and others, Reference Porazinska2004), while they are rather ephemeral on temperate glaciers. Indeed, the intense solar radiation melts them away and releases the cryoconite, which can eventually determine the formation of a new hole during the same ablation season (Cook and others, Reference Cook, Edwards, Takeuchi and Irvine-Fynn2016a, Reference Cookb). Interestingly, one of the few studies on the temporal variability of bacterial communities of cryoconite holes suggested that they may follow the steps of an ecological succession independently of the age of the hole (Franzetti and others, Reference Franzetti2017a). Indeed, communities observed in cryoconite holes on the Forni Glacier (Italian Alps) for example in August, were similar to one another, regardless of the fact that the holes formed in July (i.e. they were 1-month old) or they were newly formed ones. This suggested that communities in new holes can be seeded by those present in previous holes melted away by ablation and that ecological succession of cryoconite bacterial communities continues throughout the ablation season, independently of the time when a hole forms (Franzetti and others, Reference Franzetti2017a). Cryoconite communities, however, are seeded also by inputs from near glacier environments (Telling and others, Reference Telling2012; Stibal and others, Reference Stibal2015; Franzetti and others, Reference Franzetti2017b) and possibly by bacteria subjected to long-range transport (Cook and others, Reference Cook, Edwards, Takeuchi and Irvine-Fynn2016a, Reference Cookb) or deposited by precipitations (R.S. Azzoni, personal communication). Inputs from external environments may thus affect the bacterial communities of cryoconite holes and determine year-to-year variability in the observed communities. This variability may be particularly large at the beginning of the melting season, when cryoconite communities may be seeded by bacteria from the melting snow cover, whose composition may vary from year to year for example because of stochastic variability of the geographical origin of the air masses that determines dust-rich precipitations (R.S. Azzoni, personal communication). Whether these differences persist along the ablation season or communities quickly tend to a similar composition because of strong selection toward the populations most adapted to the conditions of the cryoconite holes is, however, unknown.
This study aims at filling this gap of knowledge by investigating both inter- and intra-annual variability of bacterial communities of cryoconite holes from the Forni Glacier (Italian Alps). In particular, we used Illumina sequencing of the 16S rRNA gene to compare the structure of bacterial communities of cryoconite holes collected at the beginning of the ablation season (i.e. in July) in four different years (2012, 2013, 2015 and 2016). In addition, we investigated the variation of bacterial communities along the ablation seasons of 2013 and 2016 to assess whether recurrent patterns could be observed. Part of the data presented here (i.e. those collected in 2013) has already been published in a previous paper on the temporal variability of cryoconite bacterial communities along one ablation season (Franzetti and others, Reference Franzetti2017a). However, the other data are entirely new and allowed investigating different research questions (i.e. interannual variability, repeatability of within-year trends) from those addressed in the previous paper.
MATERIALS AND METHODS
Field sampling and meteorological data
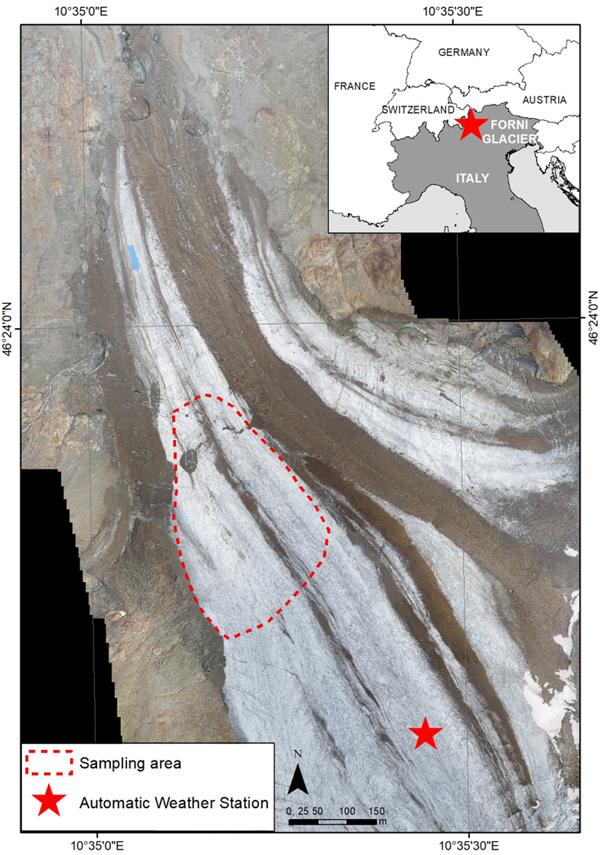
Forni Glacier is an Italian valley glacier belonging to Ortles-Cevedale Group (46°24′00″N, 10°35′30″E; Fig. 1). Its elevation ranges between 2600 and 3670 m a.s.l (Smiraglia and others, Reference Smiraglia2015). Samples were collected during the ablation seasons (July–September) of the years 2012 (21 samples), 2013 (60 samples), 2015 (21 samples) and 2016 (60 samples) with a laboratory spoon sterilized with alcohol. Samples were collected in 50 mL Falcon™ tubes kept at 4 °C during the transport to the laboratory, which occurred within 8 h, and then at −20 °C before the analyses. In 2012 and 2015, we collected samples in July only, while in 2013 and 2016 samples were collected at respectively three and five-time points along the ablation seasons (see Supplementary table S1 for details on sampling dates and sample sizes).

Fig. 1. Location of the sampling area on the ablation tongue of Forni Glacier (Stelvio Park, Central Italian Alps). The sampling area is reported with a red-dashed line, the AWS is represented by a red star. The base map is produced from an Unmanned Aerial Vehicle flight in 2014.
Detailed meteorological data were recorded by an automatic weather station (AWS) located on the surface of the Forni Glacier at 2660 m. a.s.l., 400 m apart from the area where we collected cryoconite. We defined the beginning of the melting season at a site on the glacier as the date when the snow is completely melted and the bare ice is exposed. This can be precisely defined at the AWS site as the day when the mean daily albedo is lower than 0.30 (Azzoni and others, Reference Azzoni2016). However, images from a high-resolution webcam installed in the proximity of the glacier revealed that bare ice is exposed at the site where we collected cryoconite up to 7 days earlier than at the AWS site. We thus defined the beginning of the melting season as the 7th day before the date when the mean daily albedo at the AWS was lower than 0.30. The end of the melting season was defined as the date when a snowfall covered the ice and mean daily albedo rised above 0.30 (reaching values of 0.85–0.90, typical of the fresh snow) for the following months. We then calculated the positive daily degree-day (DD) as the cumulated mean daily temperatures above 0 °C and the cumulative incoming shortwave radiation (c-SWIN) as the cumulated daily SWIN since the beginning of the melting season of each year (Fig. S1).
DNA extraction and amplification
Total DNA was extracted from 0.5 g of each cryoconite sample with the FastDNA® Spin for Soil kit (MP Biomedicals, Solon, OH, USA) according to the manufacturer's instructions. A first PCR amplification was performed on the V5-V6 hypervariable regions of 16S rRNA gene for each sample to evaluate its quality on the original and on the 1:10 dilution to identify inhibition or insufficient samples. A second PCR was then performed with GoTaq® Green Master Mix (Promega Corporation, Madison, WI, USA) and 1 µM of each primer, for a final volume of 2 × 50 µL for each sample. Illumina adapters (6 bp) were added at the 5’ end. 783F and 1046R primers were used (Huber and others, Reference Huber2007; Wang and Qian, Reference Wang and Qian2009) and the cycling conditions were: initial denaturation at 94 °C for 4 min; 28 cycles at 94 °C for 50 s, 47 °C for 30 s, and 72 °C for 45 s and a final extension at 72 °C for 5 min. Amplicons were then purified with Wizard® SV Gel and PCR Clean-up System (Promega Corporation, Madison, WI) and quantified with Qubit® (Life Technologies, Carlsbad, CA). Libraries were prepared with nine samples each, identifiable thanks to different barcode pairs. Library preparation with the addition of standard Nextera indexes (Illumina, Inc., San Diego, CA) and sequencing with MiSeq Illumina platform (Illumina, Inc., San Diego, CA), using a 2 × 250 bp paired-end protocol, were performed at Parco Tecnologico Padano (Lodi, Italy).
DNA sequence processing and statistical analyses
The obtained reads were demultiplexed according to the indexes. The Uparse pipeline was used for the following elaborations (Edgar, Reference Edgar2013). Forward and reverse reads were merged only if with zero mismatches and quality filtered with default parameters. Operational taxonomic units (OTUs) were defined with an aggregative clustering of sequences with 97% of sequence identity. Suspected chimeras and singleton sequences (i.e. sequences appearing only once in the whole dataset) were removed. Singletons (OTUs present once in one sample only) were removed from the analyses because their inclusion could inflate variance explained by multivariate analyses (Legendre and Legendre, Reference Legendre and Legendre2012). OTU classification at order level was inferred with RDP classifier (Wang and others, Reference Wang, Garrity, Tiedje and Cole2007) with the only exception of Cyanobacteria because the RDP classifier does not report the order level for this taxon (Garrity and others, Reference Garrity2007; Wilmotte and Herdman, Reference Wilmotte and Herdman2015). To compare diversity among samples that largely differed in the number of sequences, 20 000 sequences were randomly selected from each sample for which more than 20 000 sequences were available. For the other samples, OTU abundance was normalized to 20 000 sequences by resampling with repetition.
Multivariate analyses were based on Hellinger distance, which depends on the differences in OTU proportion between samples, decreases the importance of OTU abundance over their occurrence and avoids the double-zero problem when comparing OTU composition between samples (Legendre and Legendre, Reference Legendre and Legendre2001; De Cáceres and others, Reference De Cáceres, Legendre and Moretti2010). Principal Component Analysis (PCA) was performed on all samples to visualize data distribution. Redundancy analysis (RDA) and variation partitioning were used to quantify the variation of community structures according to the meteorological conditions (i.e. DD and c-SWIN), the day of melting season, month and year. Post-hoc tests were also performed to assess pairwise differences between years and months. For RDAs, post-hoc tests were performed by running separate analyses for each pair of years or months and correcting P-values for multiple testing according to the false discovery rate (FDR) procedure (Benjamini and Yekutieli, Reference Benjamini and Yekutieli2001).
Day of melting season, DD and c-SWIN were highly collinear (r ≥ 0.991; Fig. S1), so they could not be entered simultaneously in RDA models. We thus performed a principal component analysis on DD and c-SWIN by considering all the days in the melting seasons of all years. The first extracted component was strongly collinear with the day of melting season (r = 0.989), thus it accounted for the seasonal trend of increasing DD and c-SWIN. This variable was discarded from subsequent analyses because its effect was already accounted for by the day of melting season. In contrast, the second component was almost independent from the day of melting season and c-SWIN (r < 0.006) and was slightly but positively correlated with DD (r = 0.133). It was therefore used as an index of the deviation of the DD in a particular day from the mean seasonal trend of increasing DD. From here on, we will refer to this variable as temperature index (TI). Positive values of TI thus indicate warmer days than expected for that period of the year.
Variation in the abundance of Cyanobacteria and the most abundant orders (see below) according to the variables that significantly affected the structure of bacterial communities identified by the RDAs was investigated by generalized linear models (GLMs) assuming a Poisson distribution and corrected for overdispersion. Also in this case, P-values were corrected using the FDR procedure. Analyses were performed with R 3.4.2 (R Core Team, 2014) with the VEGAN, BIODIVERSITYR, MULTTEST, MULTCOMP packages.
RESULTS
Cyanobacteria and seven orders (Sphingobacteriales, Burkholderiales, Pseudomonadales, Rhodospirillales, Cytophagales, Actinomycetales, Clostridiales) had more than 50 000 sequences in the dataset and were considered abundant taxa (Fig. 2). Cyanobacteria, Pseudomonadales, Rhodospirillales, Cytophagales and Actinomycetales were present in all years and months. Clostridiales were present in July samples of all years, but they decreased along the ablation season in 2013 and 2016 and were always absent in September samples. We ran a PCA on all samples of all 4 years to visualize data distribution (Fig. 3). This analysis showed that each year clustered in a rather distinct group mainly along the first axis. A temporal trend of samples collected in different months also seemed to appear along the second axis. This analysis thus suggested that cryoconite hole bacterial communities showed both between- and within-year variability.
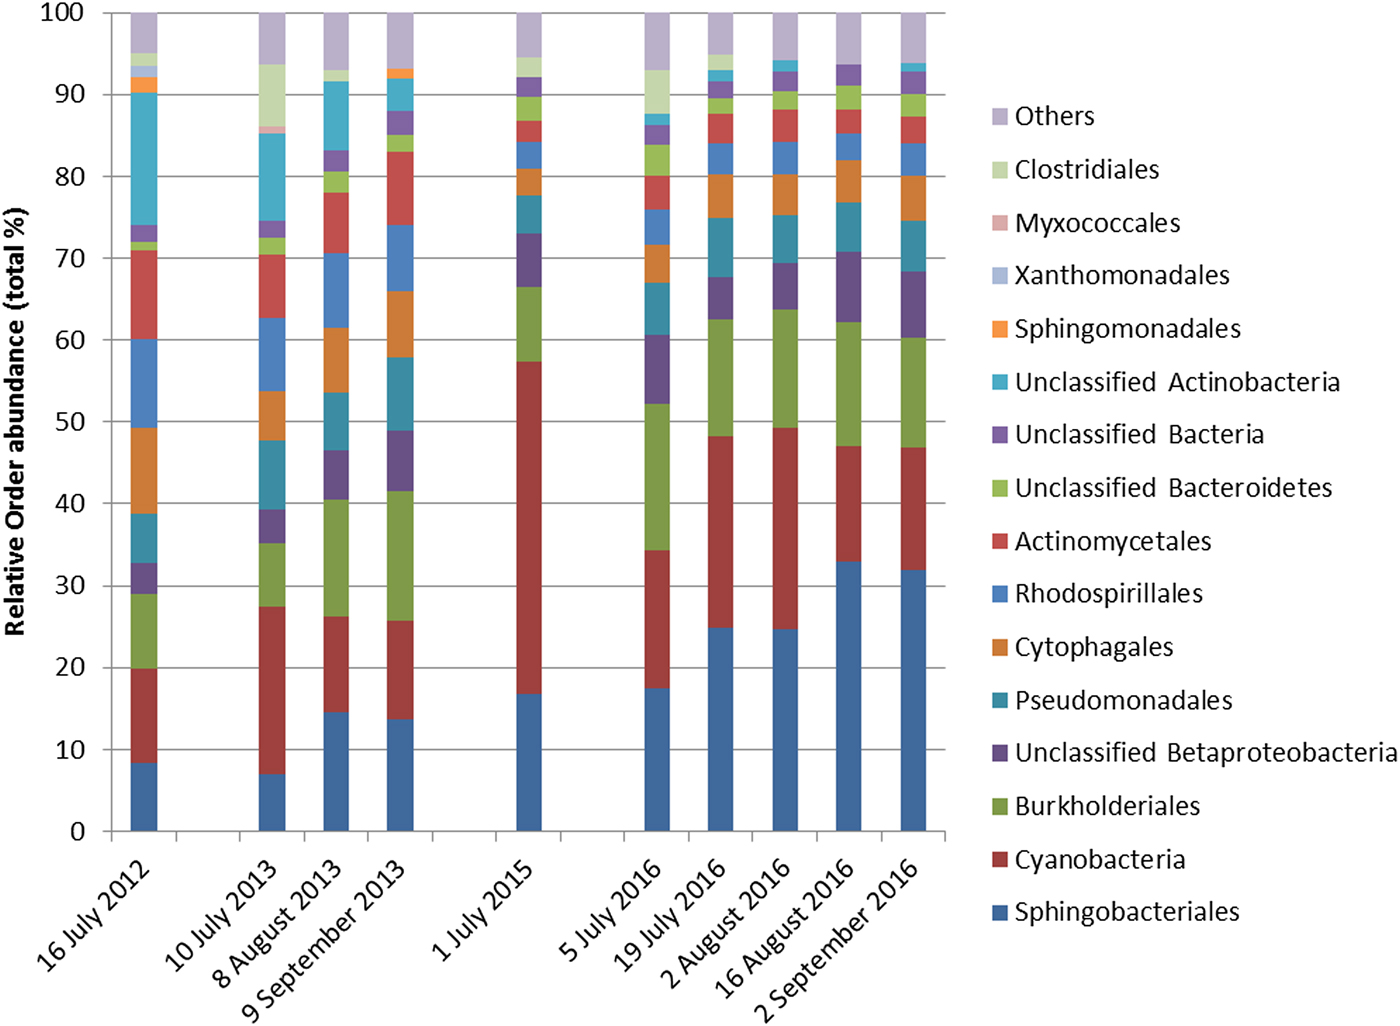
Fig. 2. Relative abundance of bacterial taxa, mostly at the order level, expressed as the percentage of sequences classified with confidence >90%. Orders whose abundance was <1% were grouped in ‘Others’.
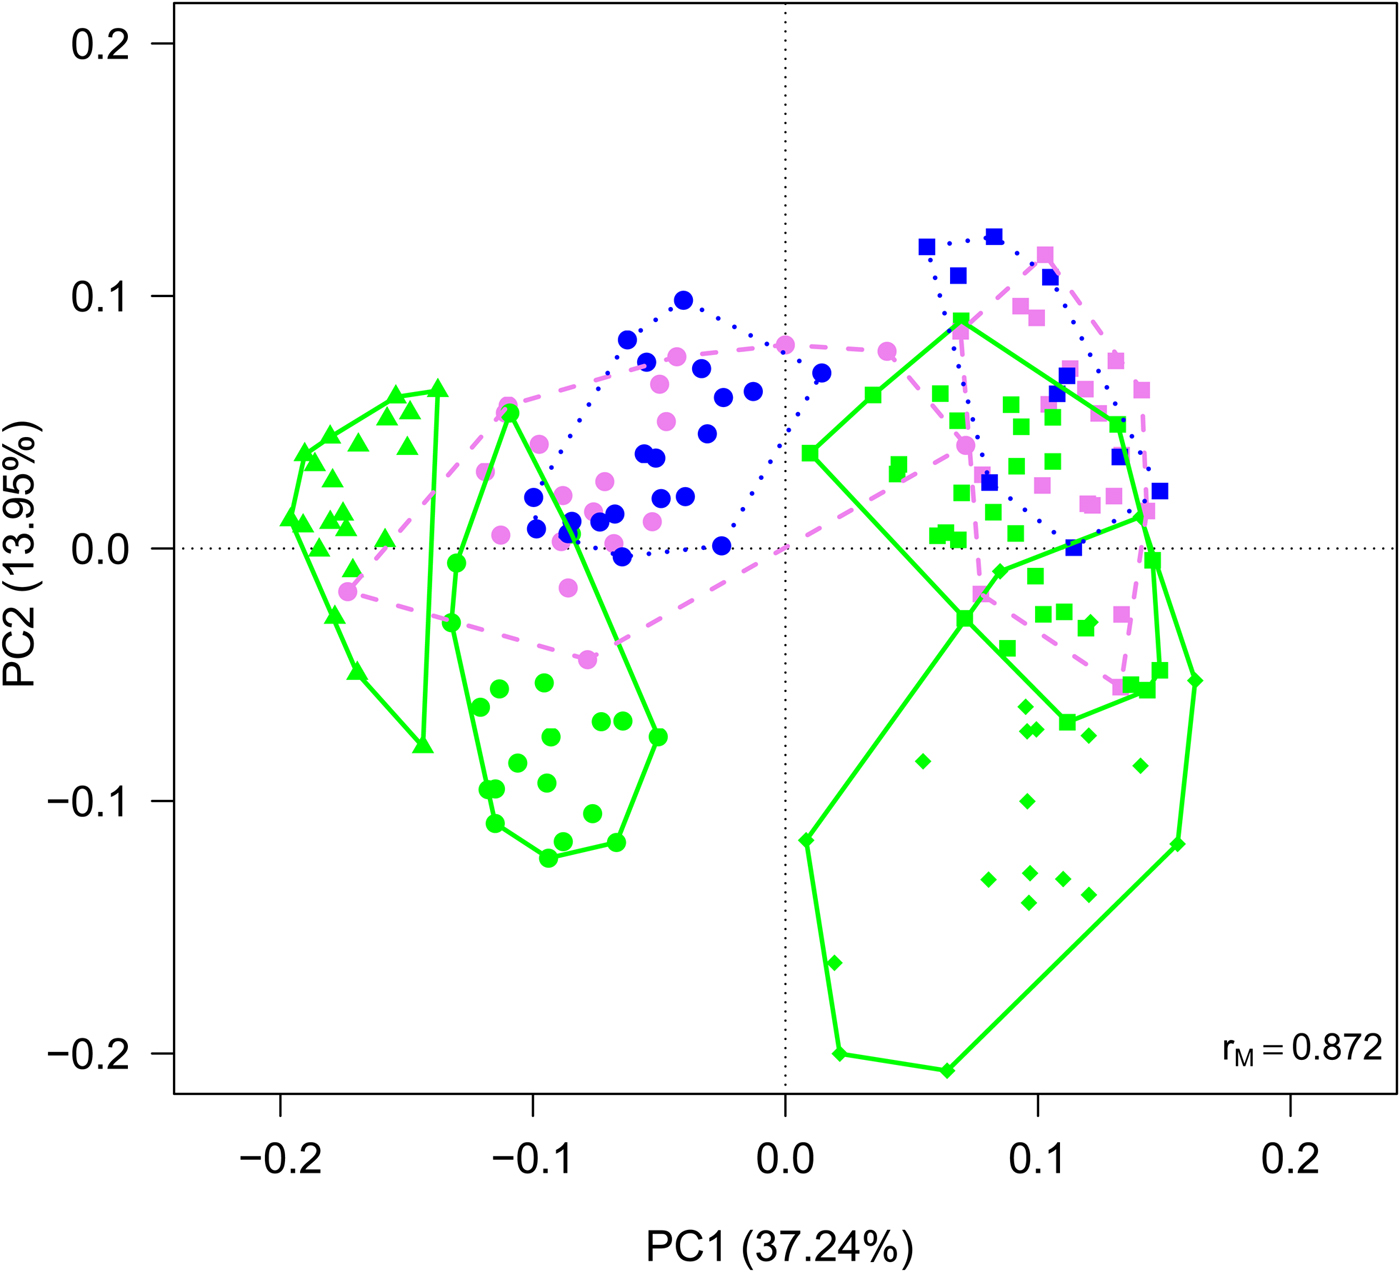
Fig. 3. PCA plot on Hellinger-transformed abundances of each OTU of all the samples. Line colours and styles denote the month when the samples were collected (green solid line = July, violet dashed line = August, blue dotted line = September), while symbols the year (dots = 2012, triangles = 2013, diamonds = 2015, squares = 2016).
To investigate between-year variability, we ran a RDA including only July samples of all years to investigate differences in the structure of bacterial communities at the beginning of the ablation season. This analysis showed significant variations in the structure of bacterial communities between years (Table 1; Fig. S2) and post-hoc tests highlighted significant differences between all pairs of years (F 1,49 ≥ 15.099, P FDR ≤ 0.002). GLMs indicated that July abundance of all the eight most abundant taxa differed among years (F 3,88 ≥ 8.891, P FDR ≤ 0.001). Post-hoc tests also showed that abundance of Cyanobacteria was lowest in 2012, intermediate in 2013 and 2016 and highest in 2015. Sphingobacteriales were more abundant in 2015 and 2016 than in 2012 and 2013, Burkholderiales were more abundant in 2016 than in all the other years and in 2015 more than in 2013. The abundance of Rhodospirillales and Actinomycetales changed significantly in all years. Pseudomonadales were more abundant in 2013 than in 2012 and 2015 and intermediate in 2016, Cytophagales were more abundant in 2012 than in all the other years, while Clostridiales were more abundant in 2013 than in all the other years and in 2016 more than in 2012 (see Figs S3–S11 for further details).
Table 1. RDA of variation of Hellinger-transformed bacterial OTU abundance of July samples of 2012, 2013, 2015 and 2016 according to year

F 3,88 = 34.340, P = 0.001, Adjusted-R 2 = 0.524.
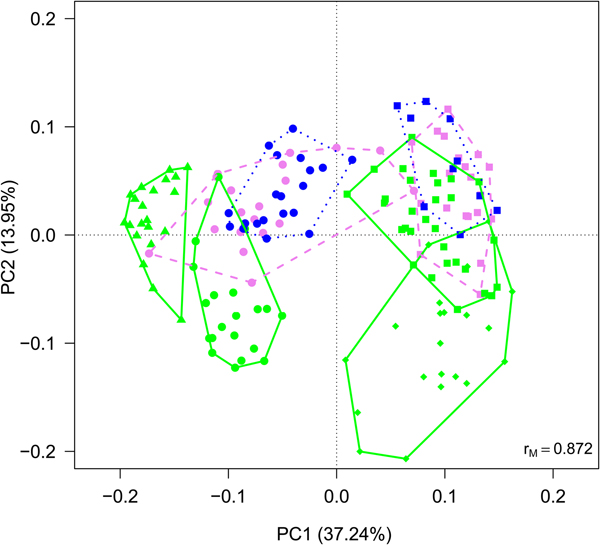
To gain further insights into within-year variability we focused on data collected in 2013 and 2016 (i.e. the years in which multiple samples were corrected along the ablation season). RDA showed significant variations in the structure of bacterial communities both between years (F 1,116 = 63.245, P = 0.001) and among months (F 2,116 = 10.722, P = 0.001), with post-hoc tests highlighting significant differences between all pairs of months (F 1,116 ≥ 12.009, P FDR ≤ 0.001). Variation partitioning showed that year per se accounted for 32.01% of variance, while month per se for 9.85%. The amount of variation shared between year and month was null (Fig. 4). GLMs showed that abundance of Sphingobacteriales, Cyanobacteria and Clostridiales differed among months (F 2,166 ≥ 6.284, P FDR ≤ 0.018). In particular, abundance of Sphingobacteriales was lower in July than in August and September (z ≥ 6.476, P ≤ 0.001), whereas Cyanobacteria were significantly more abundant in July than in the other months (z ≥ 2.351, P ≤ 0.048). Clostridiales were more abundant in July, intermediate in August and less abundant in September (z ≥ 2.624, P ≤ 0.022). Abundance of Cyanobacteria did not differ significantly between years (F 1,116 = 3.038, P FDR = 0.141), Sphingobacteriales and Burkholderiales were more abundant in 2016 than in 2013 (F 1,116 ≥ 10.033, P FDR ≤ 0.006), while all the other abundant orders where significantly more abundant in 2013 than in 2016 (F 1,116 ≥ 10.426, P FDR ≤ 0.006).
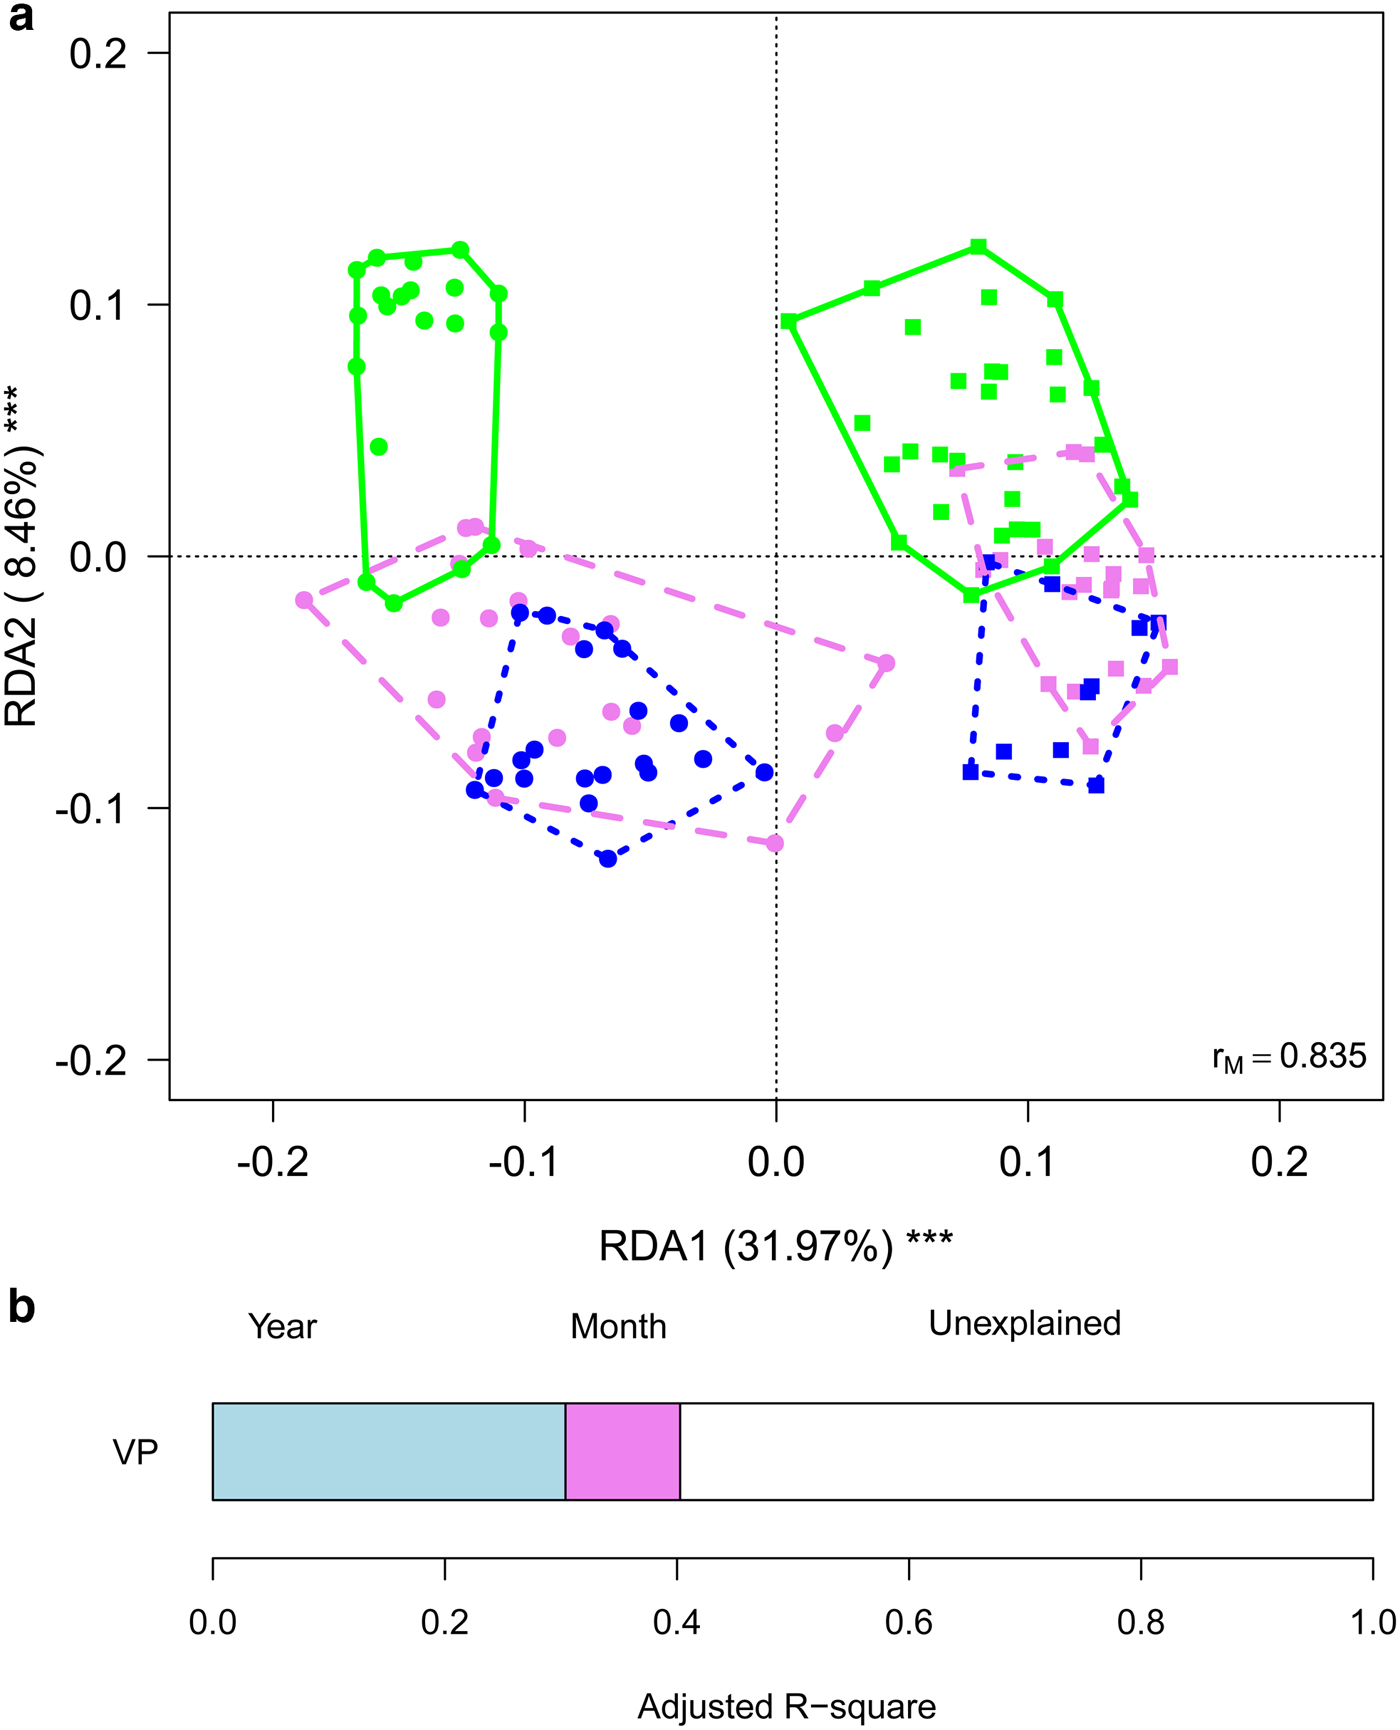
Fig. 4. (a) Biplot from RDA on Hellinger-transformed bacterial OTU abundance on year and month. Each point represents one sample. The analysis includes data collected in 2013 (dots) and 2016 (squares) only. Samples collected in different months are indicated by different colours and included in polygons with different line styles (green solid line = July, violet dashed line = August, blue dotted line = September). The percentage of variance explained by each axis and its significance (***: P < 0.001) is reported. r M is the Mantel correlation coefficient between the Hellinger distance between samples and the Euclidean distance between the corresponding symbols in the graph. Values close to one indicate that the graph correctly represents the distance between samples. (b) Results from the variation partitioning showing the amount of variance explained by the independent effects of the predictors entered in the RDA. There was no combined effect of the two variables.
Finally, we aimed at investigating whether meteorological conditions affected the observed within-year trends. To this aim, we ran a RDA including sampling date, expressed as the day of melting season, and TI. This analysis showed that the structure of cryoconite bacterial communities differed between years, changed along the melting season and varied according to TI (Table 2, Fig. 5a). Variation partitioning also showed that year per se explained 12.11% of the variance, TI 3.93% and their shared effect 18.38%. This probably occurred because TI values differed significantly between years both considering all days during melting seasons (t 190,48 = 17.209, P < 0.001) and considering sampling days only (t 4,27 = 2.992, P = 0.037). Day of melting season explained only 1.03% of the variance in the structure of bacterial communities and its contribution was independent of that of all the other variables (Fig. 5b).
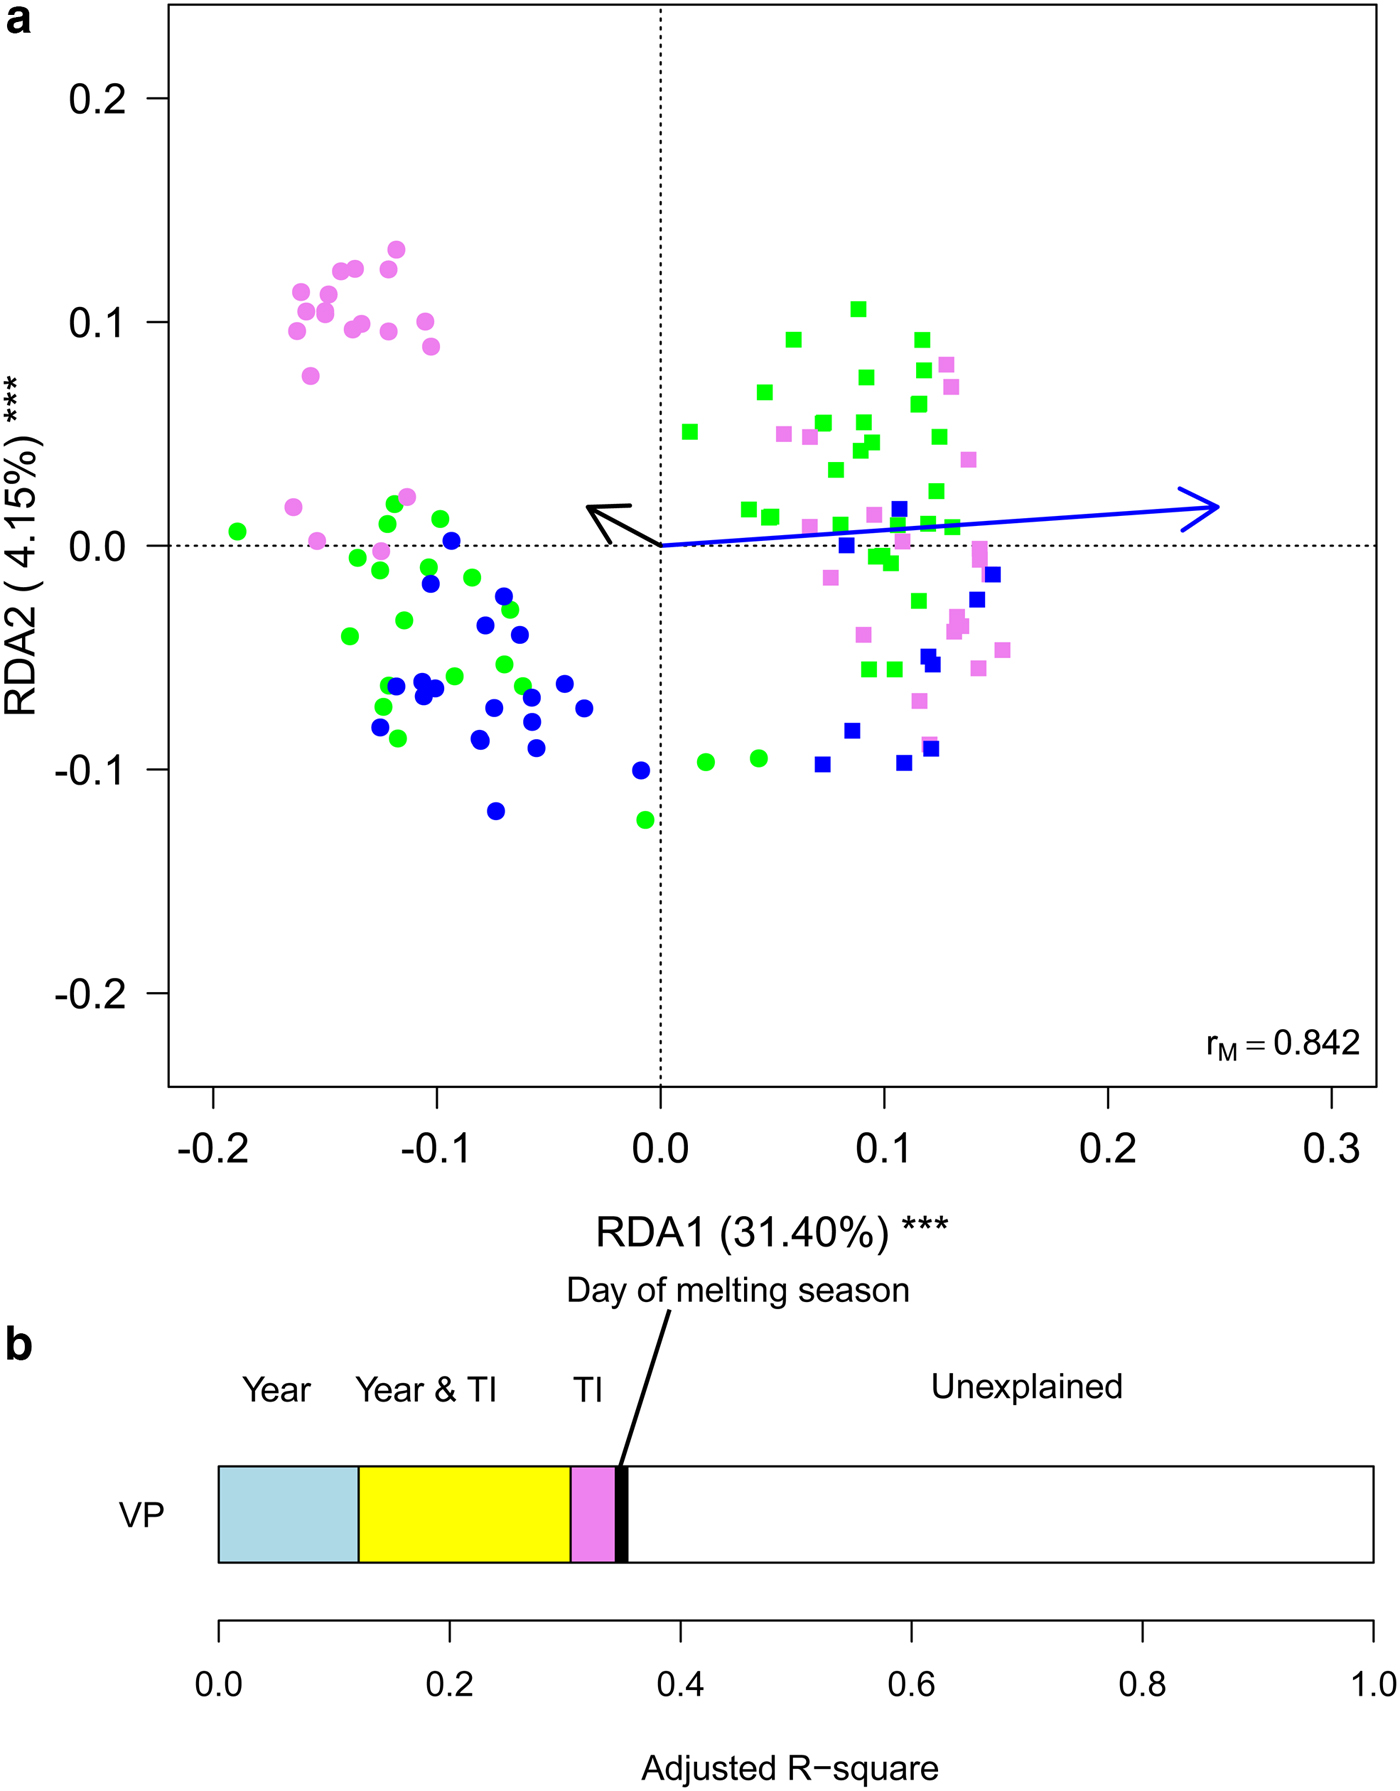
Fig. 5. (a) Biplot from RDA of Hellinger-transformed bacterial OTU abundance on the year, day of melting season and temperature index (TI). Each point represents one sample. The analysis includes data collected in 2013 (dots) and 2016 (squares) only. Samples collected in different months are indicated by different colours (green = July, violet = August, blue = September). Arrows represent noncategorical constraining variables (black arrow = day of melting season, blue arrow = TI). The percentage of variance explained by each axis and its significance (***: P < 0.001) are reported. r M is the Mantel correlation coefficient between the Hellinger distance between samples and the Euclidean distance between the corresponding symbols in the graph. Values close to one indicate that the graph correctly represents the distance between samples. (b) Results from the variation partitioning showing the amount of variance explained by the independent and combined effects of the predictors entered in the RDA. The amount of variance explained by the shared contribution of TI and day of melting season was null as well as that explained by the shared contribution of year and day of melting season and by all the three variables simultaneously.
Table 2. RDA of Hellinger-transformed bacterial OTU abundance on year, day of melting season and an index of temperatures based on samples collected in 2013 and 2016
F 3,112 = 22.729, P = 0.001, Adjusted-R 2 = 0.354.
GLMs showed that, after accounting for day of melting season and TI, abundance of Clostridiales, Burkholderiales and Pseudomonadales did not differ significantly between years (F 1,116 ≤ 5.263, P FDR ≥ 0.085), Rhodospirillales, Cytophagales, Pseudomonadales and Actinomycetales were more abundant in 2013 than in 2016 (F 1,116 ≤ 100.907, P FDR ≤ 0.001), while the opposite occurred to Cyanobacteria and Sphingobacteriales (F 2,116 ≥ 19.999, P FDR ≤ 0.001). In addition, the abundance of no taxon changed with a day of melting season (F 1,116 ≤ 3.778, P FDR ≥ 0.594), while Sphingobacteriales and Burkholderiales increased at increasing values of TI (F 2,116 ≥ 12.254, P FDR ≤ 0.004) and Clostridiales and Cyanobacteria decreased (F 2,116 ≥ 19.161, P FDR ≤ 0.001).
DISCUSSION
This study investigated the variation in the structure of bacterial communities of cryoconite holes on a temperate mountain glacier. Overall, the most abundant taxa (Cyanobacteria, Sphingobacteriales and Burkholderiales) were the same in all years and have been described as typical of cryoconite holes worldwide (Ambrosini and others, Reference Ambrosini2017; Gokul and others, Reference Gokul2016; Uetake and others, Reference Uetake2016; Franzetti and others, Reference Franzetti2017a). Their relative abundance can markedly vary among geographical areas; for instance, on the Rotmoosferner Glacier (Austria), Proteobacteria were more abundant than on Forni, while Bacteroidetes were more scarce (Edwards and others, Reference Edwards2013). On the Baltoro Glacier (Pakistani Karakoram), the most abundant orders were Burkholderiales, Enterobacteriales and Sphingobacteriales (Ambrosini and others, Reference Ambrosini2017). Finally, Cameron and others (Reference Cameron, Hodson and Osborn2012) showed that cryoconite bacterial communities varied according to their geographical location on a global scale. Indeed, they found that communities from individual glaciers clustered together, probably because of similar sources of organisms and/or similar environmental selection pressures.
Our results also showed that the structure of bacterial communities can change temporally both within and between ablation seasons. Autotrophs (namely Cyanobacteria), in particular, decreased and heterotrophs (namely Burkholderiales and Sphingomonadales) increased during the melting season in both years. Exceptions to this general pattern occurred, however. For instance, the heterotrophic Clostridiales (phylum Firmicutes) were particularly abundant at the beginning of the ablation season and then disappeared in later samples in both years. Probably, this has occurred because this order is strictly anaerobic (Galperin, Reference Galperin2013; Gandolfi and others, Reference Gandolfi, Bertolini, Ambrosini, Bestetti and Franzetti2013; Musilova and others, Reference Musilova, Tranter, Bennett, Wadham and Anesio2015) and it can be outcompeted by other taxa when the microhabitat becomes richer in organic carbon, more oxygenated and less subjected to extreme conditions.
Variation in the structure of bacterial communities along one melting season was already observed in a previous work (Franzetti and others, Reference Franzetti2017a) based on a subset of the data included in the present study (i.e. the samples collected in 2013). However, this work adds to previous knowledge not only the information that a similar pattern could be observed also in 2016, but also that the structure of the bacterial communities sampled in the same month differed between years already at the beginning of the melting season, a period for which data on four different years were available. In addition, there was no evidence of an interaction effect between year and month or between year and day of melting season, which indicated that the trend was similar in both years. Importantly, these seasonal trends seem to occur rather quickly on a temperate glacier, as we observed differences even between samples collected 15 days to one another, particularly at the beginning of the melting season.
The ecological processes that affected these trends seemed mainly driven by temperature. In fact, we found that a variable (TI), which indicated periods when DD were higher or lower than what was expected on the basis of the mean seasonal temperature trend, explained a larger amount of variation in community composition than the temporal trend per se (i.e. day of melting season). In particular, abundance of Cyanobacteria decreased at increasing values of TI, while Sphingobacteriales and Burkholderiales increased. In addition, TI, explained a large amount of variation in combination with year because 2016 was significantly warmer than 2013.
Taken together, the evidences collected in the present study thus suggested that the structure of the bacterial communities differed among years already at the very beginning of the ablation season and then changed according to ‘parallel’ seasonal gradients in different years, which, probably, were mainly due to temperature and drove communities toward an increase in heterotrophic taxa and a decrease in autotrophic ones. What we observed in cryoconite holes seemed therefore similar to ecological successions occurring in areas with similar climate conditions but in different biogeographical regions, where successions tend to the same climax (e.g. a tropical forest) but species composition differs.
An alternative explanation of the observed data is that cryoconite communities follow exactly the same succession each year, but, by chance, we sampled different stages of the succession in 2013 and 2016. However, we consider this second hypothesis unlikely because in 2016 we collected samples approximately every 2 weeks instead of once per month as we did in 2013. Thus, data collected in 2016 should have revealed if communities had gone through the same (or similar) stages as those observed in 2013. For instance, RDA plots should have shown a large overlap between samples collected in the same month (Figs 3 and 4), which never occurred. Rather, samples collected in different years were always separated along the first axis. We thus discarded this hypothesis and considered the existence of ‘parallel’ trends in the variation of community structures as most likely, based on the present results.
Large variability in the structure of bacterial communities seems, therefore, to exist already at the beginning of the melting season. Admittedly, we have no information on the processes that can explain such variability. We can speculate that these differences could be due both to the dynamics that occur under the snow cover during the winter season and affect buried cryoconite bacterial communities and to bacteria inputs from the snow cover and from surrounding environments at the very beginning of each melting season. On temperate mountain glaciers, cryoconite holes rarely persist throughout one melting season because the high ablation disperses the cryoconite (Takeuchi and others, Reference Takeuchi, Kohshima, Yoshimura, Seko and Fujita2000; Franzetti and others, Reference Franzetti2017a), which can eventually form another hole (Cook and others, Reference Cook, Edwards, Takeuchi and Irvine-Fynn2016a, Reference Cookb). Even more rarely, they persist for more than one melting season. New holes thus form each year at the beginning of the melting season and an ecological succession, therefore, starts each year. Indeed cryoconite and associated bacteria remains on the glacier surface throughout winter and may form new holes as far as the conditions return favourable. Unfortunately, samples from late September of one year and late June of the following year were not available for the present study. Their collection and analysis would be an important goal for future studies in this field, as it will shed light on the processes driving the onset of new ecological successions on glaciers at the beginning of each ablation season. The present results, however, showed large differences between September and July communities, thus suggesting that large changes occurred during the non-melting season when the glacier surface is covered by snow.
Bacterial inputs to cryoconite can also largely differ between years. For instance, a recent study on snow samples collected in very different geographical areas, including Forni Glacier (R.S. Azzoni, personal communication), highlighted that snow bacterial communities can include taxa transported over long-range, probably from the area of origin of the air mass that produced the precipitation. Moreover, the relative contribution of distant sources to wind-blown bacteria that reach glacier surface may differ between years (Stibal and others, Reference Stibal, Šabacká and Žárský2012). We can, therefore, hypothesize that, at the beginning of the melting season, bacteria in the cryoconite already present on the glacier surface mix both with those in the melting snow and with those transported by wind from near-glacier environments, forming communities that markedly differ from year to year.
Another interesting finding of this and a previous study (Franzetti and others, Reference Franzetti2017a) was that we observed similar communities in samples collected during a single day, but this pattern could not be explained by an ecological succession occurring within each hole, because the intense radiation determined a continuous dismantle and reforming of holes, so that samples collected during a single day probably came from holes of different ‘ages’. The fact that at a time point during the ablation season we observed similar communities in holes of different ages suggests that the ecological succession in a new hole apparently re-started from the same stage that could be observed in the other holes present on the glacier at the same time. Again, the information collected in this study did not allow identifying the ecological processes that generated this pattern. However, some hypotheses can be put forward. In particular, we can hypothesize that ablation and runoff may play an important role in homogenizing bacterial communities. Indeed, at the beginning of each ablation season, the spread of cryoconite on the glacier surface due to the intense runoff and the inputs from snow and surrounding environments, can make the bacteria pool on the glacier surface rather homogeneous, but different from the pool that can be observed in a different year. This process can explain the differences observed among July samples of different years. Later in the season, the continuous dismantle and reforming of holes due to intense ablation and runoff may determine a continuous flow of bacteria among holes and between old and new holes, thus promoting similarity of communities observed at the same time point. In addition, melting water, on the one side, can leach debris from cryoconite holes, but it is also an important source of organic matter (Takeuchi and others, Reference Takeuchi, Kohshima, Yoshimura, Seko and Fujita2000; Stibal and others, Reference Stibal, Tranter, Benning and Rehák2008; Franzetti and others, Reference Franzetti2017a). Thus, runoff can also affect the shift from communities dominated by autotrophic organisms to communities dominated by heterotrophs.Overall, the information collected so far allows proposing a model for the processes driving the temporal trends in bacterial community structure of cryoconite holes of Forni Glacier, which can be schematically summarized in the following steps:
(1) At the beginning of the melting season bacterial populations already present in the cryoconite since the previous year, colonize the newly formed holes together with bacteria transported from near-glacier environments, present in the melting snow thaw or, maybe, transported to the glacier from far-away sources. Communities quickly change and populations more adapted to the hole conditions are selected. Clostridiales rapidly decline.
(2) During the first half of the melting season, Cyanobacteria dominate cryoconite communities, stabilize the sediment by favouring grain formation (Takeuchi and others, Reference Takeuchi, Nishiyama and Li2010) and improve the content of organic matter.
(3) Heterotrophic taxa progressively increase with the increase of organic matter due to Cyanobacteria activity and the inputs due to meltwater runoff. Their increase already starts in the first part of the melting season, but they become dominant in the second part. Temperature seems to affect these patterns, accelerating the shift toward more heterotrophic conditions in warm years.
Clearly, this model is based on data collected on a single glacier and on 2 years of data only. Indeed, as far as we know, studies aiming at investigating the temporal variation in the structure of bacterial communities of cryoconite holes on temperate mountain glaciers have been conducted on Forni Glacier only, so there is no information on whether similar patterns could be observed also on other glaciers. In addition, 2016 was warmer than 2013, so the rather strong effect of TI may be due, at least partly, to the hot weather conditions of this year. Caution is therefore necessary when generalizing these results because we are still far from understanding the ecological processes that drive the seasonal variation of bacterial communities of cryoconite holes on mountain glaciers.
SUPPLEMENTARY MATERIAL
The supplementary material for this article can be found at https://doi.org/10.1017/aog.2018.16.
ACKNOWLEDGEMENTS
Authors thank Parco Tecnologico Padano, (Lodi, Italy) for sequencing and Parco dello Stelvio-ERSAF for hosting instruments, sensors and researchers. Authors are also grateful to Arwyn Edwards and to an anonymous Reviewer for their constructive comments on a previous version of the manuscript. This work was partially funded by Italian Ministry of Research (PRIN grant 2010AYKTAB to CS), by University of Milano-Bicocca (grant 7-19-2001100-2 to RA), by Sanpellegrino S.p.A. – brand Levissima through an agreement with University of Milano. This study was also funded by DARA (Department of Regional Affairs and Autonomies) of the Presidency of the Council of Ministers of the Italian government through the GlacioVAR project. FP is supported by a PhD grant by the University of Milano-Bicocca. The authors declare no conflict of interest.
DATA ACCESSIBILITY
Sequence data are available at European Nucleotide Archive (ENA), study accession number PRJEB8981 (http://www.ebi.ac.uk/ena/data/view/PRJEB8981).


 Open access