


1. Introduction
Antarctic subglacial lakes were discovered rather by accident during a flight to determine landmarks to aid flight navigation in Antarctica (Reference RobinsonRobinson, 1960). Several airborne surveys followed and, to date, 379 subglacial lakes have been catalogued (Reference Wright and SiegertWright and Siegert, 2012). Many of these lakes were formed millions of years ago at the same time as the Antarctic ice sheet. They are sustained predominantly by basal ice melt due to pressure effects from compression by overlying ice and have, in many cases, been sealed from free exchange with the atmosphere for millions of years (Dowdeswell and Siegert, 2003; NRC, 2007). Since their discovery there has been interest in accessing these lakes and exploring them with two primary goals: to find and understand the life that may inhabit these pristine environments and to recover stratigraphic records that may be contained in the sediments.
Lake Ellsworth is a subglacial lake in West Antarctica located at 7885803400 S, 09083100400 W within the uppermost catchment of Pine Island Glacier. It is formed at the bottom of a deep trough approximately 3000–3250m below the ice surface (Reference SiegertSiegert and others, 2004; Reference Vaughan, Rivera, Woodward, Corr, Wendt and ZamoraVaughan and others, 2007). The Lake Ellsworth Project is a consortium of mainly British researchers and is an initiative undertaken by the UK Natural Environment Research Council (NERC) to sample water and sediment in Lake Ellsworth (Reference SiegertSiegert and others, 2012).
There is still some uncertainty whether subglacial lakes exist in an open or closed system (Reference Brito, Griffiths, Mowlem and MakinsonBrito and others, 2013). Given the pristine state of these lakes, both the Scientific Committee on Antarctic Research (SCAR; Reference AlekhinaAlekhina and others, 2011) and the US National Research Council (NRC) Committee on Principles of Environmental Stewardship for the Exploration and Study of Subglacial Environments (CPESESSE) (NRC, 2007) recommend that gaining access to subglacial lakes should not contaminate the existing ecosystem and, in particular, that equipment entering the lake should not contain in excess of the minimum concentration of microbes in the basal ice being passed through (Recommendation 7), suggesting, based on evidence available at the time, that this was in the order of 102 cellsmL–1 (see also Reference SiegertSiegert and others, 2012).
At present, an attempt at clean access to Subglacial Lake Ellsworth has been made using a hot-water drilling system (Reference MakinsonMakinson, 1994). This drilling technique uses recirculated meltwater to form a borehole by pumping it through a nozzle as this is progressively lowered through the ice. The technique involves the formation of a reservoir chamber close to the glacier surface but below the predicted hydrostatic pressure head of the lake. Two shafts connect with the chamber from the surface, one extending to the lake for sampling, the other terminating in the chamber through which meltwater is drawn up to supply the drilling nozzle. The hydrological water level of subglacial lakes can vary, but it is expected that the upper section of the lake access shaft will be air-filled, and in the case of Lake Ellsworth this is estimated to be - 3 0 0 m (Reference Vaughan, Rivera, Woodward, Corr, Wendt and ZamoraVaughan, and others, 2007; Reference SiegertSiegert and others, 2012). This shaft is susceptible to contamination from airborne bacteria that can drop in from machinery, personnel and the environment during the drilling process before the shaft is sealed off from the environment with an airlock. Between installing the airlock and introducing presterilized equipment it is imperative to take measures to decontaminate this space.
This paper presents work undertaken to design an ultraviolet (UV) reactor that can be lowered down the shaft to decontaminate the air-filled section once it has been isolated from the external environment by an airlock and prior to the introduction of any sampling equipment.
2. General Concept
The design of the reactor was based around cylindrical UV reactors used to disinfect wastewater (Reference Qualls and JohnsonQualls and Johnson, 1983; Reference Bekdash, Kurth and SolomonBekdash and others, 1996; Reference Gardner and ShamaGardner and Shama, 1999; Reference BoltonBolton, 2000) since the constraining aperture for introducing equipment into the borehole was a circular hole in the base of a sterile airlock and because the borehole shaft would be roughly circular. This aperture was 20.0 cm in diameter. All sampling equipment entering the borehole had to pass this restriction. The reactor unit was to be lowered down the borehole on a conducting tether terminating in a connector common to all powered equipment deployed down the shaft.
The design paradigm was to create a high-output UV source using a quartz glass cylinder that had been reserved for the consortium, being of an appropriate length and diameter to comply with the constraints of the airlock (personal communication from N. Rundle, 2012). The output needs to be high enough to deliver a sufficient UV dose efficiently within time allocated to it out of the time available to achieve all the sampling objectives. Calculations are presented further below that help quantify expected doses in terms of lamp output and target exposure times. The apparatus also required a way of detecting when the unit contacted the water surface at the end of the air-fill section of the shaft and needed protection from water ingress should it be immersed at this point.
3. Design Considerations
3.1. Quartz glass supply
The quartz glass cylinder, the sleeve, was an ‘end of line’ off-the-shelf product 95.3 cm long and of varying outer diameter between 16.82 and 16.88 cm. It had a nominal 5 µm wall thickness along the majority of its length. Dimensions can vary considerably with this product.
Because drawing quartz glass of this size is a less than precise art, and the entire apparatus was to be designed around a nominally standard piece of quartz, fitting tolerances between the flanges and glass, to accommodate 0-ring seals, were kept relaxed so that if at some point in the future a replacement was required there was a good chance it would fit.
The time frame set by the consortium made this a high risk to the project since no spare was available within the deadlines for shipping to the Antarctic. Consequently the quartz sleeve was treated with extraordinary care to protect it from physical damage.
Fortunately, quartz is more robust from a thermal perspective and has an extremely low thermal coefficient of expansion, 5.5 x 10⁻⁷ºC-1 (20-320ºC), with an ability to undergo large, rapid temperature changes without cracking (Reference De Jong, Beerkens, Van Nijnatten, Le Bourhis, Ullmann, Gerhartz, Yamamoto, Campbell, Pfefferkorn and RounsavilleDe Jong and others, 2000). This gave us assurance that, while it may be relatively hot through absorption of heat produced by the UV lamps, the quartz would not shatter and should remain intact even if entering near-freezing water at the hydrostatic pressure head.
3.2. Power
Based on high UV output, price, physical dimensions and immediate availability, 12 low-pressure mercury (LPM) tubes could be accommodated within the quartz sleeve, controlled by electronic dual lamp ballasts housed in another section of the lamp assembly. This determined the power requirement for the reactor. Power was supplied to the unit by a Glassman LP6000 power supply through 4000 m of multicore tooling cable (Cortland Fibron BX) in the form of a d.c. voltage at a nominal 8.0 A. Because of the voltage line loss over that distance, d.c. power was fed at 240 V to achieve a starting voltage of 180Vd.c. at the reactor to power the ballasts and the lamps. The advantage of using electronic ballasts is that they can operate on a d.c. voltage, obviating the need to convert the supply to a.c. This simplified the circuit design considerably.
When a fluorescent lamp ‘strikes’, the ionizing mercury vapour forms a low-impedance pathway to the high voltages supplied from the ballasts (Reference GluskinGluskin, 1999). This effect momentarily draws high current that settles to a lower usage, regulated by the ballast, once the lamp has struck. If all six ballasts struck their lamps simultaneously, the current required would exceed what the power supply was capable of supplying. However, the simple power distribution system was, in a sense, self-regulating because the time constants for components within the starting circuits of individual ballasts will be slightly different as a result of resistance and other manufacturing differences. Consequently, the ballasts do not draw the available current evenly at start-up. Those not receiving sufficient current will be unable to strike until other ballasts regulate their lamp current to a lower demand once struck, and free resources. This produces, de facto, a sequential start-up.
3.3. Temperature management
UV output from the lamps is temperature-dependent, and peak output of the lamps occurs at a working temperature corresponding to the lamp wall temperature, ~35ºC. Lamp output efficiency drops at temperatures over 48-50ºC, and operating lamps outside the designed temperature range can reduce their lifespan as well as their output. This drop in efficiency also causes the ballasts to run hot (Reference ClancyClancy, 1993; Reference Graovac, Dawson, Fila and CormackGraovac and others, 1998).
Under normal operating conditions, fluorescent lamps rely on airflow over the surface to prevent heat building up. Additionally the ballasts have a thermal cut-out at 70ºC and require protection from temperatures in excess of this. Consequently, because the lamps were in a sealed enclosure, one factor driving the design was to provide a means of losing waste heat to the environment. A large temperature gradient between the operating environment (~–188C) and the reactor should work in the design’s favour.
To aid the dissipation of heat, ducts and a set of internal concentric tubes allow cooling air to flow through the inside of the reactor (see Fig. 1). The inlet ducts on the lower flange were angled so there would be forcing of influent air as the reactor descended the shaft. The centremost tube conducted cables for power and signal while the surrounding tube provided the space through which cooling air could flow. The ballasts were positioned in the lower, coolest, part of the assembly. The central (cable) duct was sealed at either end by a gland (IP68) to prevent water ingress to the electrical spaces should the lamp be immersed in water at the bottom of the air-filled section of the borehole.
Fig. 1. Three-dimensional CAD cut-away drawing showing major structural and electrical elements of the reactor assembly, as well as indicating the cooling airflow through the unit during operation.
3.4. Water contact switch
Since the reactor was required to transit the entire airspace to the air/water interface it was anticipated it would come into contact with water. This defined a requirement to make provision for this eventuality. A common method for doing this is to use a simple conductivity sensor, formed of two exposed electrodes energized with a voltage between them as a water contact switch connected to a meter or alarm of some sort in the operator area.
It was anticipated that the conductivity of the borehole water would be low. Previous studies indicate that the glacial meltwater is likely to be between the conductivity of distilled water (10μScm–2) and tap water (100μScm–2), or 0.1-0.01 MΩ (Reference Gurnell and FennGurnell and Fenn, 1985; Reference De Mora, Whitehead and GregoryDe Mora and others, 1994; Reference Vandal, Mason, McKnight and FitzgeraldVandal and others, 1998; Reference LyonsLyons and others, 2013). Combined with a tether resistance of 200Ω (personal communication from E. Waugh, 2012) this would give a total resistance of 0.1002 MΩ between two contacts 1 cm apart assuming the lower value is chosen. A supply voltage of 200V d.c. would induce a current of 1.9 mA to flow between the two terminals on meeting the water surface, an easily detectable current with most modern metering equipment. While these currents are low compared with shorting in more conductive environments (e.g. sea water), it is the experience of one of the authors on other tethered sampling systems over longer cable lengths and with similar d.c. input voltages, that currents exceeding 1 A can be drawn in the event of a short.
While not used in the final assembly due to a last-minute breakage, provision for a water contact switch was made by installing appropriate electrical connections and a suitably tapped penetration of the lower flange to mount a two-pin male connector (Teledyne Impulse XSG-PBCLM) on the base plate of the lamp unit to act as a simple water contact switch, with the option to interface with more sophisticated detection systems as an alternative for non-conductive environments. The penetration was subsequently blanked off and the risk of water contact managed through other means (see Section 3.7).
3.5. Light output calculations
It is established that exposure to UV light inactivates bacteria (Reference AndrewAndrew, 2005; Reference Labas, Brandi, Martín and CassanoLabas and others, 2006). DNA strongly absorbs radiation at wavelengths in the vicinity of 200-250 nM, changing the mode of operation of nucleic acids in the organism and disrupting their ability to propagate. They become biologically inactive (Reference AndrewAndrew, 2005; Gayán and others, 2011). At shorter wavelengths secondary effects can also occur when ozone and hydroxyl groups can form that have an additional germicidal effect (Reference Bekdash, Kurth and SolomonBekdash and others, 1996).
UV radiation at these wavelengths can be produced by various methods, striking an arc through mercury vapour at low pressure (Reference Bekdash, Kurth and SolomonBekdash and others, 1996; Reference HeeringHeering, 2004), pulsed UV sources (Reference Bohrerova, Shemer, Lantis, Impellitteri and LindenBohrerova and others, 2008), cold plasma jets (Reference Abramzon, Joaquin, Bray and Brelles-MarinoAbramzon and others, 2006) and deep-UV light-emitting diodes (Reference YagiYagi and others, 2007; Reference Shur and GaskaShur and Gaska, 2010; Reference Bowker, Sain, Shatalov and DucosteBowker and others, 2011).
In the present case, LPM vapour lamps (GE T8 G13 base 55 W Germicidal lamps - Primark G55T8-GE), in association with electronic dual lamp ballasts (2 x 55 W Tridonic Electronic ballasts - Primark PC2/55TC-LBE) were chosen for their size, availability and relatively high UV output (18W at 254 nm) compared with other available lamps.
The reactor was formed from a set of individual lamps arranged in a circle around a central column. Consequently any point above the reactor surface will be exposed to the output of 6-7 lamps of the full complement of 12, and will be shadowed from the full output of all but the adjacent lamp.
Radiant energy passing through a three-dimensional point, or volume element, from all directions is defined as the fluence rate for that point and is expressed in Wm–2 (Reference BoltonBolton, 2000). UV dose, or fluence, through this volume element is the fluence rate multiplied by the irradiation time and is given in J m–2 (Reference BoltonBolton, 2000).
Reference Qualls and JohnsonQualls and Johnson (1983) and Reference BoltonBolton (2000) give equations for calculating UV fluence and dose from cylindrical reactors with linear light sources based on the multiple point source summation (MPSS) method (Reference Jacobm and DanoffJacobm and Danoff, 1970; Reference Qualls and JohnsonQualls and Johnson, 1983; Reference BoltonBolton, 2000). Under MPSS a linear lamp is divided into smaller subunits, and the radiant power of the source divided evenly between them. Their individual contribution to the fluence rate through a volume element is calculated taking account of their distance from, and angle of incidence to, the volume element. These individual results are then summed to determine the total fluence rate at the volume element.
Both Reference Qualls and JohnsonQualls and Johnson (1983) and Reference BoltonBolton (2000) assume a single linear lamp; however, in the present case, multiple linear lamps contribute variously to the UV fluence at the volume element. Accordingly, for the purpose of calculation, it was assumed that the lamp closest to the chosen volume element contributed 100% of its output, each lamp of the pair bracketing this lamp contributed 75% of its output (i.e. 2 x 0.75 = 1.5 lamps for the pair), and the next pair contributed 45% each (2 x 0.45 = 0.9 of a lamp for the pair). The third pair is taken to be completely shadowed by intervening lamps from the measurement point and was not accounted for in this simplified estimation but will contribute to the reflected irradiative background.
Under these working assumptions, the output from each lamp was calculated separately with the MPSS method using 5 cm long lamp subunits, for a volume element 9cm from the reactor surface and midway, longitudinally, along the lamp. This point was chosen because it was the distance where the wall of the borehole would be expected to be during deployment. These individual lamp outputs were then combined to estimate the total fluence rate through the volume element. The calculation was run twice, once using the Reference BoltonBolton (2000) and once using the Reference Qualls and JohnsonQualls and Johnson (1983) equation as a means of sense-checking the magnitude of the result.
Link: Equation (1) was used first (simplified after Reference BoltonBolton, 2000) to calculate the contribution of each subsection of lamp to the fluence at the volume element.
where E' is the fluence rate at a radial distance x and a longitudinal distance H above the centre of the lamp. L is the length of the lamp (95.3 cm) and Φ is the source’s radiant power (18W at 254 nm).
Thus, for each lamp the output is given as the sum of these point sources:
To calculate total reactor output, these individual lamp results were combined as follows:
therefore
This model neglects reflection and refraction by the quartz tube, and transmission loss through the quartz is accounted for after the fluence rate calculation as recommended in Reference BoltonBolton (2000) by degrading by 10%.
The next equation used was (Reference Qualls and JohnsonQualls and Johnson, 1983)
Equation (2) gives the intensity (I) at a point (R, Z C) near the lamp (the volume element) from a point source, Z L, from the base of the linear lamp. The term a is the absorbance of the medium between the lamp surface and the volume element, which was treated as zero since the transmission loss through dry air over the short distances involved is zero. After the calculation, as in Eqn (1), account was taken of the 10% transmission loss through quartz by multiplying the result by 0.9.
The total intensity at point I(R,,ZC) is the sum of the contributions of each point source (at each Z L) over the source length,

and the total fluence through a volume element is calculated for the pairs of lamps capable of directly radiating the area, so
Therefore
Both equations agreed, within a small margin, with each other at 13.23 and 14.06 mWcm–2 respectively.
3.6. Dose
As the lamp is lowered down the shaft, the UV dose delivered to the borehole walls depends on the rate at which it is lowered. The exposure period begins with the lower part of the lamp passing the volume element and ends as the upper end passes it by. The time nominally allocated to the borehole disinfection stage was 30min and the borehole was calculated to be air-filled for the first 270-300 m (Reference SiegertSiegert and others, 2012). In order to cover this distance in the allocated time, the lamp needs to descend 1 m(6s)–1,

and exposure time is given by the length of the incandescent part of the reactor multiplied by the descent rate. Thus
is the dose for a volume element on the borehole wall duringthe downward transit of the reactor through the airspace at the target descent rate. This rate was chosen so an effective dose could be delivered on the downward transit only, to guard against the small risk of the lamp being extinguished on contact with the water at the hydrostatic head.
The dose required for disinfection will vary depending on the organism under consideration (Reference Qualls and JohnsonQualls and Johnson, 1983; Reference Bekdash, Kurth and SolomonBekdash and others, 1996; Reference AndrewAndrew, 2005; Reference Guivan, Kamikozawa, Kurokawa, Motomura, Kadowaki and JinnoGuivan and others, 2010). Furthermore, disinfection is not an absolute term but a statistical concept representing a particular level of microbial inactivation, most commonly interpreted as a reduction in the ability of bacteria to form colonies.
‘Complete destruction’, defined by the US Environmental Protection Agency and reviewed by Reference Bekdash, Kurth and SolomonBekdash and others (1996), is a log3 reduction (99.9% inactivation) and requires doses of 3.4-26.4 mJ cm–2 for most common bacteria (Bacillus subtilis is commonly used as the definitive test subject because it is one of the most persistent types). Mould spores are the hardest to inactivate, some requiring >300mJcm-2 to achieve log3 inactivation (Reference Bekdash, Kurth and SolomonBekdash and others, 1996). Log3 inactivation is considered a safe level for drinking water from a municipal supply, and the standards set for prevention of forward contamination might be expected to be more stringent. As previously mentioned, the CPESESSE recommends not exceeding 102 cells mL–1 based on the basal ice concentrations found in accretion ice at Vostok Subglacial Lake (Reference ChristnerChristner and others, 2006). Interestingly that study found that the bacterial density of the accretion ice was 2-7 times greater than that of the overlying glacial ice, implying a lake source for the bacterial carbon found within (Reference ChristnerChristner and others, 2006). Reference PriscuPriscu and others (1999) found concentrations between 2.8 x10³ and 3.6 x10⁴ cells mL–1 at 3590 m below the surface from the same site ~500 m higher up the core.
A number of studies have sought to characterize the microbial communities in different surface environments on the Antarctic continent, and glacial ice in general, though mostly these deal with community diversity and few report cell density unless these are for soil bacteria or those found in liquid water such as melt ponds (Reference Karl, Bird, Bjorkman, Houlihan, Shackelford and TupasKarl and others, 1999; Reference PriscuPriscu and others, 1999; Reference Christner, Mosley-Thompson, Thompson, Zagorodnov, Sandman and ReeveChristner and others, 2000, Reference Christner, Mosley-Thompson, Thompson and Reeve2001; Reference JungblutJungblut and others, 2005; Reference Yergeau, Newsham, Pearce and KowalchukYergeau and others, 2007; Reference LanoilLanoil and others, 2009). Bulat does report cell concentrations from snow and ice above Vostok Subglacial Lake from the surface to ~100 m below the surface, giving values ranging from 0.02 to 1.9 cells mL–1 (Reference Bulat, Alekhina, Marie, Martins and PetitBulat and others, 2011), indicating that cell densities may already be below those considered acceptable by the CPESESSE guidelines, and indicates that the major sources of potential contamination may well be brought to the site by the drilling and scientific activities themselves.
One wide survey of microbial communities across a range of habitat in Antarctica has shown the Ellsworth Mountains area to be a separate biogeographic region characterized by extremely low nutrient input and exposure to high UV levels during the summer (Reference Yergeau, Newsham, Pearce and KowalchukYergeau and others, 2007). Bacterial counts and biomass were low, consistent with the observation of Reference Bulat, Alekhina, Marie, Martins and PetitBulat and others (2011) at Vostok, and the community structure is narrow, skewed toward dominance by Bacteroidetes of the order Sphingobacteri-ales, the vast majority of these being related to the genus Chitinophaga (Reference Yergeau, Newsham, Pearce and KowalchukYergeau and others, 2007). The order Sphingobacteriales are the dominant bacterial group in Antarctic microbial soil communities and are common globally (Reference RoeschRoesch and others, 2012).
Reference Yergeau, Newsham, Pearce and KowalchukYergeau and others (2007) surmised that these species dominate because they possess a combination of environmental hardiness and a specialized metabolism more adapted to the low nutrient availability. Potentially these resistant characteristics include a higher than normal resistance to UV radiation given the high UV regime in this environment, a factor that tends to skew community structure towards resistant strains (Reference Manrique, Calvo, Halac, Villafaññe, Jones and HeiblingManrique and others, 2012).
From these preliminary calculations the design would appear to exceed a log 3 reduction when coupled with a descent rate of 10 m min–1. Further, given the low cell density that might be expected in this area based on surface densities given in the literature, such a reduction would serve to maintain viable cell density below the 102 cells mL–1 recommended by the CPESESSE. A further safeguard in the spirit of the committee’s Recommendation 13 would be to sample and determine bacterial cell density directly at the locale prior to conducting a UV reactor deployment. Using the calculated UV flux given in this paper, a lowering rate and exposure time could easily be determined to deliver the appropriate dose should local bacteria densities exceed the recommended guidelines or exogenous sources lead to this situation arising.
While the primary purpose of this reactor was to disinfect the walls and airspace of the borehole, it is interesting to briefly contemplate the transmission of UV radiation into the surrounding snow and ice since material dislodged from the borehole walls, if heavily contaminated, may pose a possible vector for forward contamination if carried into the lake by sampling equipment. A limited survey of the extensive literature on the subject indicates that compacted glacial ice is fairly transparent to short-wavelength light with an absorption coefficient of 0.092 m–1 (transmission maximum) at 400 nm, climbing to an absorption coefficient of 0.665 m–1 at 250 nm and attenuating strongly below 170 nm (Reference Perovich and GovoniPerovich and Govoni, 1991). Reference Warren, Brandt and GrenfellWarren and others (2006) reported the difficulty in even obtaining transmission coefficients in lake ice over path lengths of 0.5 m due to the optical clarity of the ice at wavelengths down to 313 nm. Snow offers a slightly more complex optical environment due to its granular nature and is a highly scattering medium attenuating transmission in the visible spectrum and favouring shorter-wavelength transmission (Reference Warren, Brandt and GrenfellWarren and others, 2006; Reference PerovichPerovich, 2007). Additionally there are structural differences between new snow, characterized by a combination of needles, rounded grains and small plates, and old snow which is primarily composed of rounded grains, and these affect attenuation and scattering. New snow has lower transmission coefficients than old snow, mainly due to high reflectance. Bubbles and particulate material will also attenuate transmission (Reference Warren, Brandt and GrenfellWarren and others, 2006; Reference PerovichPerovich, 2007; Reference Rasmus and HuttunenRasmus and Huttunen, 2009). From these studies and the calculated output of the UV reactor, we might expect log 3 deactivation to occur a reasonable distance into the surrounding ice, less so in the upper parts of the borehole where the structure is predominantly old snow, and least at the surface, where the snow will be newest. This suggests recommending a methodology of differential lowering speeds depending on depth if a spatially uniform UV penetration to any chosen level of deactivation were to be achieved over the entire length of the shaft to the hydrostatic head.
3.7. Deployment risk assessments
The lamp is the first component of the scientific payload to enter the borehole after it has been formed. Consequently it is a test case for the subsequent deployment of other equipment. It is uncertain where the actual level of the water will be in the shaft since that will depend on a number of difficult-to-calculate factors that will determine the actual head of the lake once the ice barrier had been broached. The head pressure will be a combination of the density of overlying ice, influent/supply water pressure and pressure-dissipating mechanisms within the hydraulic system. Working calculations by team engineers estimate the water level will stabilize 270–300 m below the surface of the ice (Reference SiegertSiegert and others, 2012).
The UV lamp assembly is assigned a nominal IP68 rating based on the specification of components used at its most vulnerable points. These are the gland seals around the central cooling shaft and its concentric cable duct. Under normal circumstances these should be able to withstand a brief immersion to 1 m but they are not rated for greater depths, nor can they be relied on for any length of time. No seal is entirely reliable and they become less so as temperatures drop, O-ring seals harden and metals contract. Consequently it was considered prudent to avoid immersion of the lamp at the bottom of the shaft if at all possible.
As reported in Section 3.4, the original design allowed for a water contact switch to alert personnel when the base of the lamp made contact with water. In the event of this becoming inoperable, reserve measures and contingencies needed to be available to avoid more than partial immersion of the unit.
The first feature in favour of mitigating the risk is that the lamp assembly displaces more than its own weight in water and would float provided the seals do not leak. However, the unit is attached to heavy tooling cable, which will force the unit further down if it continues to be paid out, resulting in an unplanned immersion.
Another available safeguard is the presence of a load cell on the outboard sheave of the deployment winch which has sufficient sensitivity to detect the load coming off the cable as the UV lamp assembly became buoyant. The use of the load cell, however, relies on the winch operator being aware of the change in the numerical readout on the display at the time the unit enters the water and becomes buoyant. This is aided by a line-out measurement taken from a counter that records the number of rotations of the outboard sheave, allowing the winch operator to know exactly how much cable has been paid out so they can be extra vigilant when approaching the depth of the calculated pressure head.
Based on all sources of information, procedures were derived and formal risk assessment carried out. Probability values were then assigned to the relative likelihood of certain scenarios playing out. These are represented in the fault tree presented in Figure 2.
Fig. 2. UV-lamp fault tree and final relative probabilities.
A fault tree is a well-known method for modelling and estimating the reliability of a system where the likelihood of system failure depends on the likelihood of several potential modes of failure (Reference O’ConnorO’Connor, 2005). In addition to providing a visual, easy-to-understand interpretation of how a failure mode may propagate in the system, a fault tree also uses sound probability theory to compute the likelihood of the top failure event ever taking place.
In such diagrams, the logic probability functions are captured in ‘and’ or ‘or’ gates. An ‘and’ gate represents the scenario where all base failure modes need to occur in order for the top failure event to realise; an ‘or’ gate represents the scenario where only one failure event needs to occur in order for the top failure event to realise. Figure 2 shows that the top-level failure event, failure to maintain the pressure head over the lowest seal at < 1 m below water level, can be caused by instrument failure or human error. Based on the assessments provided for each failure mode, we were able to estimate the likelihood of failure to keep the pressure head 1 m below water level as 0.029. This equates to a chance of approximately 1 in every 34 deployments. Human error is the most likely failure mode at level 1. The most likely causes for human error are: (1) operator forgets to zero the wire counter and (2) operator fails to notice the drop on the load cell by being distracted, or because there is too much noise in the load-cell output to distinguish a signal originating from the change in load from the background fluctuation in the display.
The fault tree contains only ‘or’ gates. Failure to keep the pressure head <1m below water level can be caused by any of the eight base failure modes. As a result, the reactor deployment sequence was defined by taking into account mitigation actions for these base failure modes at different phases of the deployment (personal communication from K. Saw, 2012).
4. Detailed Description of the Design
The lamp’s design can be summarized as being a single quartz glass tubing section with a chamber either end and two, internal, concentric aluminium tubes providing a water-resistant air duct up the middle of the structure and ducting for electrical cables down the centre of the assembly (see Fig. 3). Arranged radially around the air duct and within the wall of the quartz tube are 12 T8 fluorescent tubes emitting 18 W of UV radiation (254 nm) each. The top flange accommodates a multi-way bulkhead connector supplying power and signal connections from the surface. These are internally routed via a four-conductor cable to the bottom chamber that houses six dual-lamp electronic ballasts. These are supplied with a d.c. voltage of at least 180V d.c. Incoming power is connected via multi-pole bulkhead connectors in the lower section of the bottom chamber to distribute power between the six ballasts that control two low-pressure mercury lamps each. Multiple solid-core switchgear wires returned power up the central conduit from each ballast to complete the lamp circuit. Each conductor in this loom has a cross-sectional area of 1 mm2 and is capable of conducting 15 A at 600 V.
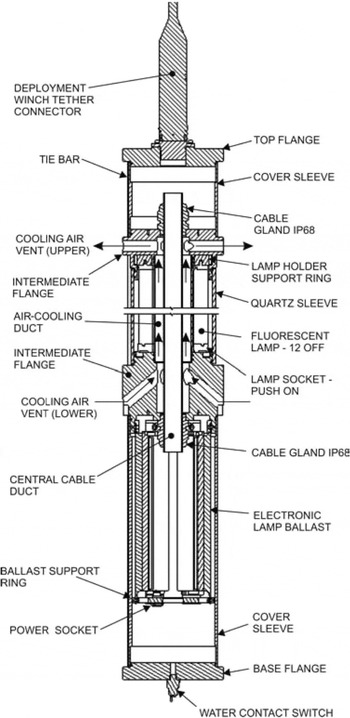
Fig. 3. Final UV lamp assembly.
Electrical connections are isolated from chassis components by 30% glass-filled PEEK insulating inserts to prevent any bare wires from contacting the metal casing of the assembly. The entire circuit was protected at the power supply by residual current detection devices and connection to a common ground.
The wiring was modularized to allow disassembly of each end separately, should any maintenance be required, with in-line and bulkhead connectors at strategic points.
5. Discussion
This UV reactor was designed and built so that the Lake Ellsworth Consortium had a means of borehole disinfection to meet the aims, and the spirit, of the SCAR and the NRC principles of environmental stewardship for the exploration and study of subglacial aquatic environments. These principles call for contamination reduction technology at every step of the lake access process (Antarctic Treaty Consultative Parties, 1991; Reference SiegertSiegert and others, 2012). Contamination, whether chemical or biological, has the potential to alter these environments, confound interpretation of samples and limit the degree to which we might understand the nature and functioning of these environments (Reference SiegertSiegert and others, 2012; Reference PriscuPriscu and others, 2013; Reference WadhamWadham, 2013). The implementation of the consortium’s decision to provide this technology was undertaken late in the preparation stages of a 2012 attempt to access and sample the lake. As a result, this reactor is a form of rapid prototyping and no time was available following assembly to comprehensively test the apparatus other than to confirm it operated. The reactor was run for a short period (60 min) in a refrigerated container (-20°C) after equilibrating to this temperature overnight. This test was conducted using the same power supply and a similar test cable, proving that the unit would strike up and run in temperatures equivalent to Antarctic ambient temperatures, though no attempt to measure the fluence rate could be made due to a lack of calibrated test apparatus or time to conduct an exhaustive series of measurements.
While lake access was not successful on this occasion, the scientific objectives remain relevant and it is expected that another attempt will be made in the future, so there may be the opportunity to conduct more comprehensive tests at a later date under simulated environmental conditions.
Refreezing of an ice hole can take just a few tens of hours depending on the diameter and depth of the hole (Reference MakinsonMakinson, 1994). This leaves limited time to prepare for clean access to the borehole once drilling has been completed; UV disinfection of the air-filled headspace is a component of that process. Therefore it was an important feature of any disinfection system that an effective dose is delivered in the shortest time possible. The calculations conducted in this paper indicate that a transit time of 30 min, in addition to a recovery period, would be sufficient to deliver a dose far in excess of that required to achieve a log3 disinfection for most common bacteria. This was achieved at relatively low cost with commercially available UV sources. Their availability fitted well with the short production time frame.
Research conducted, in preparation for this project, into other technologies indicates pulsed UV sources are extremely effective (Reference Bohrerova, Shemer, Lantis, Impellitteri and LindenBohrerova and others, 2008), and medium-pressure xenon and iodine vapour lamps, which concentrate output at ~253.7 nm (the most potent wavelength for bacterial inactivation), are also proving more effective than LPM lamps without the hazards inherent in using mercury (Reference Guivan, Kamikozawa, Kurokawa, Motomura, Kadowaki and JinnoGuivan and others, 2010). The pulsed UV methods are of particular interest. The dose from a pulsed UV source is of high intensity on a very short duty cycle that can be repeated until the required dose is achieved. As a result, these types of lamp are not prone to the same accumulation of heat as are the LPM tubes, and through control of the pulse sequence there is the potential to excite vulnerable molecules and proteins at frequencies, and in sequences, that maximize the potential for disruption. However, both these systems had much greater lead times, and would have required significant re-engineering of the light source and power supply to fit within the geometric constraint of the sterile airlock delivery system. On balance, then, not only was the system presented in this paper far less expensive than other options, it required less re-engineering of primary components and could be delivered in a much shorter time frame.
There are currently several unknowns on the performance of the lamp, and a comprehensive test programme would be a logical next step in proving the efficacy of this technology in this deployment scenario. As mentioned, UV output is dependent in part on temperature and we did not have the opportunity to characterize the output under a representative range of temperature. The balance between the endogenous heat output of the lamp and the heat dissipation measures would determine the effect this has on the UV dose capable of being delivered. Consequently, we must, for the time being, rely on the generosity of our safety factors for surety that we can achieve effective disinfection doses.
It would also be useful to confirm the accuracy of our calculations in the context of work done recently by Reference Li, Qiang, Bolton and BenLi and others (2012, Reference Li, Qiang and Bolton2013) that supports the assumption made in this paper that adjacent fluorescent tubes in a circular reactor shadow volume elements from the full output of all lamps. Reference Li, Qiang, Bolton and Ben2012Li and others (, Reference Li, Qiang and Bolton2013) modelled and experimented with a three-lamp scenario and it would be interesting to extend and compare their findings to the lamp described in this paper through a series of measurements under controlled conditions.
We believe there is the potential to repurpose this low-cost technology to be a component of systems for clean access to other pristine environments, particularly, though not exclusively, to scenarios involving a frozen fluid. When an internal volume requires disinfection, and access to the volume is confined, this apparatus could easily be applied, especially when an annular design provides the most effective way of accessing a space and delivering a UV dose.
Acknowledgements
We acknowledge the numerous friends, colleagues and reviewers who contributed to improving the manuscript with comments and suggestions, in particular James Wyatt for providing the illustrations of the equipment, Nicholas Rundle for formulating the original design brief, and Medtech Design Services Ltd for draughting support during the project.


