

4.1 Introduction
The public research system in the United Kingdom is composed of many universities and a smaller number of public research institutes. Over time, knowledge transfer has been institutionalized as a key mission of public research performers, as important as their longstanding commitment to research (Reference Lockett, Wright and WildLockett et al. 2014). As in other countries, the institutionalization of the knowledge transfer mission has largely been driven by policy incentives (Reference Sánchez-BarrioluengoSánchez-Barrioluengo 2014; Reference Pinheiro, Langav and PausitsPinheiro et al. 2015). The purpose of this chapter is to analyze, on the one hand, the United Kingdom’s institutional setup (including the characteristics of the country’s public research system and of the policies implemented therein), and, on the other hand, the variety of knowledge transfer activities undertaken and of governance models adopted in order to carry them out.
The United Kingdom provides an interesting case study for several reasons. First, the UK public sector research system has a variegated structure that can support a variety of models of knowledge transfer engagement. Indeed, the wide variety of knowledge transfer activities undertaken, and the diversity of approaches adopted, suggests that institutions pursue the strategy of knowledge transfer engagement that best suits their comparative advantages. This also leads to strong path dependency and a symbiotic relationship with the underlying socioeconomic structure of the country and its regions. Second, as UK universities have operational flexibility reminiscent of that of the United States of America (U.S.), but are also dependent on public funds very much like their European neighbors, this case can offer insights for countries with predominantly publicly-funded systems that intend to adopt an incentive-based approach to policy. The main policy tool used by the UK government to foster university–industry interaction and knowledge transfer has been the provision of performance-based funding in order to create a financial incentive for universities to engage in knowledge transfer activities and achieve measurable results that can be rewarded economically. Moreover, since knowledge transfer activities are income-producing in themselves, in a period of prolonged decline in public funding, universities have had strong incentives to engage in knowledge transfer activities irrespective of the presence of policy schemes. Consequently, there seems to have been a reorientation of the public science system toward more commercializable research. In turn, this raises the question whether the UK system is generating enough basic research on its own to keep it at the science frontier and make it possible to quickly absorb and exploit new technology. Investment in basic science – the original argument for public funding of education – could get lost in the thrust of policy to promote research commercialization.
This chapter is structured as follows. Section 4.2 provides a brief overview of the organization of the United Kingdom’s public research system. Section 4.3 describes the historical evolution of policies in support of university–industry knowledge transfer in the United Kingdom, considering both the evolution of the institutional setup and of the supply- and demand-side policy instruments implemented. Section 4.4 examines the variety of knowledge transfer channels used by universities and public research institutes, with a particular focus on their performance in intellectual property (IP) commercialization, and compares the differential performance of universities and public research institutes in knowledge transfer, investigating some possible causes. It also considers the demand for university knowledge from the private sector. Section 4.5 delves into the institutional infrastructures that universities have set up to manage their knowledge transfer activities, and their practices. Finally, Section 4.6 concludes with some policy lessons.
4.2 Universities and Public Research Institutes in the United Kingdom
The earliest universities in Britain were founded in the Middle Ages, with Cambridge’s charter dating back to 1209. Only a handful of institutions were created between then and the early nineteenth century, which saw the progressive establishment of many further education colleges that provided vocational training in a range of subjects, including teaching (teacher training colleges), various branches of engineering or agriculture (polytechnics), and the arts (arts colleges). These institutions (which were part of the public sector under the control of local education authorities, and sometimes religious foundations) contributed collectively to a binary higher education system, with universities educating the elite and colleges providing vocational education for the middle class.
This system began to change in the 1960s, with a shift toward mass university education thanks to the creation of twenty-five new universities. This trend received further impetus in 1992, as several existing polytechnics gained degree-awarding powers,Footnote 1 and the process has continued since then with the transformation of teacher training colleges, art colleges, and other colleges into universities. Today, the UK university system includes 161 officially recognized degree-awarding higher education institutions. Figure 4.1 shows the cumulative number of universities founded since 1900. The 1960s, 1990s, and 2000s saw the largest increases in the number of institutions.

Figure 4.1 Cumulative number of degree-awarding institutions active since 1900
Eighty-three percent of institutions are based in England (of these, one-third are in London), 10 percent in Scotland, 5 percent in Wales, and the remaining 2 percent in Northern Ireland. Their nature is varied: some universities specialize in world-class research and others (particularly those that were previously focused on vocational education) in specialist training often closely linked to local industry. The UK university system is traditionally public, but particularly since the 2000s, a small but growing number of entirely private universities have emerged (the first of these, the University of Buckingham, was founded in 1973). Even those universities that receive most of their funding from the government are not formally part of the public sector as they are in some countries (such as in Germany, where academics are civil servants). Instead, UK public universities are regulated as nonprofit institutions governed by the Charities Act 2006, and, as such, enjoy considerable operational autonomy.
The United Kingdom’s science, research, and higher education policy is the responsibility of the Department for Business, Energy, and Industrial Strategy (BEIS) and of the Department for Education (DfE). Funding allocation is devolved to the higher education agencies of the four countries of the UK: the Higher Education Funding Council for England (HEFCE), the Department for Employment and Learning Northern Ireland (DELNI), the Scottish Funding Council (SFC), and the Higher Education Funding Council for Wales (HEFCW). Each is responsible for funding universities’ ordinary teaching and research activities as well as for implementing policy instruments in support of knowledge transfer engagement.
Research and teaching are funded through separate streams. Since the mid-1980s, recurrent research funding is distributed on a quality-related basis building on a periodic nationwide assessment of the quality of university research. Over time, the research assessment exercise has changed its name (from Research Selectivity Assessment to Research Assessment Exercise to Research Excellence Framework), its frequency (currently every six to seven years), the method of assessment (peer review of scientific output has been complemented by bibliometric measures and by an assessment of impact case studies), and the formula used for the funding distribution (Reference Geuna, Piolatto, Sylos-Labini, Geuna and RossiGeuna, Piolatto and Sylos-Labini 2015). Research funds are also allocated to academics on a competitive basis by seven research councils.Footnote 2
Until recently, recurrent funding for teaching was distributed to universities entirely according to a formula based on student numbers, weighted according to, among others factors, field, mode, and level of study (HEFCE 2015). In 2012/13, the government introduced a new system whereby universities receive a large share of their income directly from loan-backed tuition fees, while the amount of recurrent funding for teaching distributed by HEFCE has substantially decreased. A new teaching quality assessment system, the Teaching Excellence Framework (TEF), was introduced in 2017 with the objective of allowing institutions that gain a higher teaching quality score to increase their tuition fees in line with inflation.
Figure 4.2 shows how the sources of funding for universities have changed over the last ten years. Recurrent funding for teaching has been curtailed sharply since 2011/12, only partly compensated by a temporary increase in research funding. Universities have compensated for this drop in public funding by increasing undergraduate tuition fees to up to £9,000 per year. Income from knowledge transfer activities consists of two categories: research grants and contracts, which includes income from collaborative research (competitively allocated grants from the research councils, government departments, and the European Commission as well as trusts and charities) and from research contracts with industry and the public sector; plus other income, which includes income from the sale and licensing of intellectual property (IP) (including sales of equity shares in spinoffs), consultancies, facilities and equipment, professional development (CPD) and continuing education (CE) courses, and regeneration programs. These sources of income have increased slowly but steadily and together currently amount to about £12 billion – about 36 percent of overall income. IP income is a small share, just 3–4 percent of the income from knowledge transfer activities (Reference Geuna and RossiGeuna and Rossi 2011). A few universities (namely, Oxford and Cambridge colleges) benefit from considerable land endowments.
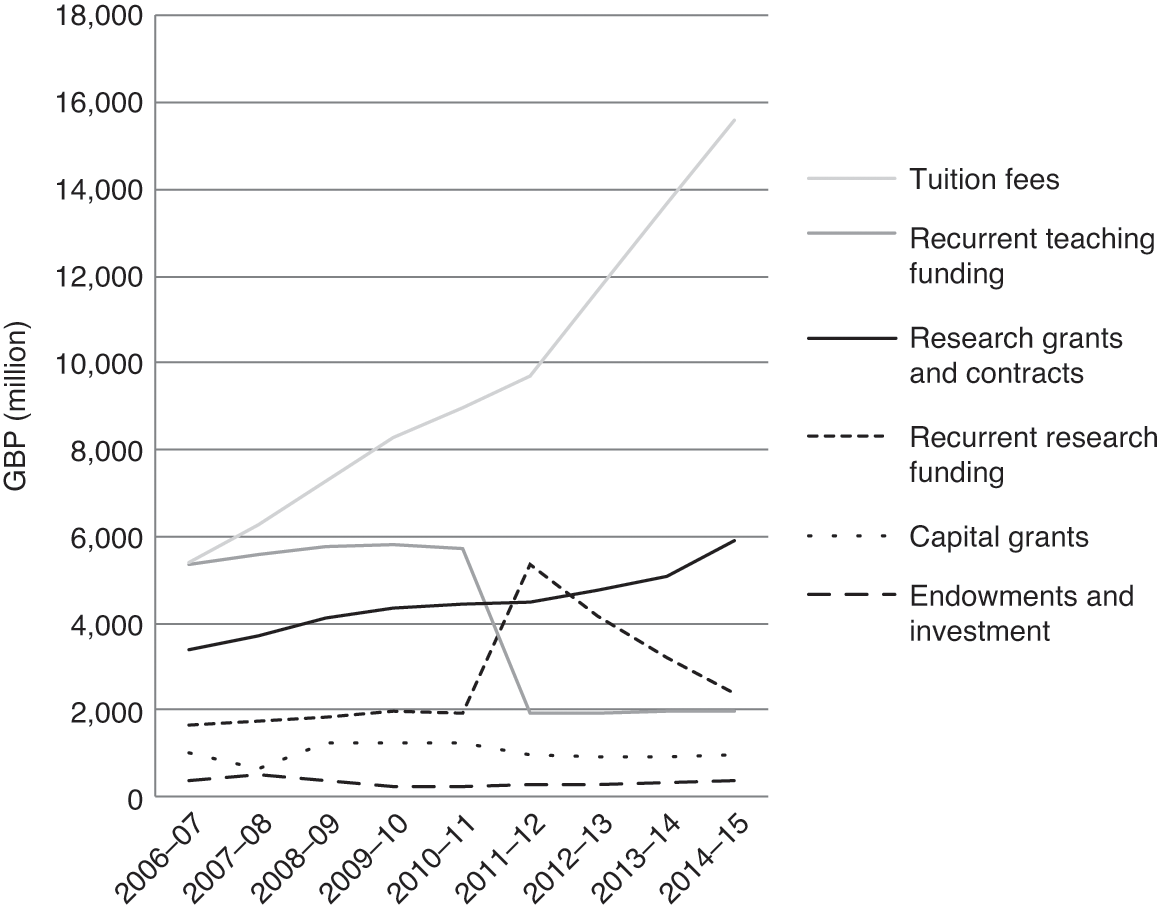
Figure 4.2 Universities’ sources of income
Public research institutes, funded by government departments or research councils, are collectively known as public sector research establishments (PSREs). They are important actors in the United Kingdom’s research system. Unlike the university sector, the PSRE sector in the United Kingdom has shrunk due to mergers, closures, and numerous transfers to the private sector. There are currently thirty-five active PSREs (Reference SmithSmith 2015), each funded by a specific government departmentFootnote 3 or research council.Footnote 4 In addition, there are twenty-six research institutes that are part of the Medical Research Council (MRC) and twenty-four cultural institutions funded mainly by the Department of Culture, Media, and Sport and by the Welsh and Scottish governments (Reference SmithSmith 2015).Footnote 5 The main difference between departmental PSREs and research council PSREs, besides their different sources of funding – the former are funded directly from the budgets of the departments they belong to, the latter are funded through the science budget – is that the former perform “responsive research” on topics directly mandated by the government, while the latter are more autonomous in setting their research priorities within their field.Footnote 6 Figure 4.3 shows the cumulative number of PSREs over time. PSREs associated with government departments have shown the largest decrease, in keeping with the idea of “lean government.”

Figure 4.3 Cumulative number of public sector research establishments active since 1950
PSREs receive a much smaller amount of funding than the university sector. The Office for National Statistics (ONS 2016) reports that in 2014 the research councils spent £819 million on in-house R&D while government departments spent £1,391 million. Although reconstructing the amount of government funds that accrue to the PSRE sector is quite difficult, these approximate figures suggest that the sector currently receives about 30–35 percent of the recurrent funds allocated to universities. Interestingly, the ratio between the number of current PSREs (including cultural institutions but excluding MRC university-based units) and the number of university institutions is similar (about 36 percent), so we can estimate the size of the PSRE sector to be about one-third the size of the university sector.
Very limited information has been collected on the different sources of income of PSREs. A study of PSREs’ knowledge transfer activities (BIS 2014) estimated that in 2012/13, PSREs gained £195 million from intellectual property licensing, £166 million from consulting activities, and £133 million from the use of facilities and equipment and training.Footnote 7 Therefore, income from knowledge transfer is about 23 percent of the income that PSREs derive from government funding. In contrast to universities, PSREs’ IP income is a high share (about 65 percent) of their overall income from knowledge transfer activities.
PSREs operate under a variety of governance arrangements: they can be fully owned by a government department or research council, government-owned but contractor-operated (GOCO), registered charities, executive agencies, trading funds or nondepartmental public bodies. This variety of governance arrangements in the PSRE sector and the universities’ status as charities have meant that both these institutions have greater operational autonomy in the United Kingdom than do similar institutions in Europe, and, in turn, this freedom has enabled them to be nimble and responsive to emerging market trends.
Table 4.1 compares public funding of universities and PSREs between 2008/9 and 2013/14. The table shows different trends, with public funding of PSREs remaining stable and public funding of universities declining – although the decline has occurred in relation to university teaching funding (a 67 percent drop in the period), while university research funding has increased.
Table 4.1 Public funding of universities and PSREs
| Universities | PSREs | |
|---|---|---|
| 2008/9 | 8,819 | 2,128 |
| 2009/10 | 9,043 | 2,216 |
| 2010/11 | 8,878 | 2,287 |
| 2011/12 | 8,271 | 2,199 |
| 2012/13 | 7,032 | 2,045 |
| 2013/14 | 6,080 | 2,153 |
4.3 An Overview of Knowledge Transfer Policy in the United Kingdom
4.3.1 A Short History of Knowledge Transfer Policy in the United Kingdom
The UK government’s concern with supporting university–industry knowledge transfer began in the late 1970s, when a debate emerged on the United Kingdom’s presumed failure to exploit research (Reference Grady and PrattGrady and Pratt 2000). Institutional and cultural barriers at the time had made cooperation between academic and industrial scientists difficult, and academia lacked incentives to engage with industry. The National Research Development Corporation (NRDC), a governmental body charged with facilitating the commercialization of research produced by public R&D (particularly defense) laboratories, had been created in 1948, but it played a limited role. John Hendry’s Innovating for Failure (Reference Hendry1993), which recounts the early attempts to drive the creation of a computer industry in Manchester in the 1950s, is instructive. Despite having the new technology at the University of Manchester, an identified champion (Ferranti) and a government willing to provide funds for the enterprise, a technology industry based on computing failed to emerge, as the required interaction between the scientists and the managers at Ferranti did not take place. An industry based on computing technology did emerge in the 1980s, but at Cambridge, supported by the Cambridge colleges, and largely free from government influence (Reference Athreye, Breshanan and GambardellaAthreye 2004). This early failure to seize the opportunity in a sector where the United Kingdom had numerous advantages may have contributed to policymakers moving away from directly supporting specific technologies. Instead, policy interventions increasingly involved promoting general framework conditions for innovation, including promoting universities’ engagement with business.
Several initiatives to support university–industry interactions implemented since the mid-1970s exemplified such an indirect approach to technology policy. These included the Teaching Company Scheme, launched in 1975, which involved placing graduates in companies on projects jointly supervised by academics and company staff (Reference Senker and SenkerSenker and Senker 1994) and the LINK scheme, launched in 1986, which aimed to support collaborative research partnerships between industry and the research base (Reference Grimaldi and von TunzelmannGrimaldi and Von Tunzelmann 2002). In the early 1980s the government assigned the exclusive right to commercialize university-generated intellectual property to the British Technology Group (BTG, formed through the merger of the NRDC with the National Enterprise Board), and, a few years later, in 1985, universities were given the choice whether to commercialize academic inventions independently or to rely on the services provided by BTG.Footnote 8
Starting from the mid-1990s, government policy documents began to explicitly identify universities as the central focus for economic development, and to emphasize the importance of partnerships between industry, government, and the science base (OST 1993). With the move of the Office of Science and Technology (OST) from the Cabinet Office to the Department for Trade and Industry (DTI) in 1995, responsibilities for science and technology policy were centralized in a single department, which facilitated the emergence of a coordinated national policy on university knowledge transfer (Reference Grady and PrattGrady and Pratt 2000).
Reference Rosli and RossiRosli and Rossi (2016) argue that UK policymakers’ views about how universities engage in knowledge transfer, and how policy should support them, have evolved over time. Until the early 2000s, policymakers envisioned a model of university engagement that borrowed heavily from the sciences and engineering (Reference Kitagawa and LightowlerKitagawa and Lightowler 2012): innovation was viewed as a linear process whereby universities would transfer technology to business, by selling patents and licenses, performing contract research (National Committee of Enquiry into Higher Education 1997; DTI 1998), or directly commercializing their technology through spinoff companies (Reference Lockett, Wright and WildLockett, Wright, and Wild 2014).
During the 2000s, policy documents began to reflect a more nuanced view, supported by growing empirical evidence highlighting the diversity of channels through which universities engage with businesses and with other economic and social actors (Reference D’Este and PatelD’Este and Patel 2007; Reference Bekkers and Bodas FreitasBekkers and Bodas Freitas 2008; Reference Hughes and MartinHughes and Martin 2012). Having identified the drawbacks of focusing too much on patenting and on the pursuit of narrow financial returns (Lambert Review: HM Treasury 2003; Gowers Review: HM Treasury 2006; Saraga report: DIUS 2007), universities were encouraged to realize the potential of their intellectual property beyond their patent portfolio, focusing on other areas such as copyright (Hargreaves Review: BIS 2011b). They were also encouraged to focus on their comparative strengths, since different universities had different contributions to make, some as world-class centers of research excellence and players in global markets, and others primarily as collaborators engaged with local businesses, communities, and regional bodies (DTI/DFES 2005; DIUS 2008a, 2008b). It was argued that public funding should encourage such choice, by providing incentives for institutions to become more entrepreneurial, build closer links with business and the community, and have proper arrangements for exploiting the results of their work. The term “knowledge transfer” gained prominence (DES 2003; HM Treasury 2003), suggesting that universities transfer more than just technology produced by science and engineering departments, and contribute through the whole spectrum of academic disciplines.
More recently, a broader view has emerged whereby universities are seen to be part of complex ecosystems of innovation characterized by collaboration and exchange among a variety of stakeholders, aimed at addressing complex social and economic challenges (Reference Andersen, Brinkley and HuttonAndersen, Brinkley, and Hutton 2011; BIS 2015). The bidirectional and collaborative nature of the interactions between universities and businesses (or other stakeholders), is reflected in the increasing use of the term “knowledge exchange” (DIUS 2008b; BIS 2012, 2013, 2015).
Another aspect of the evolution of knowledge transfer policy concerns the level of implementation. In the first decade of the 2000s, attention was paid to the regional dimension of universities’ knowledge transfer engagement (Reference PottsPotts 2002; DES 2003; Lambert Review: HM Treasury 2003), and a new Regional Innovation Fund worth £50 million per year was set up to enable regional development agencies (RDAs) in England to support clusters, incubators and networking among scientists, entrepreneurs, managers, and financiers. However, all RDAs were closed in 2010, leading the government to abandon this regional focus (Reference Cochrane and WilliamsCochrane and Williams 2013). In the absence of regional policy institutions, the implementation of regional policies for knowledge transfer has become more difficult, and universities’ efforts to engage in knowledge transfer within their region are neither monitored nor encouraged. While numerous local enterprise partnerships (LEPs) between local authorities and businesses were established in 2011, covering all areas of England (BIS Committee 2014), how innovation and knowledge transfer policies can be implemented in the LEP context remains unclear. LEPs argue that their remit has expanded over time, and that their resources are insufficient (National Audit Office 2016). Although university representatives sit on the board of many LEPs, a recent review suggests that the relationship expected between LEPs and universities appears ill-defined and that engagement between them is patchy (BIS 2015), with LEPs lacking any firm obligation or support to help businesses connect with universities. In consequence, universities may have been discouraged from pursuing an agenda of contributing to regional development, focusing instead on different objectives (Reference Kitagawa, Sanchez-Barrioluengo and UyarraKitagawa et al. 2016). However, little empirical evidence exists at the moment to show whether this has been the case.
4.3.2 Supply-Side Policy Instruments Supporting Knowledge Transfer
Most of the policy instruments devised by the government in order to promote knowledge transfer have been targeted at universities (Science and Technology Committee 2017). The first comprehensive package, the Knowledge Exploitation Programme, was launched in 1999 and included three instruments (HEFCE 1999):
(i) The Higher Education Reach-out to Business and the Community (HEROBAC) Fund (£60 million allocated competitively in 1999–2004). Its aim was to help universities to build organizational capability and infrastructures to engage with business and the wider community.
(ii) The Science Enterprise Challenge (SEC) fund (£45 million allocated competitively in 1999–2004). It aimed to support entrepreneurially oriented education and training within universities.
(iii) The University Challenge Seed Fund (£60 million overall allocated via two competitions, in 1999 and 2001). It provided access to seed funds to exploit science and engineering research outcomes and support the creation of university spinouts.
The Higher Education Innovation Fund (HEIF), a permanent stream of funding to support universities’ knowledge transfer activities, was announced in 2001/2 and implemented the following year. The activities originally funded by HEROBAC, the SEC and the University Challenge Seed Fund were progressively brought within HEIF’s remit. After a marked increase between 2004 and 2008, the fund later stabilized at about £130 million per year, which is almost three times as much as it had been in 2001. The amount distributed through HEIF and parallel funding streams in Scotland, Wales, and Northern Ireland equates to approximately 2.4 percent of the recurrent government funding allocated to universities for teaching and research, and about 9 percent of the recurrent government funding allocated to research alone (Kitagawa and Lightowler 2013). Over time, HEIF has become a very important source of support for knowledge transfer activities, with about 34 percent of universities’ knowledge transfer income resulting from HEIF-funded activities (Reference Coates UlrichsenCoates Ulrichsen 2014).
HEIF’s allocation system has changed over time. Initially, funds were allocated to universities competitively on the basis of the project proposals that they presented, with the objective of helping them build capacity for knowledge transfer (Reference Kitagawa and LightowlerKitagawa and Lightowler 2012). Since 2006 this has been progressively replaced by a formula based on the income that universities accrue from knowledge transfer, so that money is channeled to the institutions that are already more commercially successful. The introduction of a minimum eligibility threshold of £250,000, an increase in the maximum award that can be received by each university (£2.85 million), and the allocation of additional funds to top performers (£6 million to twelve institutions in 2012/13 and £20 million to twenty-seven institutions in 2014/15) have also contributed to greater funding concentration since 2011 (Reference Coates UlrichsenCoates Ulrichsen 2014; Reference Day and FernandezDay and Fernandez 2015), reversing the previous trend whereby smaller institutions used to have higher income growthFootnote 9 (Reference Day and FernandezDay and Fernandez 2015).
In addition to HEIF, several other instruments support universities’ knowledge transfer activities. HEFCE runs the Catalyst Fund, which distributes funds competitively to projects aimed at driving innovation in higher education (£37.6 million in 2013/14) and the UK Research Partnership Investment Fund, which funds large-scale collaborative projects between universities and private partners (£136 million in 2013/14). Innovate UK also runs a number of schemes. The Knowledge Transfer Partnership (KTP) scheme, launched in 2003, is a revamped version of the Teaching Company Scheme. In 2013/14 it allocated £16.9 million. The Catapult Centres, launched in 2013, are research and technology innovation centers set up as collaborative ventures between universities and businesses, each focused on a specific area of research and technological development. The twelve “catapults” were allocated £121.30 million in 2013/14. Innovate UK also funds collaborative R&D projects and feasibility studies involving businesses and research organizations (£172.9 million in 2013/14), collaborative research in biomedicine (Biomedical Catalyst, £30 million in 2013/14), Knowledge Transfer Networks (£15.2 million in 2013/14), and Innovation and Knowledge Centres (£1.9 million in 2013/14).
The overall set of government-supported knowledge transfer schemes allocated by HEFCE and Innovate UK amounted to approximately £696 million in 2013/14, which was about 37 percent of the recurrent government funding allocated to university research in the same period (NCUB 2016a). Small funding schemes supporting knowledge transfer activities, often restricted to specific academic fields, are also implemented by the devolved governments (Reference Huggins and KitagawaHuggins and Kitagawa 2012), by many of the research councils and by selected charities such as the Wellcome Trust and the Royal Society (Lockwood 2012, cited in Reference Coates UlrichsenCoates Ulrichsen 2014).Footnote 10
Few policy instruments have been set up in support of the knowledge transfer activities of PSREs. In 2001, the government set up the Public Sector Research Exploitation Fund, awarding nineteen PSREs a total of £10 million of public venture capital to develop potential products to the point where they could be successfully marketed to the private sector. Two additional rounds of funding in 2004 and 2006 allocated a further £40 million. Since the demise of this instrument, there are no lines of funding specifically dedicated to supporting PSREs’ knowledge transfer activities.
Not all policy instruments consist of the provision of funding. The Lambert Agreements are a set of decision tools and standard agreements created in 2005 to simplify contracting for business–university collaborations. Evidence on the success of these tools is mixed: most users report that they simplify processes and provide useful information and precedents (BIS 2015); however, their use is not widespread. While universities are generally aware of these tools and 63 percent use them to some extent (Reference Tang, Wecowska, Campos and HobdayTang et al. 2009), less than 10–15 percent by value of collaborative research between universities and business is based on a Lambert-type agreement (BIS 2015). For the most valuable agreements, companies are more likely to impose their preferred contractual forms. Scotland has mandated the use of template contracts for interactions funded by the Scottish Funding Council’s innovation voucher and related schemes (BIS 2015).
A crucial nonfinancial policy instrument that affects knowledge transfer is the government regulation of IP rights. In the United Kingdom, there is no strong legislative framework regulating academic patenting, and, unlike other countries that have enacted specific laws on university IP, the assignment of IP rights over research outputs is governed by the general provisions on employee inventions contained in the Patent Law of 1977. The United Kingdom has a system of “automatic ownership,” such that the university is the first owner of the IP, which usually cannot revert to the inventor.Footnote 11 However, if research is sponsored fully or in part by external contractors, parties may negotiate a different agreement on the allocation of IP rights. In some cases, the university may override existing regulations by developing internal IP rights regulations and procedures to enforce them. Issues such as the share of royalties to be assigned to the academic inventors, the rights of inventors who are PhD students, and the timing of patent filing procedures can vary widely among universities.
Mainly because of its fluidity, the policy framework around IP has not undergone radical changes over time. The main policy change, introduced in 1985, has been the possibility for universities to directly commercialize their intellectual property. This has encouraged an increase in the patenting activities of universities. In fact, UK universities tend to own a large share (over 50 percent) of patents invented by academics, similar to the U.S. (where the share is 69 percent) and unlike many other European countries, where the majority of academic-invented patents are owned by private companies; for example, Reference Lissoni, Llerena, McKelvey and SanditovLissoni et al. (2008) show that university-owned patents constitute no more than 11 percent of all academic patents in France, Italy, and Sweden.
4.3.3 Demand-Side Policies Supporting Knowledge Transfer
Business also has a vital part to play in successful knowledge transfer. A number of policies exist to support business investment in R&D, which in turn should increase businesses’ commercial demand for university research. These include (BIS 2011a):
R&D tax credits, which offer relief from corporation tax (equal to 22.5 percent of qualifying expenditure) with the objective of incentivizing companies in all sectors to undertake more R&D. The government has also introduced a simplified tax regime for small companies and made it easier for them to claim the R&D tax credit.
Open funding competitions (formerly Smart Programme) to support firms’ R&D projects that are “likely to lead to sustainable gains in productivity and/or access to new overseas markets through export led business growth.”Footnote 12
The Small Business Research Initiative (SBRI), which aims to enable innovative companies to solve challenges for government departments.
Support for venture capital funding, through government investment in the Enterprise Capital Funds program, in the Co-Investment Fund (aimed at backing business angels), and in the UK Innovation Investment Fund (one of Europe’s largest technology funds investing in life sciences, digital, advanced manufacturing and clean-tech companies). Additionally, several schemes provide tax relief to investors providing venture capital to qualifying seed companies (the Seed Enterprise Investment Scheme, SEIS), SMEs (the Enterprise Investment Scheme, EIS), or social enterprises (Social Investment Tax Relief, SITR).Footnote 13
The recent Industrial Strategy White Paper (BEIS 2017) has outlined a more proactive role for the UK government in driving industrial policy in the wake of the United Kingdom’s exit from the European Union and proposed several supply-side and demand-side interventions. On the supply side, the government has committed to increase investment in R&D by around 20 percent via an additional £4.7 billion of government R&D funding by 2020–1. Additional spending of £100 million has been committed to measures to incentivize universities to collaborate with businesses. These might include the expansion of existing mechanisms such as HEIF and KTPs, the introduction of new schemes aimed at funding industry placements for scientists, and supporting world-class clusters of research and innovation. A new Industrial Strategy Challenge Fund is planned to back technologies at all stages where the United Kingdom has the potential to take an industrial lead. This Fund will support a range of industrial R&D activities: joint research projects between business and academic researchers, graduate placements, setting up demonstrators to test near-to-market technologies in real-world environments and creating centers to bring together academic experts with entrepreneurs to promote commercialization (BEIS 2017).
On the demand side, a few measures aimed at driving up the level of business R&D investment have also been announced. These include: a review of the tax environment for R&D, a new challenge prize to support “everyday entrepreneurs” and a review of the IP system to stimulate collaborative innovation and licensing opportunities. The Science and Technology Committee (2017), while welcoming the government’s renewed emphasis on knowledge transfer, remained concerned that its previous efforts had focused disproportionately on the “supply” of research by universities rather than the level of “demand” from businesses, and that the overall R&D intensity and productivity of the UK business sector continue to be low compared to that in other OECD countries.
4.4 Knowledge Transfer Activities of Universities and PSREs
4.4.1 The Variety of Knowledge Transfer Activities
Knowledge transfer channels have been comprehensively classified in recent work by the National Centre for Universities and Business (NCUB 2016a, 2016b) into four categories: commercialization, problem-solving, people-based, and community-based activities. Commercialization activities include patenting, licensing research, consulting, and spinning out companies. Problem-solving activities include joint publications, joint research, consultancy services, prototyping and testing, research consortia, contract research, hosting personnel, providing informal advice, external secondment, and setting up physical facilities. People-based activities include standard-setting forums, participating in networks, attending conferences, student placements, giving invited lectures, curriculum development, sitting on advisory boards, employee training, and enterprise education. Community-based activities include social enterprises, museums and art galleries, public exhibitions, heritage and tourism, community-based sports, performing arts, school projects, and lectures for the community. While universities have been engaging in people-based and community-based activities for a long time, the literature has only relatively recently begun to acknowledge their importance in disseminating and sharing academic knowledge to the public (British Academy 2008, 2010; Reference Olmos-Peñuela, Benneworth and Castro-MartínezOlmos-Peñuela, Benneworth and Castro-Martínez 2014; Campaign for Social Science 2015).
Figure 4.4 shows the shares of academics and of PSRE staff who engage in each type of activity. Commercialization and problem-solving activities are relatively more important for PSRE staff than for academics, while the converse is true for people-based and community-based activities. This may be due, in part, to differences between fields of science, since commercialization and problem-solving are particularly important in engineering and materials science, while the arts and humanities and the social sciences, which are not represented in the set of PSREs considered in this study, lead in community-based and people-based activities respectively (NCUB 2016a). It is also apparent that both academics and PSRE staff engage far less in commercialization activities than in all other activities. In line with a large amount of evidence suggesting that IP-based activities are concentrated in a few fields, commercialization is particularly high among engineering and materials science academics, and among BBSRC-affiliated PSRE staff.

Figure 4.4 Shares of university and PSRE staff involved in different types of knowledge transfer activity
A more fine-grained analysis comparing the shares of academics (excluding those in the social sciences and the arts and humanities, for greater comparability) and the shares of PSRE staff who engage in each of the activities listed under the four main categories of commercialization, problem-solving, people-based, and community-based activities, suggests that the pattern of engagement is very similar. Academics are marginally more engaged in most activities, except for joint research, research consortia, giving informal advice, and attending conferences, while PSRE staff are marginally more active in several community-based activities. It appears that, in spite of the lack of specific policy schemes supporting PSREs’ knowledge transfer activities, PSRE staff engage with external stakeholders through a variety of channels.
4.4.2 Engagement in IP Commercialization
While commercialization of IP has historically been considered an important avenue for university–industry knowledge transfer, in practice, it involves fewer academics and generates less income than all other knowledge transfer channels. There is a substantial amount of research investigating the patterns and determinants of university patenting, licensing, and spinouts in the United Kingdom. Table 4.2 presents the evolution of a subset of indicators of IP-related activities for the period from 2003–4 to 2014–15. IP income increased at about 11 percent per year, excluding the exceptionally good performance of 2008, which was largely due to one university selling its share of a well-established company (HEFCE 2010). Income from other knowledge transfer activities increased on average by 10.9 percent per year. However, these two types of income are very different in magnitude, with income from IP accounting on average for only 2.8 percent of total annual income from knowledge transfer. The number of patents applied for and granted (both national and international filings, but not counting multiple filings of the same patent in different countries) increased on average by 5.3 percent and 8.3 percent respectively each year. From the mid-2000s there appears to have been a leveling-off in the growth of university-owned patents. This matches the experience of the U.S., another country with a long tradition of institutional IP ownership (Reference Mowery, Sampat, Fagerberg, Mowery and NelsonMowery and Sampat 2005; Reference Tang, Wecowska, Campos and HobdayTang et al. 2009). Over time, knowledge transfer offices (KTOs) have gained experience in realistically assessing inventions’ commercial and licensing potential, and have therefore become more selective in deciding whether patent applications should be made (Reference Tang, Wecowska, Campos and HobdayTang et al. 2009). As a consequence, the quality of university patents has improved, as suggested by several trends: an increase in the number of nonsoftware license agreements, an increase in the share of spinouts surviving for more than three years, and an increase in the share of patent applications that are eventually granted.
Table 4.2 Indicators of research commercialization activities in UK universities
| 2003–4 | 2004–5 | 2005–6 | 2006–7 | 2007–8 | 2008–91 | 2009–10 | 2010–11 | 2011–12 | 2012–13 | 2013–14 | 2014–15 | |
|---|---|---|---|---|---|---|---|---|---|---|---|---|
| FTE staff employed in commercialization offices | 1,508 | 1,518 | 1,612 | 1,829 | 1,910 | 2,001 | 2,975 | 2,209 | 2,269 | 3,395 | 3,720 | 3,936 |
| A) Patent applications | 1,308 | 1,648 | 1,536 | 1,913 | 1,898 | 2,097 | 1,994 | 2,256 | 2,274 | 1,936 | 2,076 | 2,156 |
| B) Patents granted | 463 | 711 | 577 | 647 | 590 | 653 | 820 | 757 | 826 | 951 | 969 | 953 |
| C) Formal spinouts established | 167 | 148 | 187 | 226 | 219 | 191 | 207 | 236 | 170 | 131 | 130 | 129 |
| D) Formal spinouts still active after three years | 688 | 661 | 746 | 844 | 923 | 982 | 806 | 825 | 818 | 793 | 802 | 836 |
| E) IP income (£ million)1 | 49 | 71 | 70 | 69 | 76 | 140 | 92 | 74 | 83 | 89 | 133 | 155 |
| F) Other knowledge transfer income (£ million),2 of which: | 2,479 | 2,549 | 2,688 | 3,054 | 3,158 | 3,188 | 3,284 | 3,448 | 3,487 | 3,588 | 3,840 | 4,020 |
| Collaborative research | 699 | 665 | 725 | 791 | 802 | 821 | 819 | 930 | 915 | 979 | 1,156 | 1,257 |
| Consultancy | 272 | 281 | 294 | 340 | 385 | 372 | 397 | 395 | 418 | 412 | 446 | 442 |
| Contract research | 745 | 773 | 792 | 925 | 960 | 1,052 | 1,075 | 1,123 | 1,148 | 1,201 | 1,205 | 1,210 |
| CPD | 282 | 347 | 349 | 415 | 442 | 430 | 445 | 439 | 437 | 435 | 430 | 443 |
| CPD and CE | 99 | 127 | 142 | 159 | 176 | 197 | 189 | 207 | 236 | 237 | 255 | 272 |
| Facilities and equipment-related services | 103 | 95 | 109 | 110 | 119 | 124 | 126 | 137 | 146 | 146 | 165 | 191 |
| Regeneration and development programs | 279 | 261 | 276 | 314 | 274 | 193 | 233 | 217 | 189 | 177 | 183 | 205 |
| Ratio E/F (%) | 2.0 | 2.8 | 2.6 | 2.3 | 2.4 | 4.4 | 2.8 | 2.1 | 2.4 | 2.5 | 3.5 | 3.9 |
1 Includes income from license agreements involving patents, copyright, design registrations, and trademarks.
2 Includes income from collaborative research, research contracts, consultancies, facilities and equipment, CPD, CE courses, and regeneration programs.
Despite the large number of universities that engage in patenting and spinning out (between 2009–10 and 2014–15, 122 universities filed at least one patent, generated income from IP, or created at least one spinout company), the bulk of these activities are concentrated in a subset of research-intensive universities with a substantial presence in engineering, materials science, biology, chemistry, and veterinary science (NCUB 2016a). In 2014–15, six institutions (3.7 percent) produced 40 percent of patent applications, and twenty-five institutions (16 percent) produced 80 percent of patent applications. The distribution of IP income is even more concentrated: just three institutions (1.8 percent) produced 41 percent of IP income, and seventeen institutions (11 percent) produced 80 percent of IP income. Twenty-seven institutions (17 percent) produced 80 percent of income from research contracts. The skewed distributions of patent income might suggest a skewed ability of institutions to produce high-quality patents, since evidence suggests that patents licensed to industry are of better quality than patents that are not licensed (Reference SterziSterzi 2013).
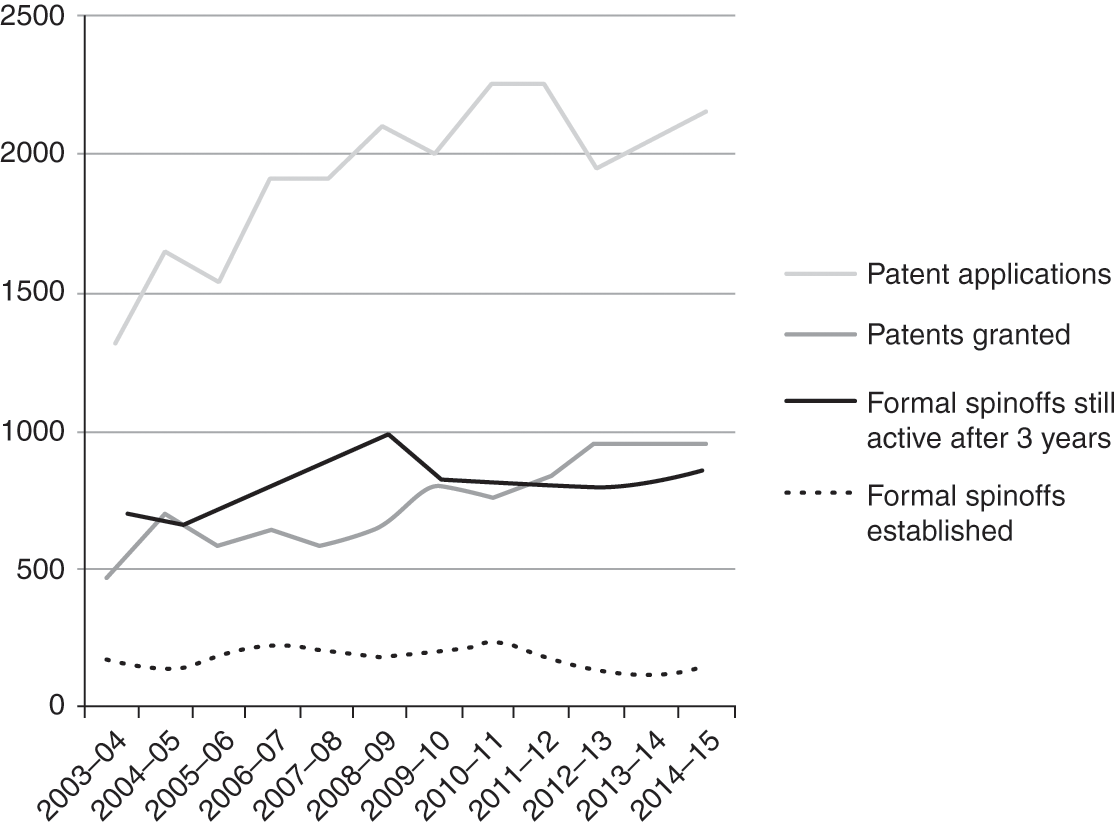
Figure 4.5 summarizes some of the data from Table 4.2. The number of new spinouts established each year has been quite stable (although declining in recent years), but the number of spinouts surviving at least three years has increased. While failure rates remain high and a great number of spinouts may still not survive in the long run (HM Treasury 2003), the survival rateFootnote 14 of university spinouts in the United Kingdom is high by comparison with many other countries (Reference Lawton Smith and HoLawton Smith and Ho 2006).

Figure 4.5 Patenting and spinout activities of universities
One interesting aspect of Figure 4.5 is the close relationship between patents granted and spinout activity. It has been argued that patent licensing and spinning out companies are alternative modes of commercializing research results, and that one or the other will prevail depending on institutional and context conditions. International evidence suggests that those countries that have maintained an inventor-ownership model (such as Sweden and Italy) focus more on spinouts than countries that have a university-ownership model, which tend to focus on patent licensing. The University of Cambridge seems a case in point. Before its switch to the institutional-ownership model in 2005, the University of Cambridge had, for a long time, uniquely maintained a professor’s privilege system similar to that implemented in Germany and the Nordic countries. Cambridge’s historic success at spinout creation (Reference Athreye, Breshanan and GambardellaAthreye 2004) might suggest that the lack of institutional ownership acted as an incentive to commercialize research results via spinout companies instead of relying on patent licensing.
However, the analysis of patenting and spinout data over time suggests that universities that make more income from technology licensing and file more patents may also create more successful spinouts. This relationship is consistent with the skew in the generation of new science noted earlier and suggests that universities have developed a range of competencies that allow them to engage in both licensing and spinouts. A growing literature on university KTOs appears to tell a similar story. Reference Tang, Wecowska, Campos and HobdayTang et al. (2009) reported that KTOs have improved their ability to explain the commercialization processes and options to academics, and to work with academics on defining appropriate IP ownership arrangements and financial incentives. Most KTOs continually review and restructure their strategies, and promote themselves as interface organizations between the academics (and university) and external parties, including venture capitalists (Reference ChughChugh 2004). The number, experience, and knowledge of KTO staff have been found to be positively related to the number of spinouts (Reference Lockett and WrightLockett and Wright 2005; Reference Powers and McDougallPowers and McDougall 2005) and to the quality of the advice and contacts they provide (Reference Franklin, Wright and LockettFranklin, Wright, and Lockett 2001). The number of university spinouts is also positively correlated with university R&D spending, spending on IP disclosure, and the ability to develop new business (Reference Lockett and WrightLockett and Wright 2005) – but it is quite likely that these factors also determine how many patents the university can apply for. The ability to generate spinout companies also depends on university characteristics (such as institutional reputation, which makes it easier for academics to bring together resources to create spinouts, and the presence of cultures or norms that nurture entrepreneurial activity (Reference DiGregorio and ShaneDiGregorio and Shane 2003), and on external factors like the availability of local venture capital: the level of investment in firms located ten miles from a venture capital head office is double that of firms sited 100 miles away (Reference Wright, Vohora and LockettWright et al. 2004), and on individual attributes and experience (Reference Clarysse, Tartari and SalterClarysse, Tartari, and Salter 2011).
Information about the commercialization activities of PSREs is collected less systematically than information about universities’ knowledge transfer activities. Between 2003 and 2004, the Department for Business, Innovation, and Skills (BIS 2011a, 2014) carried out seven surveys of knowledge transfer activities in all the PSREs funded by government departments and by the research councils, as well as in cultural institutions and regional NHS hospital trusts. Table 4.3, drawn from the latest available study (BIS 2014), shows grossed-up estimates for the whole sector. PSREs’ commercialization activities have grown over time –the number of FTE staff in commercialization offices has grown by about 36 percent – as has business representation on their governing boards. As a group, PSREs outperform universities on a range of metrics. If we compare data from universities and PSREs in the last year for which they are available (2012–13), it is interesting to observe that while the number of patent applications by PSREs is much lower (322 versus 1,936 by universities), their probability of being granted is much higher (two-thirds versus less than half) and so is their income from licensing (£195 million versus £61 million). Consequently, the average licensing income per granted patent is much higher for PSREs (£570,175) than for universities (£64,143), although we do not have information about the distributions: it is possible that a small number of blockbuster patents account for the largest share of income, for either or both PSREs and universities.
Table 4.3 Summary indicators of research commercialization activities in UK PSREs
| 2003–4 | 2004–5 | 2005–6 | 2006–7 | 2007–8 | 2008–9 | 2012–13 | |
|---|---|---|---|---|---|---|---|
| Number of PSREs covered | 107 | 116 | 135 | 138 | 138 | 143 | grossed-up values |
| FTE staff employed in commercialization offices | 385 | 368 | 513 | 669 | 486 | 448 | 611 |
| A) Patent applications | 316 | 335 | 290 | 316 | 379 | 392 | 322 |
| B) Patents granted | 228 | 148 | 193 | 172 | 188 | 230 | 342 |
| C) Formal spinouts established | 69 | 84 | 74 | 101 | 89 | 83 | 143 |
| D) IP income (£ million) | 33 | 46 | 186 | 116 | 146 | 198 | 195 |
| E) Income from consultancy (£ million) | 36 | 31 | 26 | 43 | 37 | 100 | 166 |
| F) Income from use of facilities and equipment and training (£ million) | 133 | ||||||
| Ratio D/(E+F) (%) | 91.7 | 148.4 | 715.4 | 269.8 | 394.6 | 198.0 | 65.2 |
Table 4.3 also shows that PSREs’ commercialization activities have been on the rise. Although patent applications have not increased much, the number of patents granted has increased. The number of spinouts doubled between 2008–9 and 2012–13, with PSREs owning some equity in 93 percent of these cases. Income from commercialization activities including business consultancy has also increased dramatically over time, and particularly since 2008–9. By way of contrast, a steady increase in licensing agreements (and corresponding income) in the early years has been followed by a decline in the last three years. Unlike universities, PSREs derive most of their knowledge transfer income from IP; for most of the period covered, income from IP was several times larger than income from consulting and other sources. Only in the most recent survey has the situation has changed: with IP income stable and rapid growth in other sources of knowledge transfer income, the former has dropped to only 65 percent of the latter. By contrast, universities’ income from other knowledge transfer activities is much higher than that of PSREs (£2,269 million versus £299 million), indicating that universities engage in a broader range of activities.

In comparing the commercialization activities of universities and PSREs, we may wonder whether we are comparing like with like. With 161 universities, the university sector is likely to be far more diverse than the thirty-five PSREs focused narrowly on a few subject areas. A narrow focus is more likely to generate economies of specialization in research, which are much harder for universities to achieve given their broader mandate.
Data collected from two surveys by NCUB, one of academic staff (NCUB 2016a) and one of PSRE staff (NCUB 2016b), allows us to perform some comparisons. It is apparent that PSRE staff can dedicate the majority of their time to research rather than teaching and administration, which instead take up a large part of university academics’ time. Even though academics in the sciences spend on average a greater share of their time on research than academics in the social sciences and humanities, they still devote much less time to research than PSRE staff. However, while this might explain why a PSRE researcher produces more output than an academic, it still does not explain why their research enjoys greater commercial success.
PSREs’ greater success in commercialization may be explained by their greater focus on more applied, mission-oriented research. However, whether PSREs’ research is more applied than that conducted at universities is not clear. A comparison using NCUB data (2016a and 2016b) of the time allocated by academic and PSREs researchers between pure basic, user-inspired basic and applied research (as defined by the Frascati Manual, OECD 2003, pp. 77–9) suggests that the differences between research fields are greater than those between universities and PSREs: in both sectors, researchers in health and engineering spend relatively more time doing applied research, while researchers in biology, chemistry, and the natural sciences spend relatively more time doing basic research. Hence, categorizing research according to its objectives does not seem to reflect the commercialization potential of the resulting outcomes.
Another explanation might be that PSREs are more oriented to fields that are characterized by immediate commercial applicability, such as computer science and biotechnology. Data on the distribution of PSRE staff across fields of research are not collected systematically. By integrating information on the orientation of PSREs to various research fields (BIS 2015) with data on the number of staff employed in PSREs in 2012–13 (BIS 2014), we can estimate the share of PSRE staff in each field. These shares can be compared with the distribution of academics in each field in the same year. Considering only academics and PSRE staff employed in the sciences, we find that universities have greater shares of staff in medicine and in engineering and technology, while PSREs have greater shares of staff in the natural sciences (particularly biology, environmental, and sustainability studies) and in agriculture and veterinary science. While this shows different patterns of specialization in the two sectors, it is not immediately possible to deduce information about the ease of commercial applicability of the resulting research outcomes.
One reason why it is not so easy to explain the differential commercialization success of universities and PSREs is that the government is likely to have privatized, over time, exactly those PSREs whose research results could be commercialized more easily, since these would be more likely to survive without government funding. Therefore, the remaining PSREs are more likely to focus on the production of research outcomes that are less likely to generate large private returns, and which are thus more similar to the kind of research outcomes produced by universities. Academics and PSRE staff appear to have similar patterns of engagement in different channels of knowledge transfer, and to initiate interactions with external partners in similar ways. Further research in this area should adopt more fine-grained units of analysis. In particular, given that PSREs focus on narrow fields of research, their knowledge transfer performance should be compared with that of university departments or even research centers engaged in similar fields. Data at this level are currently not available systematically and would require ad hoc data collection.
4.4.3 Industry Demand for Knowledge from Universities and PSREs
Universities in the United Kingdom interact with a variety of industries. According to data from HESA, almost all universities work with organizations in the education, health and arts sectors, while three-quarters work with manufacturing. Almost every industrial sector draws on university knowledge: only five sectors approached fewer than eighty universities, and of these, only two sectors approached fewer than forty. However, when businesses are asked about their sources of knowledge for innovation, universities are not ranked highly: the most frequently cited sources of knowledge are the company itself, clients or customers, suppliers, and competitors in the same line of business (Reference Hughes and MartinHughes and Martin 2012). The fact that only 1 percent of the businesses report using the business sector alone, while 18 percent report using the business sector together with intermediaries, and over 80 percent report using some combination of sources from all three groupings, suggests that businesses use university knowledge in combination with other sources.
Data from the most recent Community Innovation Survey (BIS 2016) provide additional information about business engagement with universities. In the CIS sample of 15,091 companies,Footnote 15 between January 1, 2012 and December 31, 2014, 7 percent of the companies collaborated on innovation activities with universities or other higher education institutions, and 5 percent collaborated on innovation activities with government or public research institutes. Table 4.4 shows a cross-tabulation of information on collaboration on innovation activities with universities and government or public research institutes. A total of 729 companies collaborated with the government, 1,068 with universities, 593 with both government and universities, 136 with the government but not with universities, and 475 with universities but not the government. The vast majority of firms (13,887) collaborated with neither universities nor government.
Table 4.4 Collaboration with universities and governments
| Collaborated with government? | Total | |||
|---|---|---|---|---|
| No | Yes | |||
| Collaborated with university? | No | 13,887 | 136 | 14,023 |
| Yes | 475 | 593 | 1,068 | |
| Total | 14,362 | 729 | 15,091 | |
Breaking down these data further, we find that of the CIS sample of 15,091 companies, 13 percent collaborated on innovation activities in the United Kingdom at the regional level, 19 percent collaborated at the national level, 9 percent collaborated with European countries, and 8 percent collaborated with non-European countries. However, relatively few companies collaborated with either universities or government, as can be seen from Table 4.5.
Table 4.5 Cooperation on innovation activities with universities and government at different geographical levels
| Cooperates on innovation activities with government or public research institutes | |||||
|---|---|---|---|---|---|
| Cooperation on innovation activities with universities or other higher education institutions | None | Nationally | Internationally | Nationally and internationally | Total |
| None | 13,887 | 120 | 10 | 6 | 14,023 |
| Nationally | 422 | 358 | 10 | 16 | 806 |
| Internationally | 20 | 9 | 117 | 2 | 148 |
| Nationally and internationally | 33 | 25 | 8 | 48 | 114 |
| Total | 14,362 | 512 | 145 | 72 | 15,091 |
According to Reference Abreu, Grinevich, Hughes, Kitson and TernouthAbreu et al. (2008), who surveyed 1,449 UK firms, the channels most frequently used by firms to access university knowledge were the distribution of scientific knowledge through open science (publications and scientific conferences) and the appointment of graduate personnel. These far outstripped direct research collaborations between universities and firms (through research collaborations, research contracts and consultancies), while patents and licenses were used least of all. Data from HESA show differences between large firms and SMEs in the use of university IP: SMEs and non-commercial organizations generate 42 percent of universities’ non-software licensing income, 64 percent of software licensing income, and 98 percent of other IP income (including income from copyright licensing).
4.5 Organizational Practices in Knowledge Transfer
Universities in the United Kingdom have very different knowledge transfer strategies (Reference Hewitt-DundasHewitt-Dundas 2012) which tend to be aligned to their organizational goals and objectives (Reference BucklandBuckland 2009) and to their tangible and intangible resources (research intensity, subject specialization, entrepreneurial culture, competencies within the KTO) (Reference Hewitt-DundasHewitt-Dundas 2012; Reference Kitagawa, Sanchez-Barrioluengo and UyarraKitagawa et al. 2016; Reference RossiRossi 2017). Typically, knowledge transfer channels based on exploiting IP (patent licensing, spinouts) and research contracts are more prevalent in research-intensive institutions and in those that include science, engineering, and medical subjects. In these institutions, the research and grants office may manage a larger share of university income than the KTO. By contrast, more teaching-intensive institutions tend to focus on consultancy, the provision of CPD, and regeneration programs (Reference Hewitt-DundasHewitt-Dundas 2012) aiming to provide skills and knowledge to their local communities (Reference Jones and CravenJones and Craven 2001; Reference Meagher, Lyall and NutleyMeagher, Lyall, and Nutley 2008; Reference Wright, Clarysse, Lockett and KnockaertWright et al. 2008). Universities specialized or oriented toward engineering, natural sciences, or information technology mainly interact with industry partners, while those specialized in the humanities, arts, and social sciences usually interact with public bodies, nonprofit organizations, and other community groups with lower purchasing power (Reference Benneworth and JongbloedBenneworth and Jongbloed 2010).
While different types of universities may prioritize different types of knowledge transfer activities, it is unclear which of these approaches bring the greatest economic returns: universities that are less research-intensive often receive more funds from industry than those that have a profile of research excellence (Reference GeunaGeuna 1999). Compared with top universities, mid-range universities engage in a wider range of knowledge transfer activities (Reference Wright, Clarysse, Lockett and KnockaertWright et al. 2008) and serve a broader range of stakeholders (Reference De LaTorre, Rossi and SagarraDe La Torre, Rossi, and Sagarra 2017).
The knowledge transfer management practices adopted by universities are likely to play a role in their performance. Several studies have attempted to categorize different models for managing knowledge transfer activities. Reference Rogers, Helmers, Baghurst and PollardRogers et al. (2009) identify four main models of research commercialization: the Cambridge Inventor-Ownership Model, based on academics’ direct ownership of the IP originating from their research; the In-House Model, where the university manages the entire knowledge transfer process through an internal organization; the Stand-Alone Company Model, where the university establishes a dedicated, independent limited company to act as a conduit between university research and business; and finally the Hybrid Model, where the university signs a long-term partnership agreement that grants a private company a share in the university’s IP (and income generated from its commercialization) in exchange for advice, funding, and expertise. A not-dissimilar classification was provided by Reference Tang, Wecowska, Campos and HobdayTang et al. (2009), who distinguished between having an internal organization wholly within the university structure, an organization operating outside of the university but reporting to it, an external nonprofit-making organization wholly owned by the university but operating autonomously and reporting to a board for all decisions, and an external profit-making commercial organization listed on the stock exchange.
Using survey data for 2006 and 2007, Reference Rogers, Helmers, Baghurst and PollardRogers et al. (2009) showed that the share of universities using the services of external agents was increasing. Unsurprisingly, the universities that managed their IP licensing and filing internally tended to have larger KTOs. Even those universities that fully outsourced their IP activities and those that did not engage in IP at all still maintained an internal department for the management of other types of knowledge transfer activities. However, despite the variety of models, KTOs tended to centralize all university invention and commercialization activities and required all academic staff to notify them of their discoveries and to delegate all rights to negotiate licenses on their behalf. This prompted some (Reference Rogers, Helmers, Baghurst and PollardRogers et al. 2009; Reference Tang, Wecowska, Campos and HobdayTang et al. 2009) to call for more varied approaches to knowledge transfer.
In a more recent study, Reference Sengupta and RaySengupta and Ray (2017) suggest that models of knowledge transfer governance have indeed grown more decentralized over time. By focusing on two dimensions – the extent to which knowledge transfer management is outsourced or performed in-house, and the extent to which knowledge transfer responsibilities are centralized or devolved to individual departments – their study identifies four models: coordinating KTO: most knowledge transfer functions are devolved to departments and performed in-house; absentee KTO: most knowledge transfer functions are devolved to departments and outsourced; traditional KTO: most knowledge transfer functions are controlled centrally and performed in-house; outward-facing KTO: most knowledge transfer functions are controlled centrally, with some outsourced. They also argue that: (1) universities whose strategy involves engagement with research users are more inclined to devolve a higher proportion of knowledge transfer responsibilities to departments, and (2) universities that exhibit relatively high volumes of application-oriented research outputs are more inclined to wholly or partly outsource key KTO functions to external organizations.
According to data from HESA, in 2013–14 only nineteen universities out of 161 (11.8 percent) did not have a formal KTO. The remaining 142 had an internal KTO or a subsidiary company (either majority or minority owned), or both. The functions of the KTO included providing support for SMEs (82 percent), drawing up contracts for various kinds of knowledge transfer interaction (66 percent), and providing indemnity insurance for staff (87 percent).
Most universities had some infrastructure to manage the filing and commercialization of patents and other types of IP. As many as 146 universities (91 percent) had a formal structure (whether an internal office or external agency) in place to support the process of seeking protection for their IP. Eighty-four percent also had a formal structure (whether an internal office or external agency, or both) to support IP commercialization. Infrastructures to support academic and student entrepreneurship were also widespread: most universities provided business advice and entrepreneurship training services, followed by seed-corn investment and incubators, and finally by venture capital and science park accommodation. All these services were provided either directly by the university or by a partner organization, or both.
Most universities implemented incentives for academics to engage in knowledge transfer and to disclose their activities to the institution. Compulsory disclosure requirements were widespread. Furthermore, 80 percent of universities rewarded their staff individually (financially or by other means) for the IP they generated, and most universities (91 percent) believed that staff had medium or high incentives to engage in knowledge transfer. Academics’ freedom to engage in private consulting activities presented a more mixed picture, since only 34 percent reported that they had a policy allowing them to do so; those that did allowed academics to spend, on average, twenty-eight days per year on private consulting.
Despite the vast improvement in KTOs’ resources, competencies and strategies, a number of bottlenecks and barriers to knowledge transfer persist (Science and Technology Committee 2017). These include lack of access to finance to commercialize research, particularly early-stage funding and sustained funding for longer-term commercialization projects; difficulty in valuing IP assets and a lack of negotiating skills; the complexity of the policy support mechanisms for research and innovation; and the lack of a clear role for regional policymaking bodies in supporting knowledge transfer.
4.6 Conclusion
In the United Kingdom, as in many other countries, there has been a recurrent concern that university engagement with industry is not part of the institutional ecosystem for innovation in the way that such engagement is for US universities (Reference Rosenberg and NelsonRosenberg and Nelson 1994). In order to promote knowledge transfer, the UK government, while concerned to make the academic sector accountable for the public science funding it receives, has always preferred a light-touch approach based on the creation of appropriate incentives rather than centralized management. This incentive-based approach to policy, combined with universities’ extensive operational flexibility and autonomy (whereby they have extensive freedom to alter courses, compete for students and research with other universities, hire faculty and develop new revenue streams), makes the UK university system more similar to the U.S. one than to higher education systems in continental Europe. At the same time, the reliance on public funding has made it less similar to the U.S. and more similar to Europe. This halfway positioning of the UK model provides an interesting case study for those countries with predominantly publicly-funded systems that intend to adopt an incentive-based approach to policy.
The UK case study confirms that knowledge transfer as a phenomenon is characterized by strong path dependency and a symbiotic relationship with the underlying socioeconomic structure of the country and its regions. The United Kingdom’s older, most research-intensive institutions have historically maintained strong relationships with industry, including with large industrial firms and the public sector, including defense. Policies directed at supporting knowledge transfer have allowed these universities to institutionalize knowledge transfer processes that were previously carried out by individual academics and research groups, and to increase the scale of their knowledge transfer engagement. Intensive engagement with industry via research contracts and patent commercialization remains typical of a small number of institutions. Other universities, particularly those that were previously vocational training colleges, also had historical relationships with industry, but these mainly revolved around training and problem-solving activities. For these universities, the institutionalization of knowledge transfer has mostly implied a scaling-up of their training and consultancy operations. Hence, universities’ growing incentives to engage in knowledge transfer have led them to build on their preexisting networks, competencies and capabilities, and to develop models of engagement that are in harmony with the needs of the actors in their local social and economic context.
We can also draw some lessons from the specific kind of incentives that the UK system has generated. The main policy tool used by the UK government to foster university–industry interaction and knowledge transfer has been the provision of performance-based funding in order to create financial incentives for universities to engage in knowledge transfer activities and achieve measurable results that can be rewarded economically. This is different from the U.S. model, where individuals are rewarded for better performance by direct income-generating activities, often taxed very lightly. However, universities in the United Kingdom do reward their star scientists and researchers with better pay and promotion prospects, reflecting their reliance on such individuals’ performance to attract research income. Moreover, since knowledge transfer activities are income-producing in themselves, in a period of prolonged decline in public funding, universities have had strong incentives to engage in knowledge transfer activities irrespective of the presence of policy schemes.
Universities’ incentive to play to their strengths by engaging in those activities where they are more likely to be successful, and the government’s lack of precise direction on what activities they should be engaging in, has led universities to adopt a varied range of modes of engagement, in terms both of the variety of knowledge transfer activities undertaken and of the organizational models they have adopted in order to carry them out. The variety of approaches shows a broad experimentation with a strategy that best suits the comparative advantages of the university.
At the same time, there are some risks inherent in having a system of incentives to engage in knowledge transfer that are primarily monetary in nature. First, they may encourage universities to refrain from engaging in activities that are beneficial for society while generating little or no income for the university (Reference Rossi and RosliRossi and Rosli 2015). Second, these incentives may encourage universities to focus predominantly on forms of research that are certain to bring economic rewards in the relatively short term, moving away from more uncertain and risky basic research. A reorientation of the system toward more commercializable research appears to have occurred in the PSRE sector, too. However, this raises the question whether the UK system is generating enough basic research on its own to keep it at the science frontier and make it possible to quickly absorb and exploit new technology – a question that is particularly pressing in the context of the present productivity stagnation in the UK economy (see, e.g., The Economist 2017). Evidence from the United Kingdom that high levels of engagement in patenting on the part of academics (in both applied and theoretical fields) reduces their scientific productivity (Reference Crespi, D’Este, Fontana and GeunaCrespi et al. 2011; Reference Banal-Estanol, Jofre-Bonet and LawsonBanal-Estanol, Jofre-Bonet, and Lawson 2015) suggests that a broader debate on the effects of strong incentives to engage in knowledge transfer on the amount and nature of basic research pursued in academia should be had.
Hence, policymakers should think very carefully about the consequence of performance-based funding on the performance of the overall system. Public funding of R&D rests on the argument that there is a market failure that leads to private underinvestment in basic research. Creating a system of monetary incentives for universities based on success at commercialization risks undermining this basic goal. If universities are to continue to engage in basic research, we have to accept that some universities may never do knowledge transfer – there must be slack in the system.
As in everything else, we have come full circle but the golden mean remains elusive.


 Open access