


Introduction
The present Arctic ice shelves off the north coast of Ellesmere Island (Fig.1a) have a total area of about 1350 km2 and are the remnants of the once-extensive Ellesmere Tee Shelf. The latter most likely existed as a continuous fringe of thick ice from Point Moss to Nansen Sound (Reference Koenig, Greenaway, Dunbar and Hattersley-SmithKoenig and others 1952) (Fig.la). During the last 100 years, the disintegration of the Ellesmere Ice Shelf has created ice islands that drift in the Arctic Ocean (Reference Koenig, Greenaway, Dunbar and Hattersley-SmithKoenig and others 1952).

Fig. 1 a. Location map of Milne Ice Shelf on the north coast of Ellesmere Island. b. Map of Milne Ice Shelf showing ice-shelf units, radial cracks, and a suture. The cross-hatched area at Cape Egerton corresponds to the area mapped in Fig.4.
The present ice-shelf extent is of concern with regard to possible locations of future ice-island calvings and areas of ice-shelf re-growth. Commonly, the ice shelves increase their lateral extent by the seaward addition of pack ice, although horizontal growth rates are not constant due to interruption and reversal by calving events (Reference Lyons and RagleLyons and Ragle 1962). Reference Jeffries and SersonJeffries and Serson (1986) mapped the extent of multi-year land-fast sea ice between Yelverton Bay and Ward Hunt Ice Shelf in 1984.
The link between ice shelves and ice islands was established largely due to the similarity of their striking surface topography of parallel ridges and troughs (Reference Koenig, Greenaway, Dunbar and Hattersley-SmithKoenig and others 1952). Similar, but smaller undulations occur on multi-year land-fast sea ice (Reference Hattersley-SmithHattersley-Smith 1957; Reference Ragle, Blair and PerssonRagle and others 1964; Reference Jeffries and SersonJeffries and Serson 1986). Reference Hattersley-SmithHattersley-Smith (1957) reviewed possible origins of the undulations or “rolls”, but there have been no systematic studies of this phenomenon.
Ice shelves, multi-year land-fast sea ice, and their surface features are visible on air photographs and SLAR (side-looking airborne radar) images of the north coast of Ellesmere Island. The remote-sensing record for Milne Ice Shelf (Fig.1a) is particularly good and has been chosen for the study reported here. The purpose of the study was to use air photographs, SLAR imagery, and ground observations, and to assess the usefulness of each, for detailed mapping of ice losses and ice gains, and mapping of ice-surface features.
Remote Sensing and Ground Observations of Arctic Ice Shelves
Background
Air photographs have proven to be useful in establishing the location of ice-island calvings. Reference Koenig, Greenaway, Dunbar and Hattersley-SmithKoenig and others (1952) compared early photographs of ice islands with 1950 trimetrogon air photography of the ice shelves and established that the ice islands had broken away from the ice shelves. The massive calving of ice from Ward Hunt Ice Shelf was first observed during RCAF reconnaissance flights in early 1962 and photographed in June 1962 (Reference Hattersley-SmithHattersley-Smith 1963). A comparative study of 1959 and 1974 photography established that Ayles Ice Shelf had moved 5 km out of Ayles Fiord (Reference JeffriesJeffries 1986[a]). Jeffries also showed that 33 km2 of ice calved from Milne Ice Shelf prior to 1974.
In recent years there has been renewed interest in ice-shelf remote sensing in view of potential ice-island calvings that could pose a subsequent threat to offshore operations in the southern Beaufort Sea. Imagery obtained in the 1980s includes air photographs, SLAR, and SAR (synthetic aperture radar). The SAR imagery is proprietary and, therefore, unavailable. Also, since 1982 field work in this region has included observations of coastal ice conditions, particularly between Yelverton Bay and Ward Hunt Ice Shelf (Fig.1a; Reference Jeffries and SersonJeffries and Serson 1986).
For the purposes of visual and photographic observations, the surface topography of the ice shelves appears best on nearly cloud-free summer days. However, there are few days on which conditions are suitable for high-level air photography. Thus, summer and non-summer opportunities for successful visual and photographic reconnaissance are limited. The SLAR technique has the advantage of being able to operate year-round under almost any weather conditions. SLAR images of the ice shelves have been obtained from aircraft flying parallel to the coastline.
Outer Milne Ice Shelf
Milne Ice Shelf is the second largest remaining ice shelf and has a total area of about 290 km2. On the basis of ice thickness, surface morphology, and surface features, the ice shelf has been subdivided into three distinct units (Fig.1b) (Reference JeffriesJeffries 1986[b]). The outer unit, with an area of 140 km2 and a maximum thickness of 90 m (Reference PragerPrager unpublished), is the subject of this paper. The purpose of this section is to provide a background description of the surface morphology and features of shelf ice and multiyear land-fast sea ice according to their appearance on air photographs and SLAR imagery.
On outer Milne Ice Shelf the authors have measured the troughs to be as much as 7.5 m deep (ridge top to trough bottom), but most are about 5 m deep. Beginning in July, melt water accumulates in the bottom of the troughs and creates elongated melt pools. On air photographs the melt water creates a dark tone that contrasts with the lighter tone of ice exposed on the ridges (Fig.2a). As at other ice shelves, the rolls on the outer unit are aligned approximately parallel to the coastline. Details of melt-pool orientation will be discussed in a later section. The “look- direction” of the SLAR is essentially perpendicular to the rolls and the troughs are picked out by the radar shadows cast by adjacent ridges (Fig.2b). The ridges appear as a lighter grey tone and suggest greater relative relief or a steeper slope angle, giving rise to the brighter radar reflection.

Fig. 2 a. Left. Vertical air-photo mosaic of outer Milne Ice Shelf taken in July 1959. The ice island that calved in 1964–67 is marked A. Photographs available from the National Air Photographic Library, Ottawa, Ontario, Canada. b. Right. X-band SLAR image of outer Milne Ice Shelf taken in May 1983. The dry snow-pack had a mean depth of about 60 cm. Imagery available from Atmospheric Environment Service, Downsview, Ontario, Canada.
Cutting across the general orientation of the rolls are three radial cracks, one of which shows as a very dark tone as a result of being water-filled (Figs 1b and 2a). Only one of these cracks remained in 1983 (for reasons to be discussed) and it shows clearly in Fig.2b. The crack itself is a dark tone or shadow cast by the north slope, while the south slope (north-facing) is a lighter grey reflection facing the incoming radar signal. Similar shadows and bright edges also emphasize a second linear, crack-like feature (or suture) at the north-east side of the outer unit (Figs 1b and 2b). This feature is less obvious on air photographs because it does not contain any water (Fig.2a). This was also true in 1984 air photographs.
The fractures cut across the general trend of the rolls, but ground observations show that their morphology does not markedly differ from that of typical troughs. The fractures are similar in width to troughs, and their smooth slopes, as opposed to sharp edges, suggest that the fractures are very old features that have been modified by melt- water processes. The erosion of sharp edges smooths the slopes of the fractures and hence they do not have a very bright radar signature (Fig.2b).
Two of the radial cracks noted in the previous paragraph formed the boundaries of an ice-island calving that occurred at some time during the interval 1959–74 (Reference JeffriesJeffries 1986[a]). The calving includes the loss of shelf ice and old land-fast sea ice at Cape Evans. While the sea ice at Cape Evans was lost with the ice island, sea ice at Cape Egerton remained. On 1983 SLAR imagery, this long narrow strip of sea ice appears as a very dark grey tone at the northern edge of the ice shelf (Figs 2b and 4). After the ice-island calving at Cape Evans, the lost shelf ice was replaced by thick sea ice now known as the Milne Reentrant. In 1983, this extensive area of ice at the southwest shelf front appeared as a featureless, mottled, dark grey tone (Fig.2b). Milne Re-entrant, however, has evolving features as evidenced by the small-scale ridge-and-trough systems shown in Fig.5. During surface traverses in spring 1985, the troughs were found to be up to 1 m deep and, therefore, were probably too small to be resolved by the SLAR system. On the other hand, pressure ridges up to 5 m high, separating the re-entrant from the pack ice, created a clear bright reflection on SLAR (Fig.2b). Likewise, there is a bright linear reflection at Cape Egerton that suggests a pressure ridge in the fast ice. The presence of many flat facets, oriented in many directions, in such ridges means that some of them will provide specular reflection of the incident SLAR radiation and produce bright returns on the images.
Ice Calving and Re-Growth
Since the advent of aerial and ground survey of the ice shelves after 1950, it has been possible to document ice-shelf losses and ice re-growth. In this section, the available information is used to map recent changes at the front of Milne Ice Shelf, It is noted that there is no evidence to suggest that the ice shelf is moving forward, rather the ice front is quasi-stationary.
Sequences of ice loss and re-growth are shown in Fig.3. There are two notable features of the ice front. First, there is the persistence of an area of very old sea ice at Cape Egerton, The ice was first photographed in 1950 and has, therefore, remained in place for at least 36 years. Secondly, there is the ice-island calving that occurred in 1959–74 near Cape Evans (Fig.3c).

Fig. 3 Sequence of sea-ice ioss and re-growth at the front of Milne Ice Shelf mapped from air photographs (A, B, C, and F) and SLAR imagery (D and E). The dark shading at Cape Egerton denotes very old sea ice. The area of sea ice in each year is as follows: 1950, 4.5 km2; 1959, 5.0 km2; 1959, 5.0 km2; 1974, 40.0 km2; 1981, 1983, 1984, 42.0 km2.
The cause of the calving is unknown, but it occurred along two of the radial cracks which were clearly weaknesses in the ice. Likewise, the exact date of calving is unknown, but by 1974 the lost shelf ice had been replaced entirely by the sea ice of Milne Re-entrant. Ground observations and salinity and isotope analysis of ice cores indicate that the sea ice is 19–22 years old and, therefore, that the calving occurred that long ago (Reference Serson, Sackinger, Stringer and SersonSerson 1984; Reference JeffriesJeffries unpublished).
Since 1974, the area of sea ice at the ice-shelf front has remained fairly constant, maintaining a balance between ice loss and ice re-growth. In the previous section, a pressure ridge was noted in the sea ice east of Cape Egerton (Fig.2b). In Spring 1985 it was observed that some of this ice had broken away along the line of the pressure ridge, reducing the sea-ice area to about 40 km2.
Variations in the extent and location of sea-ice accretion are probably related in some degree to pack-ice movement across the mouth of Milne Fiord. The dominant sea-ice motion is episodic and to the west along the coast. It is reasonable, therefore, to expect that pack ice will pile up against prominent coastal features. This occurred at Markham Bay Re-entrant, for example, where pack-ice interaction with Ward Hunt Ice Shelf caused rafting and hummocking in the sea ice that subsequently became fast and an integral part of the ice shelf (Reference Ragle, Blair and PerssonRagle and others 1964). At Cape Egerton, Milne Ice Shelf protrudes slightly into the pack ice, acting as a thick ice obstacle against which some pile-up will occur. Some of the very old sea-ice strip might have formed in this way. Ground observations in 1983–85 show no evidence of old, weathered pressure ridges on Milne Re-entrant, Lying in the shelter of the main ice-shelf mass and less subject to pack-ice motion, except at the outer margin, the sea ice in Milne Re-entrant has entirely replaced the former ice shelf.
Melt Pools
The ridge-and-trough systems on the ice shelves and land-fast sea ice are best observed and photographed in summer when the troughs contain water in the form of elongated melt pools. Reference Hattersley-SmithHattersley-Smith (1957) and Reference CraryCrary (1960) concluded that the ridge-and-trough systems are the result of strong summer winds in association with annual melt-water drainage. But, it has also been suggested that pack-ice pressure and ridge formation will influence the original siting of the rolls (Reference Hattersley-SmithHattersley-Smith 1957). With the completion of air photography in 1984 there was available a high-quality and long-term photographic record of the ice shelf and sea ice of outer Milne Ice Shelf. Using this series of photographs, the melt-pool patterns on the ice near Cape Egerton (Fig.1a) have been mapped (Fig.4). The purpose of this section is to examine melt-pool sequences and evolution near Cape Egerton (Fig.4a) and on Milne Re-entrant (Fig.5).
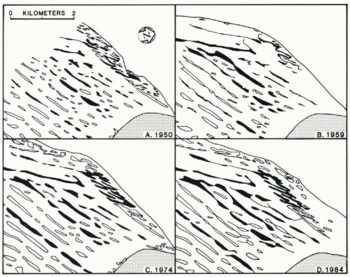
Fig. 4 Sequential maps of melt-pool development and orientation on ice shelf and sea ice at Cape Egerton mapped from air photographs. The shaded melt pools represent particular sequences of elongation and coalescence. Fig.4a shows all the information available from the 1950 photography.

Fig. 5 Vertical air-photo mosaic of Milne Re-entrant, July 1984. In 1974, the melt pools had already developed an elongated pattern which was even better defined by 1984. The better definition might be a function of the amount of melt water present at the ice surface, but is more likely to be the result of melt-pool evolution by elongation and coalescence.
Wavelength, elongation, and coalescence
On Milne Re-entrant and the old sea ice at Cape Egerton, the wavelength of the rolls varies from 60 to 100 m with a mean of 90 m (Figs 4 and 5). On the ice shelf the wavelength varies from 135 to 450 m with a mean spacing of almost 330 m (Figs 2 and 4). It is also noted that sea-ice melt pools are neither as long nor as wide as those on the ice shelf (Fig.4). Furthermore, on shelf or sea ice, the width and length of melt pools increases as the age of the ice increases (Figs 4 and 5). For example, in 1950, the melt pools on the old sea ice at Cape Egerton showed a quite high degree of elongation (Fig.4a) and, therefore, had probably been in place for a number of years. Since that time, many of the smaller and more randomly scattered pools have coalesced until the entire melt-pool system has evolved into one of fewer, but better defined, elongate pools (Fig.4c and d).
The amount of water in the troughs determines, to some extent, the appearance of the melt pools. However, not only the amount of melt water must be considered, but also lateral convective processes of the melt water. Reference LanglebenLangleben (1972) has described the processes that tend to create a series of randomly scattered pools on freely floating sea ice. In a discussion of the ice-shelf rolls, Crary (I960) noted that fresh water on ice is a very efficient medium for melting ice because of its lower albedo and convection processes below 4°C. High surface winds pile up water down-wind and at the same time increase the convection currents. On fast ice, therefore, any series of randomly scattered ponds should in time form elongated lake systems (Fig.4) under the influence of a system of prevailing winds. Fast ice remaining in a fixed position throughout the summer melt season will have melt pools subject to the same dominant wind direction. Therefore, melt-pool elongation will tend to occur as the heat-transfer processes are concentrated at the down-wind ends of melt pools. As melt pools lengthen and drainage from the adjacent ridges proceeds, the hills separating melt pools will narrow and eventually be completely removed. Some melt pools appear to be connected by narrow streams (Fig.4d) that are evidence of the removal of such hills. As a consequence, melt pools will coalesce and lengthen further. The processes of elongation and coalescence are suggestive of stream-drainage network evolution and give rise to the characteristic linear surface drainage patterns on the ice in the presence of a system of prevailing winds.
Orientation
There is no wind-direction data available for outer Milne Ice Shelf. However, if it is the case that the melt pools elongate and coalesce in the direction of the prevailing winds, the dominant wind directions can be ascertained from the orientation of the ridges and troughs. Roll orientations have been mapped from air photographs.
The majority of the large or primary rolls on the ice shelf, together with the small undulations on Milne Re-entrant, are oriented approximately 030–210° with respect to true north. A second orientation of about 050–230° corresponds to the rolls on the old sea ice at Cape Egerton and two melt-water lakes (one with a distinct hook; Fig.4) or secondary rolls, at the front of the ice shelf. The primary and secondary roll orientations also correspond respectively to the two coastal trends at this location: (1) a general coastal trend approximated by the long fetch of Yelverton Bay (Fig.1a), and (2) the mouth of Milne Fiord between Cape Evans and Cape Egerton.
The data indicate two principal wind directions that essentially blow along the coast. A similar situation was recorded at Ward Hunt Ice Shelf where roll orientations were well correlated with prevailing east-west, summer winds blowing parallel to the coastline (Crary I960). At Milne Ice Shelf the melt-pool evidence suggests that south-westerly winds blow from across Yelverton Bay while north-easterlies follow the Cape Evans—Cape Egerton trend. Moreover, since the winds have their greatest effect during summer and the greater proportion of the rolls are oriented parallel with westerly winds, in summer the latter are probably more dominant than easterly winds.
Easterly winds appear to cause some secondary coalescence and elongation at the expense of the primary melt pools. This process is especially evident in the region of the hooked melt pool where the primary pools have gradually changed orientation since 1950 (Fig.4). This might be evidence of a shift in the prevailing wind directions, but it seems unlikely in view of the fact that melt-pool orientations on the re-entrant have not developed an easterly trend.
Conclusion
Ice shelves and land-fast sea ice are clearly visible on air photographs and SLAR imagery. Both SLAR and air photographs show extensive sea-ice growth at the front of Milne Ice Shelf since 1950 alone. For the purpose of mapping ice loss and re-growth, SLAR imagery is preferable to air photographs, since with SLAR the entire area of concern is shown in one image, with sufficient detail, whereas air photographs require the composition of air-photo mosaics and subsequent reduction. SLAR covers a wider area in a shorter time than air photographs and is, therefore, more cost effective. Conversely, air photographs are more effective than SLAR for detailed study of ice- surface features. The undulating surface topography of the ice shelf and sea ice is delineated by melt pools in summer air photographs. The large-scale ice-shelf undulations are clearly visible on SLAR, but smaller-scale sea-ice undulations can not be resolved. Furthermore, SLAR images are of insufficient scale to show the development of individual ridges and troughs. Using sequential air photographs, melt pools can be mapped. It is apparent that the rolls evolve over a long period of time as a result of melt-pool coalescence and elongation. This process tends to occur in the direction of prevailing summer winds. Summer westerlies account for the primary melt-pool orientation, although in some instances this has been modified by summer easterlies. The modification of the melt-pool orientations is probably related more to local effects (topography and ice-shelf extent) rather than a shift in prevailing wind direction.
Acknowledgements
Work on Arctic ice shelves was initiated while Martin O Jeffries was a graduate student at the University of Calgary. Field work along the north coast of Ellesmere island was made possible through the logistic support of the Polar Continental Shelf Project (PCSP, Mr G D Hobson, Director). Financial support came from the Arctic Institute of North America, Defence Research Establishment Pacific, Gulf Canada Resources Inc., Dome Petroleum Ltd, Petro- Canada, and the University of Calgary (Alberta Research Council Scholarship). PCSP also provided the Twin Otter aircraft for the 1984 air photography mission and we thank David Terroux for operating the aerial camera. Work at the Geophysical Institute, University of Alaska, is funded by the US Department of Energy, Morgantown Energy Technology Center, Morgantown, West Virginia.


