


1 Introduction
Acoustic noise generated by the interaction of large-scale flow structures with the quasi-periodic shock pattern in supersonic jet plumes is typically categorised into broadband shock associated noise and the screech tones. The high amplitudes of the screech tones and their harmonics can dominate the overall sound pressure levels in the far field. Powell (Reference Powell1953) explained screech as a resonance phenomenon, where coherent flow structures provoke upstream propagating acoustic waves when interacting with the shock train. The upstream propagating acoustic waves excite the sensitive mixing layer in the nozzle vicinity to initiate the downstream convecting flow structures closing the feedback loop.
The understanding of the screech phenomenon has been improved significantly in recent years (as summarised by Edgington-Mitchell (Reference Edgington-Mitchell2019)). Tam & Hu (Reference Tam and Hu1989) and Tam & Norum (Reference Tam and Norum1992) derived a dispersion relation based on a vortex sheet model for upstream and downstream propagating pressure perturbations to determine the instability wave character leading to screech. Tam & Hu (Reference Tam and Hu1989) found a special family of upstream propagating waves which follow the jet column and close the screech feedback loop. The existence of these neutral waves was confirmed numerically by Shen & Tam (Reference Shen and Tam2002), Gojon, Bogey & Mihaescu (Reference Gojon, Bogey and Mihaescu2018), Gojon, Gutmark & Mihaescu (Reference Gojon, Gutmark and Mihaescu2019) and experimentally by Edgington-Mitchell et al. (Reference Edgington-Mitchell, Jaunet, Jordan, Towne, Soria and Honnery2018). However, the mechanism generating the screech tones is debated. Suzuki & Lele (Reference Suzuki and Lele2003) showed that shocks can leak through vorticity saddle points of a vortex-laden mixing layer. Harper-Bourne & Fisher (Reference Harper-Bourne and Fisher1973) noticed that the acoustic waves emitted by multiple shock-leaking events can couple as a low-frequency oscillation (of the order of screech) due to positive interference. Tam, Parrish & Viswanathan (Reference Tam, Parrish and Viswanathan2014) highlighted that the experimentally visualised acoustic waves associated with screech do not originate from the tips of the shocks. Alternatively, Tam & Tanna (Reference Tam and Tanna1982) suggested that the acoustic waves are generated by sources with supersonic wave speed causing Mach wave radiation.
Less research has been devoted to the origin of higher screech tone harmonics, which occur for large jet plume distortions. Berland, Bogey & Bailly (Reference Berland, Bogey and Bailly2007) showed numerically that a flapping screech mode shifted the shocks to the outer boundaries of the jet mixing layer, where the shocks leaked into the ambient while performing a rotational motion following the flapping of the jet plume. The screech tones were found to be prominent in the upstream receiver angles, while the highest amplitudes of the second harmonic were received in the far field at  $80^{\circ }$ from the jet axis. The observation of different radiation characteristics of the screech tones and their corresponding harmonics was supported by analytical modelling (Norum Reference Norum1983; Tam et al. Reference Tam, Parrish and Viswanathan2014). Tam et al. (Reference Tam, Parrish and Viswanathan2014) hypothesised that the instability wave would become nonlinear for strong screech, and the harmonics are generated while interacting with the shocks. Based on this assumption, the analytical model predicted a tonal directivity in agreement with experimental measurements. For rectangular nozzles, Raman & Rice (Reference Raman and Rice1994) and Berland et al. (Reference Berland, Bogey and Bailly2007) noted that the acoustic waves emitted at the fundamental screech frequency and its third harmonic were asymmetric, whereas the second and fourth harmonics were observed to be symmetric. Tam & Norum (Reference Tam and Norum1992) showed that symmetric and asymmetric modes are possible wave solutions satisfying the dispersion relation for rectangular nozzle exhausts. Shen & Tam (Reference Shen and Tam2002) provided evidence that two screech modes can coexist simultaneously in circular exhausts. Whether coexistent modes or another mechanism causes the higher harmonics of screech tones is presently unknown.
With the present investigation, we reveal the generation mechanism of the higher screech harmonics. Time-resolved shadowgraph images exhibit the interaction process of shocks and passing flow structures. Using dynamic mode decomposition, the statistical importance of the described mechanism is analysed in the mixing layer, and the convection speed of the coherent structures is determined. By superposition of the screech and its higher harmonic modes, the existence of modal resonance is proven. The acoustic wave radiation patterns related to screech and its harmonics are extracted from the shadowgraph images, which indicate the origin of the tones. The acoustic source location is shown to coincide with the interaction process of the shocks and the coherent structures for the third and the higher screech harmonics.
2 Experimental set-up
A rectangular single expansion ramp nozzle is investigated in a range of nozzle pressure ratios referencing the nozzle inlet total pressure,  $p_{0,n}$, to the ambient pressure, $p_{\infty }$. Such two-dimensional nozzles comprise convergent and divergent contours only along one side. This facilitates the integration on aircraft with blended wing bodies (see e.g. Hileman et al. (Reference Hileman, Spakovszky, Drela, Sargeant and Jones2010)) and allows operation with larger variations of back pressures. Jet exhausts from rectangular, high aspect-ratio nozzles exhibit the potential to achieve low noise emission, because of their rapid potential core breakdown and the relatively small flow structure scales (Gutmark, Schadow & Bicker Reference Gutmark, Schadow and Bicker1990). Figure 1 shows a cut through the investigated nozzle, which is characterised by an area ratio of $1.176$, and a nozzle design Mach number of $1.5$ corresponding to $p_{0,n}/p_{\infty }=3.67$ and an exit velocity $u_{j}$ of $480~\text{m}~\text{s}^{-1}$. The nozzle throat height is $h_{t}=1.69~\text{cm}$, the nozzle exit height is $h_{e}=1.99~\text{cm}$ and the divergent section length is $l_{d}=15.24~\text{cm}$. The throat aspect ratio is 9 except where indicated otherwise. The equivalent nozzle exit diameter, $D_{eq}$, is 6.2 cm. The total temperature at the nozzle inlet is 378 K corresponding to a temperature ratio of 1.25 relative to the ambient.
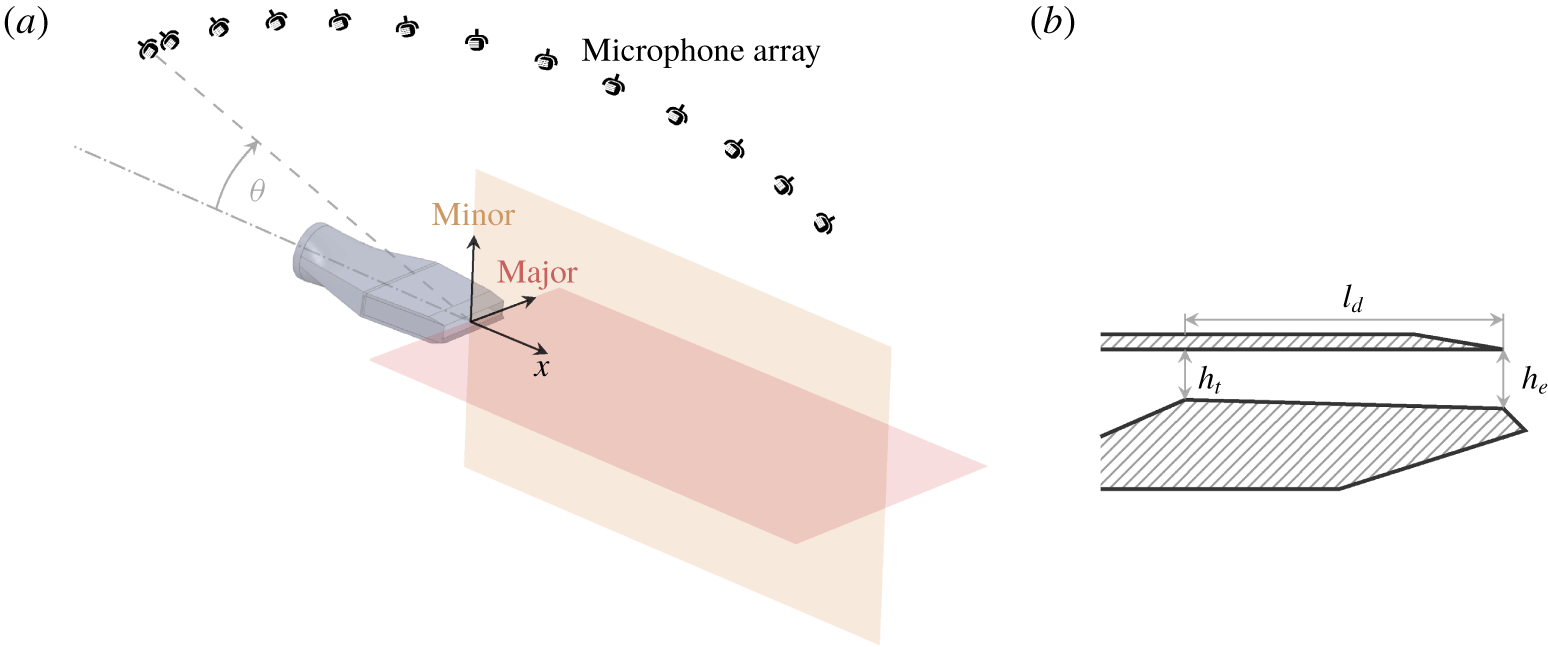
Figure 1. The experimental set-up is outlined in (a), where the camera view is directed via mirrors along the major axis, and the microphones are distributed in the minor axis plane. The single expansion ramp nozzle geometry under investigation is shown in (b), where  $h_{t}$ is the nozzle throat height, $h_{e}$ is the nozzle exit height and $l_{d}$ is the length of the divergent section.
All experiments have been performed in an anechoic chamber (above 350 Hz) with the dimensions of  $7.3~\text{m}\times 7.6~\text{m}\times 3.4~\text{m}$, which is part of the aeroacoustic test facility in the Gas Dynamics and Propulsions Lab at the University of Cincinnati. A high-pressure tank feeds the nozzle stream which allows the operation at various pressure ratios. Details about the facility and its validation have been documented by Callender, Gutmark & Dimicco (Reference Callender, Gutmark and Dimicco2002).
Far-field acoustics are measured by 13 microphones mounted on an arc with a constant radius of 3.43 m ( ${\approx}55D_{eq}$) from the nozzle exit. The microphones are placed surrounding the nozzle from $40^{\circ }$ to $150^{\circ }$ at intervals of $10^{\circ }$ and one additional microphone is located at $35^{\circ }$, where the angles are measured from nozzle axis pointing in the upstream direction. Hence, $0^{\circ }$ points in the nozzle axis against the streaming direction and $180^{\circ }$ with the jet flow direction. The microphones used are $1/4^{\prime \prime }$ Bruel & Kjaer model $4954$ free-field condenser microphones with a frequency sensitivity of up to $204.8$ kHz. The data are chopped into sample segments of 65 536 measurement points for the fast Fourier transform analysis. The sound pressure levels (SPL) are obtained by, $\text{SPL}=20\times \log (\,p_{rms}/p_{ref})$, where $p_{rms}$ denotes the root-mean-square of the bandpass filtered pressure data and the reference pressure $p_{ref}$ was $20~\unicode[STIX]{x03BC}\text{Pa}$.
High-speed shadowgraph imaging in a conventional Z-type configuration is used to visualise the jet exhaust along the nozzle’s major axis. The set-up consists of two 12 inch first surface parabolic mirrors with 1.83 m focal lengths, a Phantom v1610 high-speed camera, a 100 W Oriel arc lamp and a 20 V power supply, which regulates the supply of 5 A to the light source. The recordings consist of 1000 images taken at a sampling rate of 40 000 frames per second.
2.1 Post-processing methodology
The shadowgraph images contain information of the second derivative of density in terms of grey scales for each pixel individually. Dynamic mode decomposition is used to extract the characteristics of the dynamic system in terms of eigenvalues and eigenvectors from the given data series,  $g_{1}^{N}=\{g_{1},g_{2},\ldots ,g_{N}\}$, i.e. the shadowgraph image series with $N=1000$ samples at a time spacing $\unicode[STIX]{x0394}t=25~\unicode[STIX]{x03BC}\text{s}$. An operator, ${\mathcal{L}}$, is defined to describe the linear mapping
 $$\begin{eqnarray}g_{2}^{N}={\mathcal{L}}g_{1}^{N-1},\end{eqnarray}$$
 where  $g_{1}^{N-1}$ and $g_{2}^{N}$ contain the first and the last $N-1$ entries of $g_{1}^{N}$, respectively. Performing the singular value decomposition of the sequence gives $g_{1}^{N-1}=U\unicode[STIX]{x1D6F4}V^{\ast }$ (where $V^{\ast }$ is the conjugate transpose of $V$), which leads to
 $$\begin{eqnarray}g_{2}^{N}={\mathcal{L}}U\unicode[STIX]{x1D6F4}V^{\ast }\Rightarrow U^{\ast }g_{2}^{N}V\unicode[STIX]{x1D6F4}^{-1}=U^{\ast }{\mathcal{L}}U.\end{eqnarray}$$
 Finally, an eigendecomposition of  $U^{\ast }g_{2}^{N}V\unicode[STIX]{x1D6F4}^{-1}$ can be computed, which approximates the eigenvalues, $\unicode[STIX]{x1D706}$, and eigenvectors, $\unicode[STIX]{x1D712}$, of ${\mathcal{L}}$. The dynamic mode shapes, ${\mathcal{G}}_{k}$, can be obtained by the projection of the eigenvector $\unicode[STIX]{x1D712}_{k}$:
 $$\begin{eqnarray}{\mathcal{G}}_{k}=U\unicode[STIX]{x1D712}_{k}.\end{eqnarray}$$
 The dynamic mode magnitudes are defined as  $|{\mathcal{G}}_{k}|/N=\sqrt{\text{Re}({\mathcal{G}}_{k})^{2}+\text{Im}({\mathcal{G}}_{k})^{2}}/N$, the dynamic mode phase angle is defined as $\text{arg}({\mathcal{G}}_{k})=-i\,\text{ln}({\mathcal{G}}_{k}/|{\mathcal{G}}_{k}|)$ and the frequency of the dynamic mode is determined by $f_{k}=\arctan (\text{Im}(\unicode[STIX]{x1D706}_{k})/\text{Re}(\unicode[STIX]{x1D706}_{k}))/(2\unicode[STIX]{x03C0}\unicode[STIX]{x0394}t)$.
3 Results
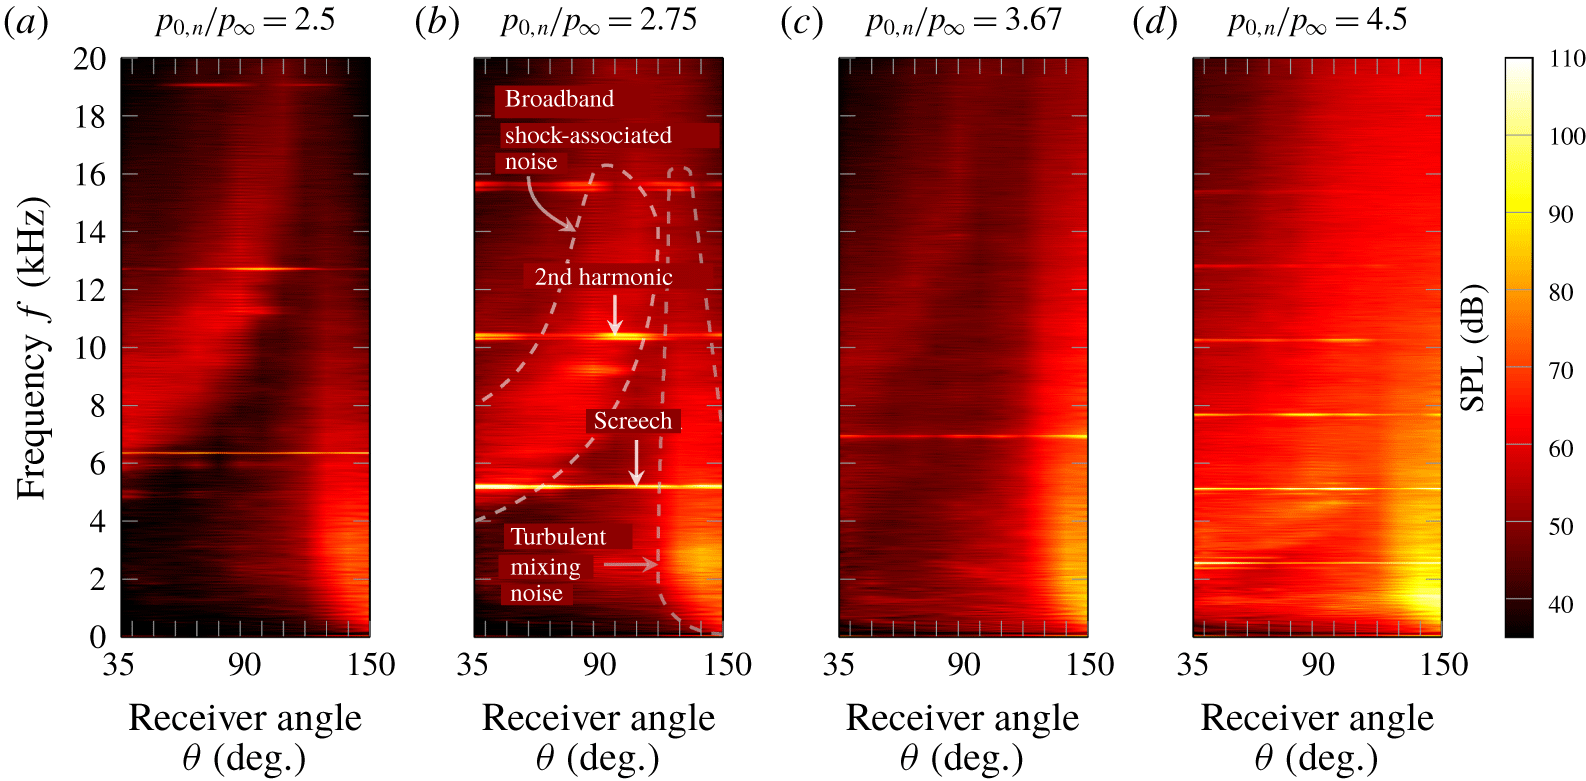
Figure 2. The spectra of the sound pressure levels (dB) recorded in the far field (in the minor axis plane of the nozzle) are shown for the investigated operating conditions.
Three distinguished acoustic noise sources can be identified in figure 2. Large-scale turbulent mixing noise manifests in the downstream receiver angles ( ${>}120^{\circ }$) at the low frequencies. The broadband shock associated noise is prominent in the upstream radiation angles and notable until receiver angles of approximately $120^{\circ }$. The screech tones exhibit high amplitudes for all receiver angles. Broadband shock associated noise and screech tones are present for all investigated nozzle operating conditions, while higher harmonics of screech cannot be observed for the most ideal expanded operating condition, i.e. $p_{0,n}/p_{\infty }=3.67$. In contrast to screech, which is predominant in the upstream and downstream radiation angles, the high amplitudes of the second harmonic manifest in the range of receiver angles between $70^{\circ }$ and $140^{\circ }$.
Figure 3 exhibits the over- and under-expanded shock trains which establish for the investigated operating conditions. The shock cell structure transforms from barrel shaped (for  $p_{0,n}/p_{\infty }\leqslant 2.75$) to a zigzag pattern (for $p_{0,n}/p_{\infty }\geqslant 3.67$). Hence, the length of the shock cells changes and therewith the screech frequency. Figure 3 also shows the contours of the dominant dynamic mode at the screech frequency, which have been obtained from the shadowgraph image series. The contours describe statistically the flapping motion by an alternating pattern of positive and negative contours, where their spatial extent scales with the screech tone frequency and the shock cell length. With the shock cells transforming to a zigzag pattern, the length of the positive and negative contours stretches from a shock leaving the mixing layer until its reflection interacts again with the same mixing layer. The structures are initiated in the mixing layer right downstream of the nozzle exit and grow until meeting at the jet centreline.
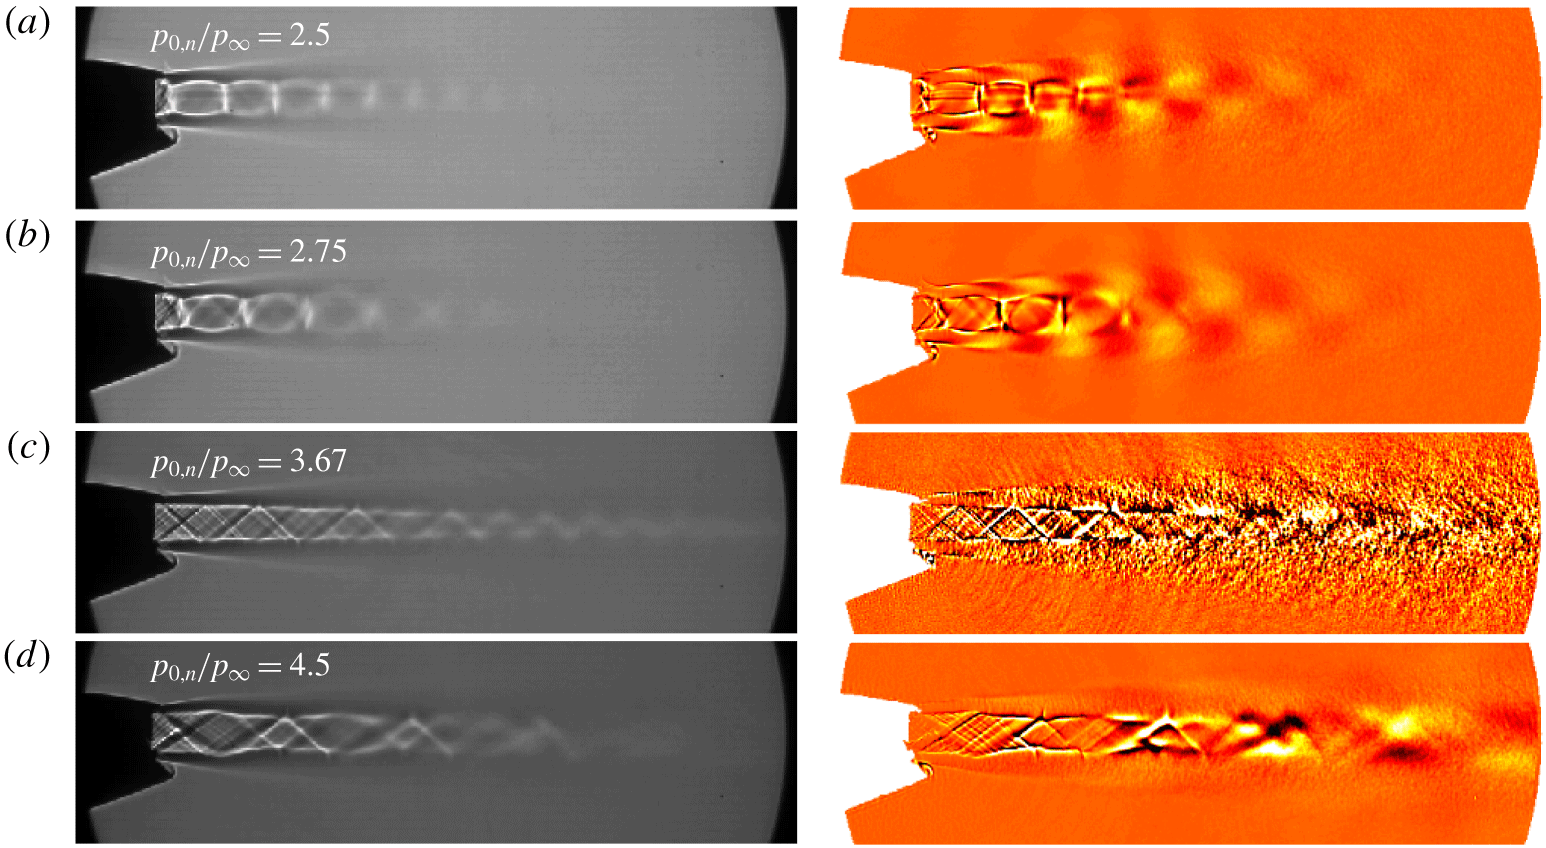
Figure 3. In the left column, time-averaged shadowgraphs illustrate the shock pattern for different operating conditions. The dominant flow structures are shown in the right column in terms of dynamic modes at the screech tone frequency.
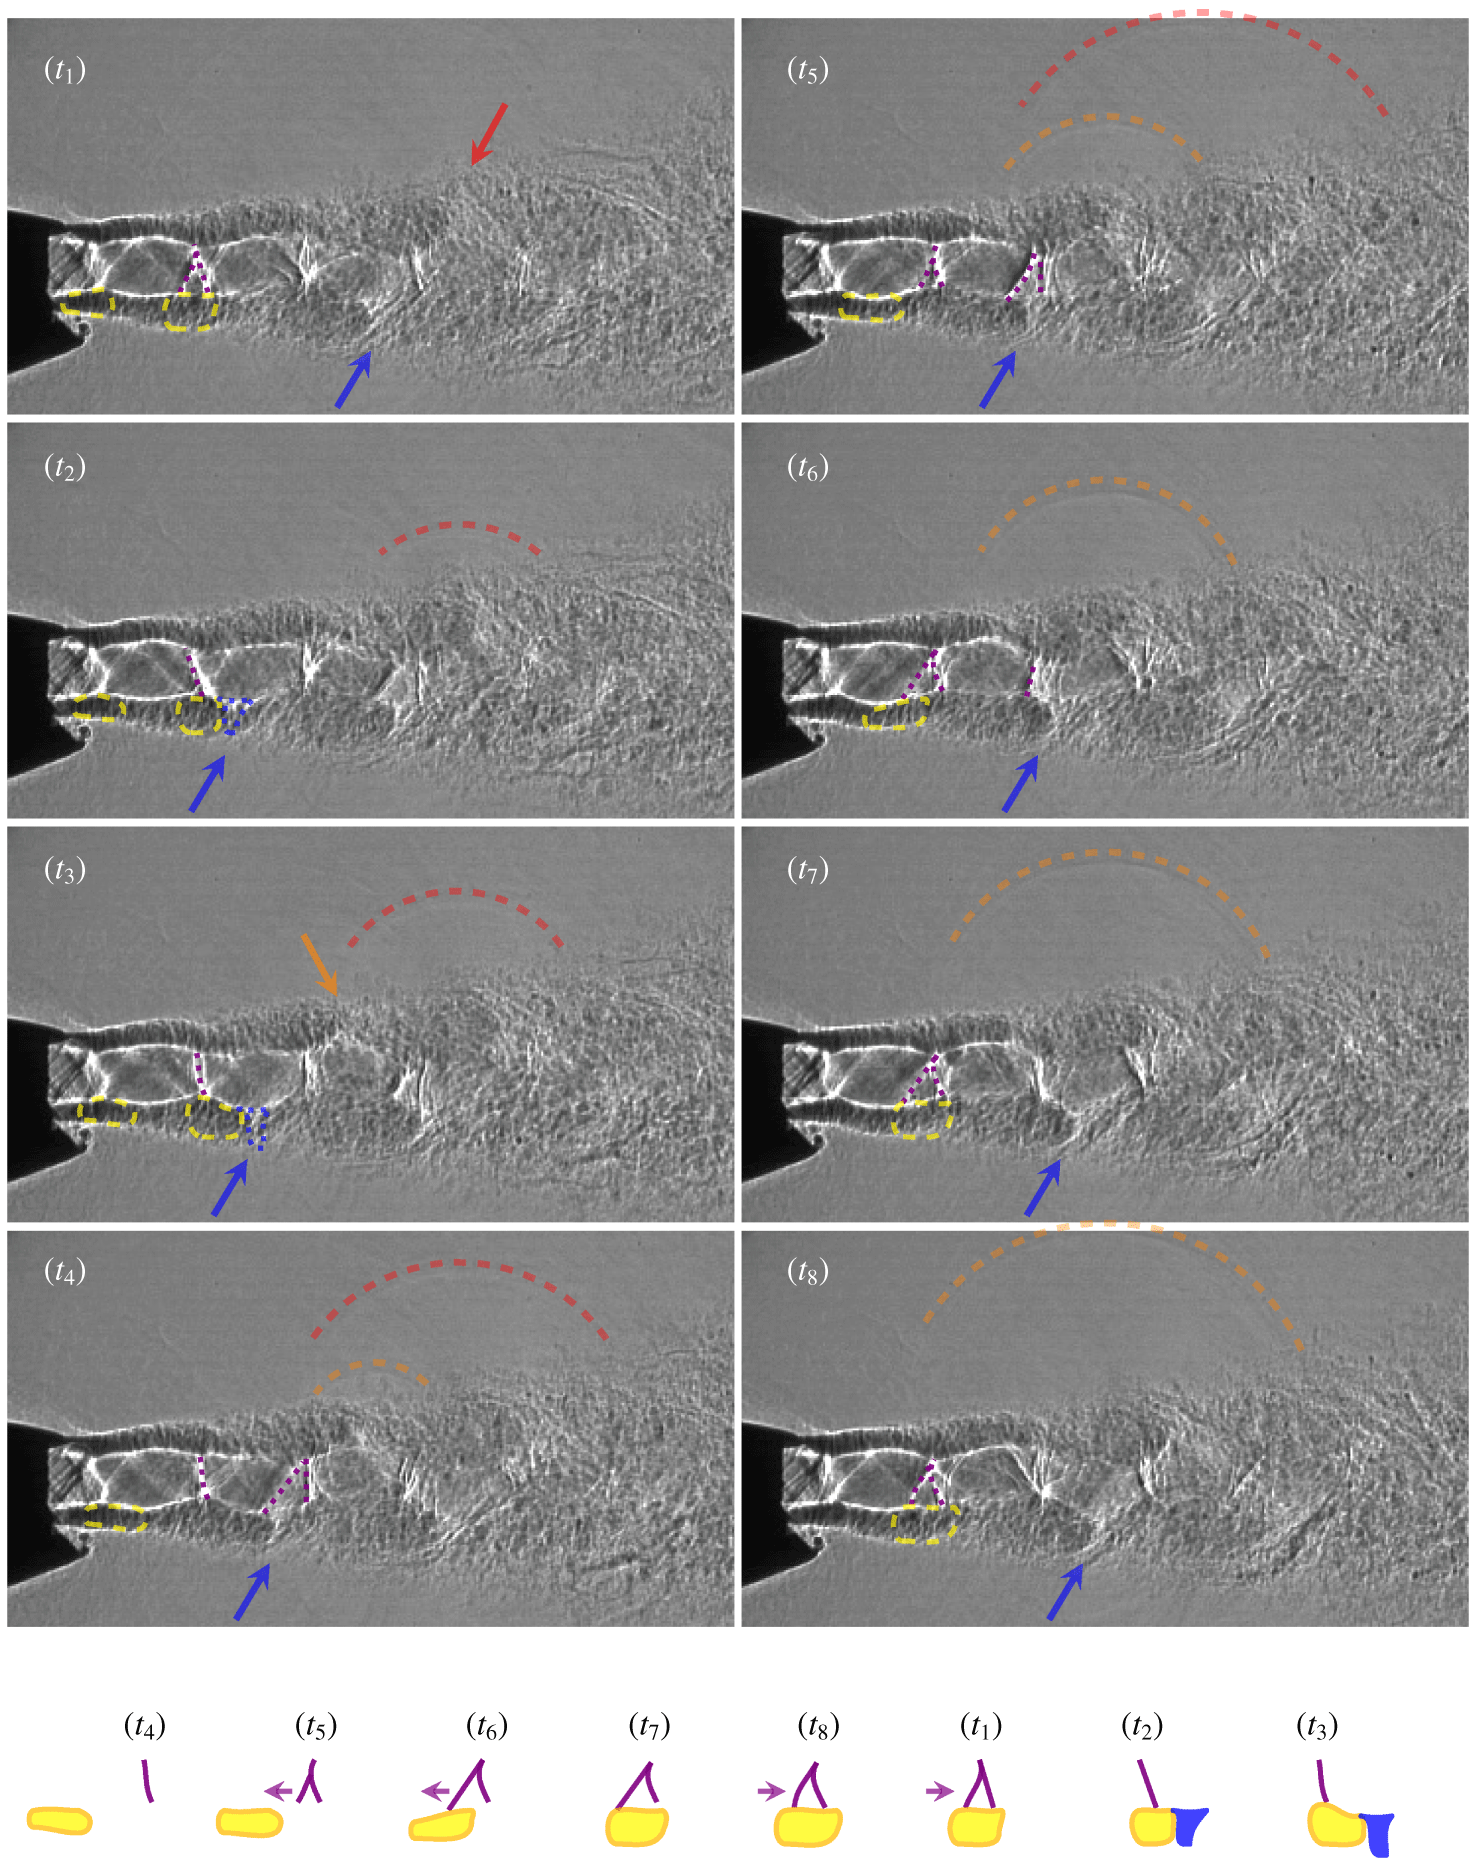
Figure 4. Flow features and shock leaking associated with screech are illustrated by consecutive shadowgraph images for  $p_{0,n}/p_{\infty }=2.75$. The cartoon recapitulates the cyclic interaction of the shock waves (violet lines) terminating the first shock cell and the passing flow structures (yellow shapes), which lead to the formation of sharp white structures (outlined in blue).
The shadowgraph images represent the integration of the second-order density gradient along the entire line of sight, i.e. the major axis. Thus, perturbations with short wavelength along the major axis are not accurately captured due to the integrative nature of the method. Further, the three-dimensional shock features in the exhaust challenge the interpretability. Figure 4 exhibits additional thinner shocks parallel to the general shock pattern, which show because of the shock distortion along the major axis. Therefore, only the quasi-two-dimensional character can be interpreted, when the perturbations with long wavelength along the major axis govern the behaviour of the exhaust.
Figure 4 illustrates that the (quasi-two-dimensional) flapping dominates the character of the jet plume by showing a subset of eight shadowgraph images composing a screech cycle. Distinct flow structures can be identified in the mixing layer which convect downstream. Right downstream of the nozzle, dark shaded shapes depicting density variations in the jet mixing layer can be identified which are outlined in yellow in figure 4 starting at  $t_{1}$. Significant lateral distortion of the mixing-layer thickness can be noted while these dark shapes convect along the mixing layer. When these dark shaded shapes approach the end of the first shock cell by $t_{5}$ in figure 4, the mixing layer is thinnest at the shock location. A new shock is induced upstream of the original shock terminating the shock cell by $t_{5}$ (the shock structure is highlighted in violet in figure 4). The shock formed upstream and the original shock arrange in the form of a $\unicode[STIX]{x1D6EC}$ shape. The shock formed upstream follows the convecting dark shaded structure in a rotating motion, and the two shocks merge or clap by $t_{2}$. The shock recombination occurs cyclically over the eight images corresponding to the screech frequency.
Downstream of this interaction phenomenon between the dark shaded structures and the shock, the convecting structure transforms its appearance into a sharp white shape, which is pointed out by blue arrows starting at  $t_{2}$. In the course of the downstream propagation to the consecutive shock cell end, the formation of another upstream shock wave ( $t_{4}$– $t_{5}$) and a subsequent clapping event ( $t_{6}$– $t_{7}$) can be observed in figure 4. Shock wave clapping events occur for three consecutive shock cells, while the strength of the convecting structures decays rapidly downstream of the fourth shock cell. Due to the asymmetry of the nozzle, the initial clapping events are triggered firstly at different shock cells on either side of the jet plume for the operating condition $p_{0,n}/p_{\infty }=2.75$.
The shocks in the jet plume are displaced laterally to the outer mixing-layer boundaries and follow the distorted (flapping) jet plume in a rotational motion. During this rotation, the shocks can emit or leak high amplitude acoustic waves into the ambient (as described by Berland et al. (Reference Berland, Bogey and Bailly2007)), which can be observed in figure 4 near the third and fourth shock cells. The orange arrow in figure 4 at  $t_{3}$ indicates the location where a convecting structure with a sharp white shape is generated after a shock clapping event. At the following time instant, $t_{4}$, the wavefront of a leakage event can be seen. The dashed semi-circles drawn above the leaked acoustic waves indicate their locations, where the colours red and orange denote their origin from the third and fourth shock cells, respectively. Because the convecting structures pass the shock cells at the screech frequency, individual shocks likely leak at the screech frequency. Figure 4 exhibits that shock leakage occurs (from two consecutive shock cells) at intervals below the screech period.
The statistical importance of these qualitative observations is extracted from the shadowgraph image series by the dynamic mode decomposition methodology. (An animation of the reconstruction using the mean, the screech mode and the first three higher harmonic modes is provided at https://doi.org/10.1017/jfm.2020.233, which exhibits the features described above except the shock leakage phenomenon.) The real components and the magnitudes of the dynamic modes at screech and its harmonics are plotted along lines in the mixing layer in figure 5. It can be observed that coherent sinusoidal perturbations are initiated right downstream of the nozzle exit for screech. For the second and third harmonics, significant coherent mode oscillations emerge only with the end of the first or the second shock cell on the lower and the upper mixing layer, respectively. The initiation location of coherent mode amplitudes for the higher harmonic modes coincide with the location where the shock clapping steepens the convecting structures.
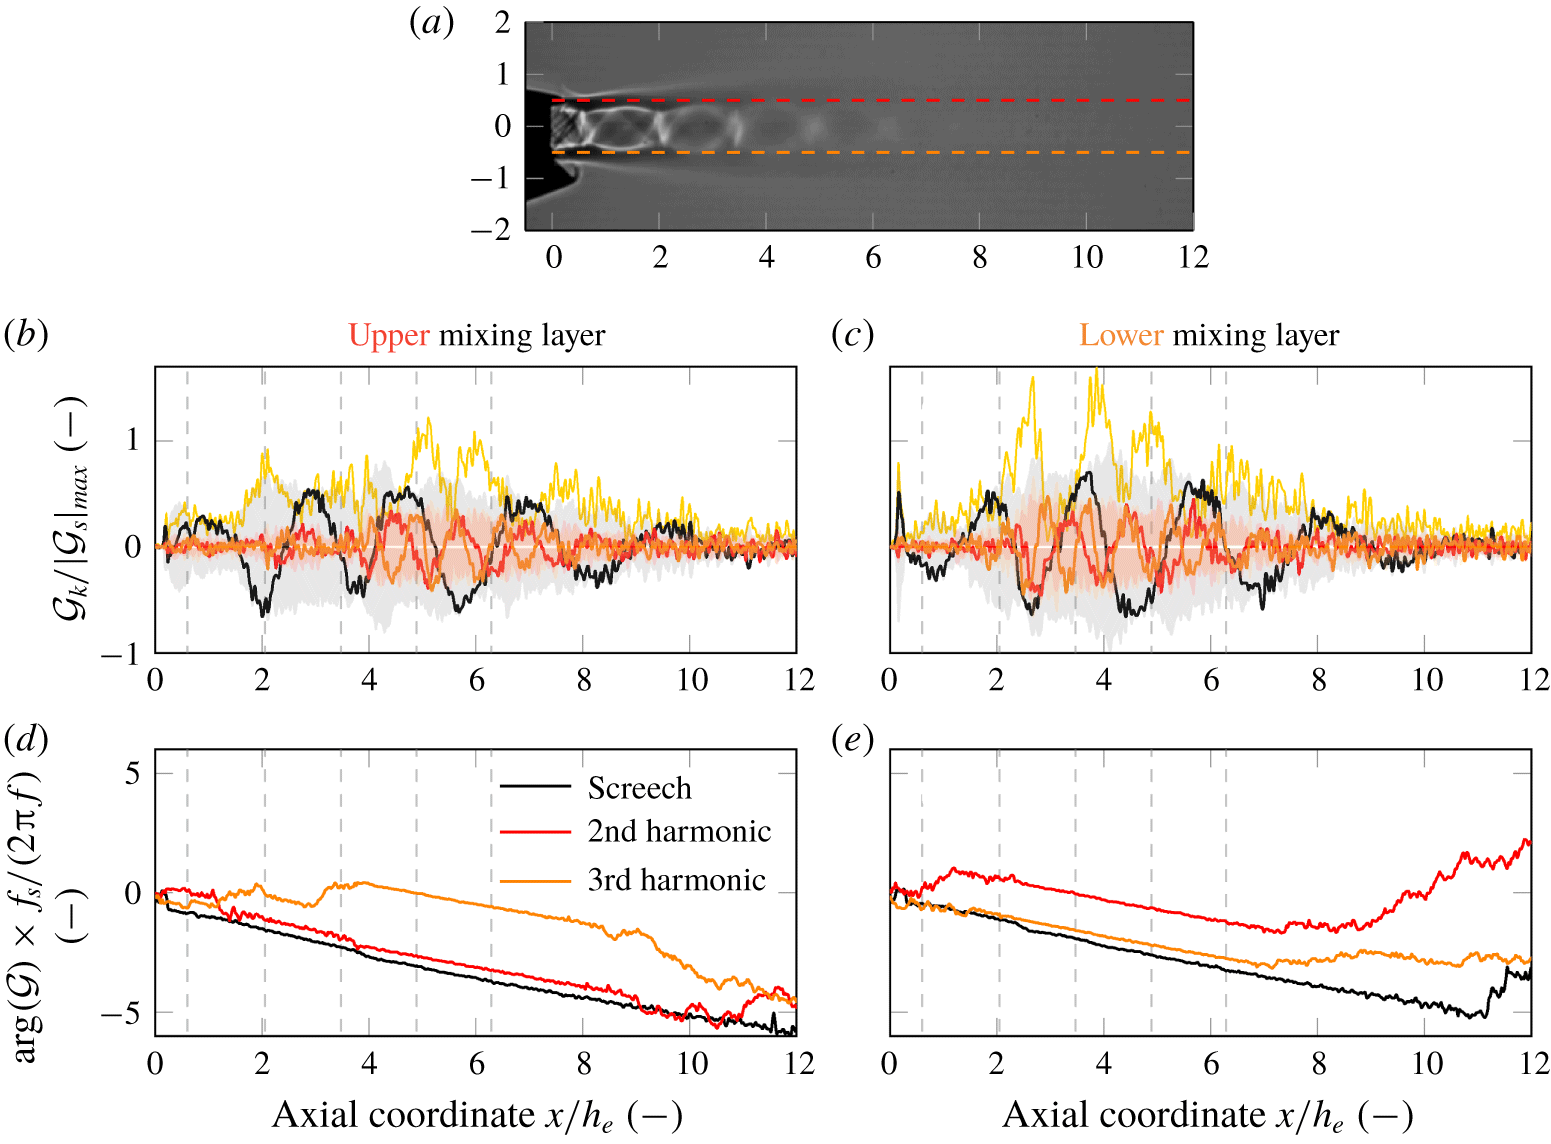
Figure 5. The normalised modal phase angle and amplitudes are shown on two axial lines in the mixing layer (the exact location is shown in the top plot) for  $p_{0,n}/p_{\infty }=2.75$. The normalised modal magnitudes are plotted in (b,c) as shaded areas, and the sum of the normalised mode perturbations corresponding to screech and its first two harmonics over a screech cycle are indicated by yellow lines.
The axial phase angle gradients in the mixing layer (shown in figure 5) indicate that the perturbations at screech ( $u_{c}/u_{j}=0.51$), second harmonic ( $u_{c}/u_{j}=0.53$) and the third harmonic ( $u_{c}/u_{j}=0.51$) convect at the same velocity, where $u_{c}=-(2\unicode[STIX]{x03C0}f/(\text{d}(\arg ({\mathcal{G}}))/\text{d}x))$. (The values agree well with the observations by Raman & Rice (Reference Raman and Rice1994) and Mercier, Castelain & Bailly (Reference Mercier, Castelain and Bailly2017), and similar propagation speeds of the perturbations are observed for all operating conditions.) Thus, the necessary condition for mode resonance between screech and its harmonics is fulfilled, as stated by Raman & Rice (Reference Raman and Rice1994). The screech-cycle-averaged modal perturbations of the screech and its first two harmonics shown in figure 5 reach significantly higher magnitudes than the screech mode alone and thereby prove the occurrence of a modal resonance phenomenon on lines in the mixing layer. Figure 5 shows that the highest accumulated magnitudes occur downstream of the second shock wave clapping event.
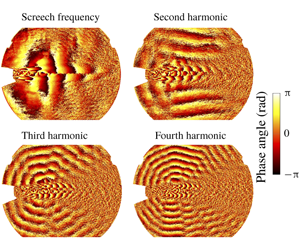
Acoustic waves are correlated density fluctuations. Burak et al. (Reference Burak, Gustafsson, Malla and Gutmark2016) showed that the phase angles calculated from shadowgraph films correlate with the phase angles obtained from acoustic near-field measurements. The phase angles of the dynamic modes, plotted in figure 6, allow the analysis of the spectral acoustic radiation pattern. The wavefront directivity is consistent with the far-field measurements shown in figure 2. A wave pattern (apparently) emitted from a single source can be observed for screech, which can be tracked by following the focal lines of the radiation pattern (indicated by a grey dashed line). The origin can be found slightly downstream of the third to the fourth shock cell, which agrees well with the location for which the extreme magnitudes due to mode superposition have been observed in figure 5. For the second harmonic, an upstream propagating component and lateral radiation of acoustic waves with large wavefronts are visible, which do not emerge from a single point source. The acoustic radiation patterns are distinct for the third and fourth harmonics originating from the locations where the shock waves and the convecting flow structures interact.
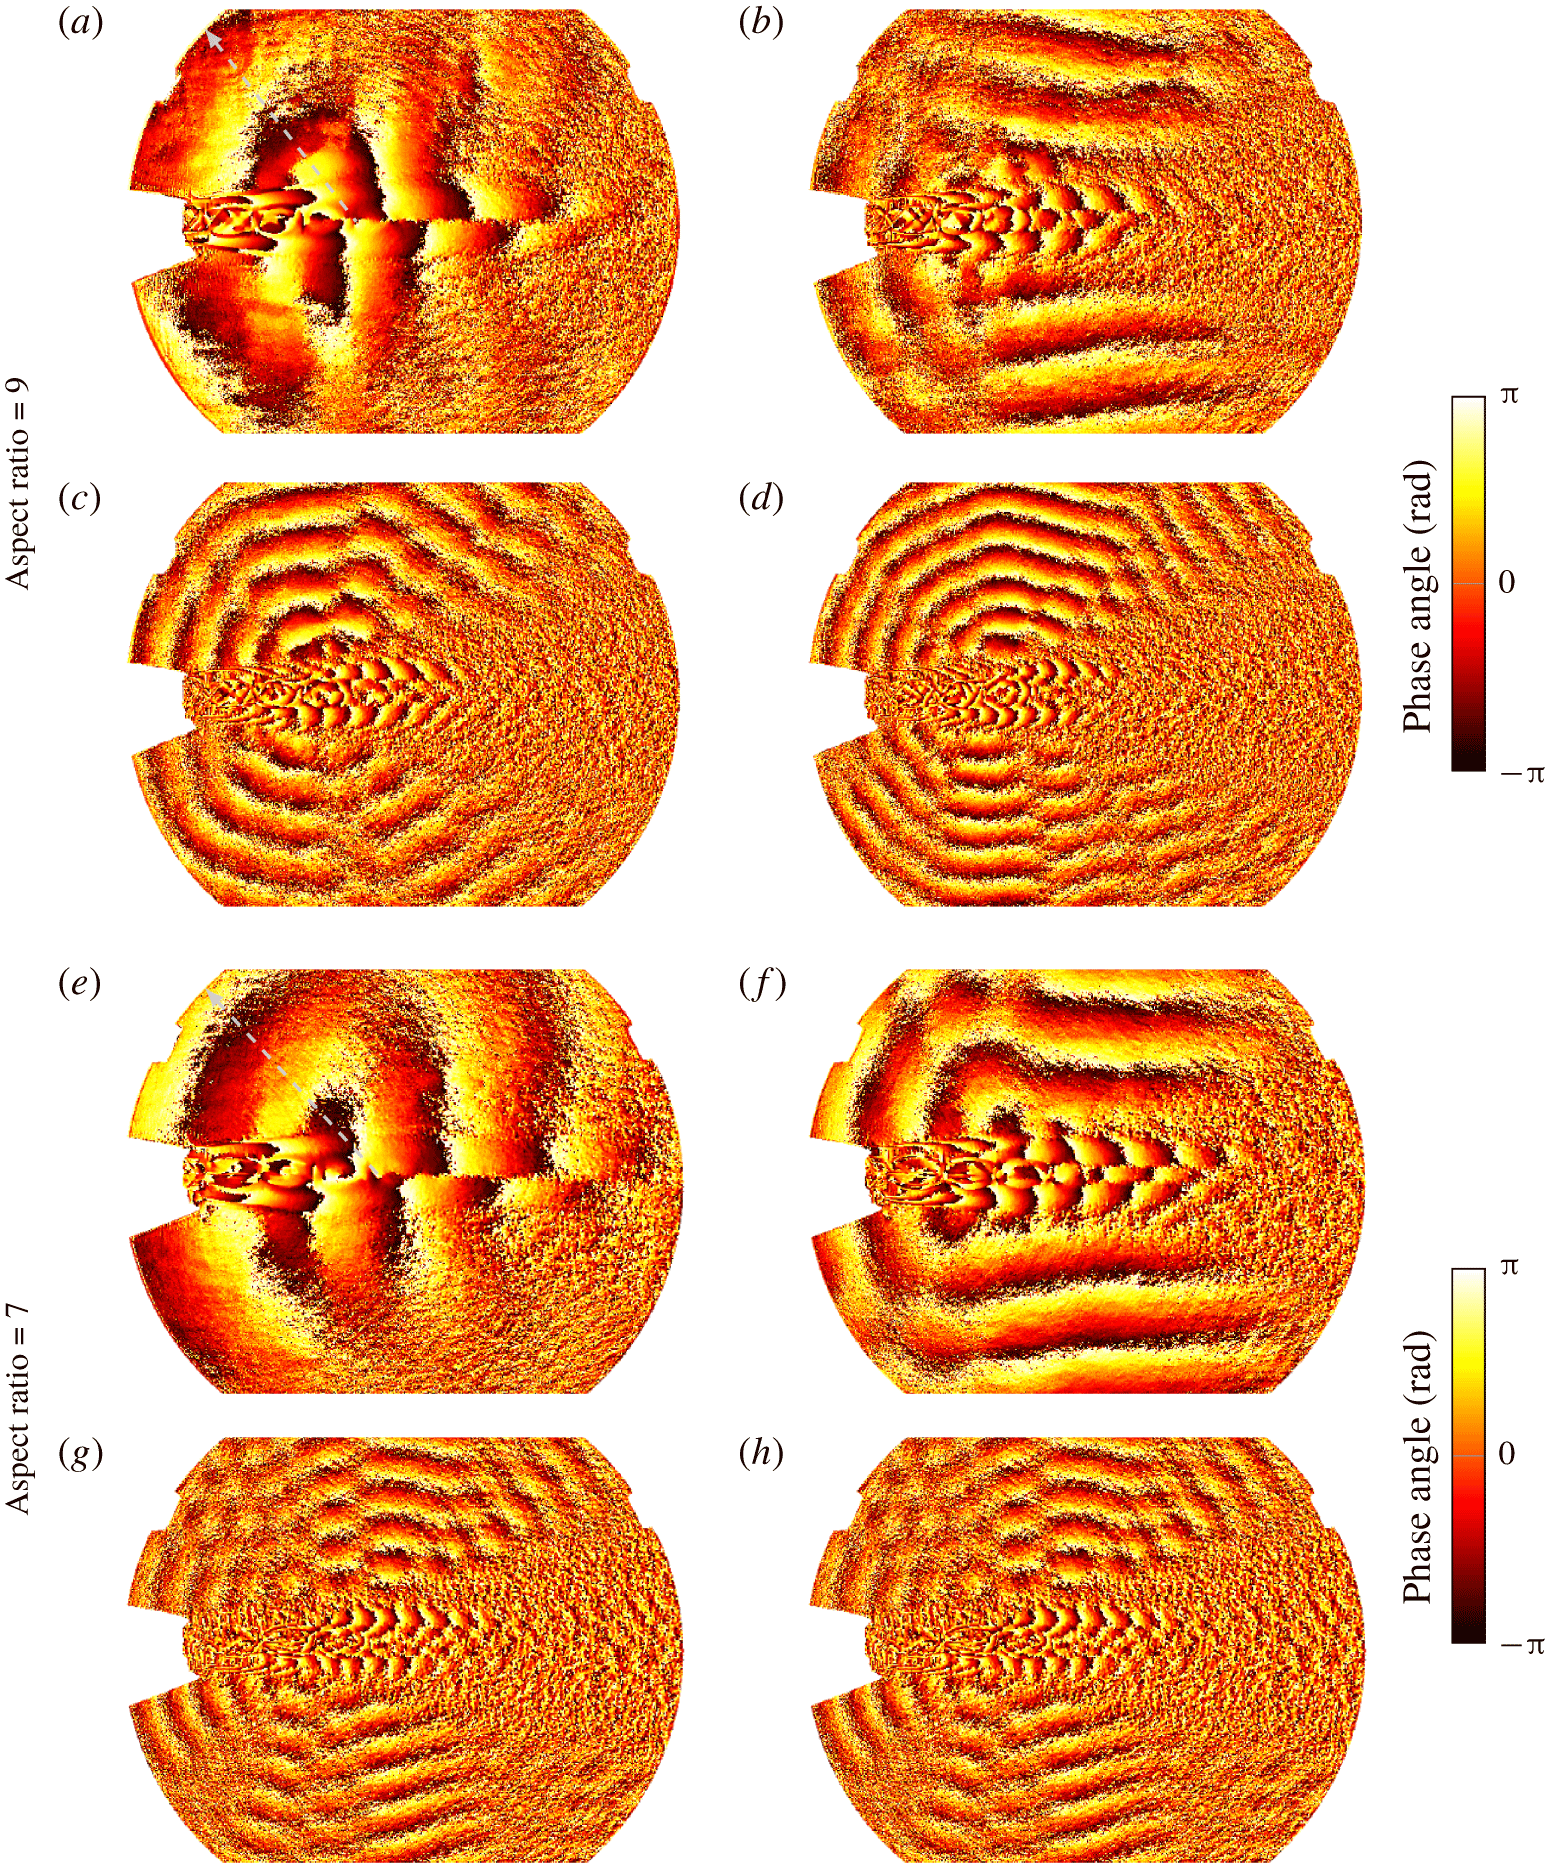
Figure 6. The phase angle of the dynamic modes at the screech frequency (a,e) and the second (b,f), third (c,g) and fourth (d,h) harmonics are shown at  $p_{0,n}/p_{\infty }=2.75$ for the aspect ratios of nine and seven, respectively.
The repeatability of the acoustic radiation pattern is proven in figure 6 for a nozzle with the same geometry and operating condition but an aspect ratio of seven. Significant tonal noise emission cannot be observed from all shock/mixing-layer interactions. The focal lines reveal only the locations at which shock clapping occurs as the origin of the higher harmonic tones. The non-symmetric appearance of shock clapping events at this operating condition due to the non-symmetry of the nozzle provides certainty that it is the essential phenomenon. The distribution of shock clapping events along the shock train depends on the nozzle operating condition.
Figure 6 reveals that the perturbation shapes associated with screech and its third harmonic are asymmetric, whereas the perturbation shapes are symmetric for the second and fourth harmonics (which is consistent with the observations by Raman & Rice (Reference Raman and Rice1994)). Using a vortex sheet model, Tam & Hu (Reference Tam and Hu1989) and Tam & Norum (Reference Tam and Norum1992) derived the dispersion relation for neutral waves, which represent the upstream propagating waves that follow the jet column and close the screech tone feedback loop. Mapping the dispersion relation with the estimated ideal-expanded planar jet density, velocity and Mach number onto the frequency–wavenumber spectrum of the fluctuations contained in the shadowgraph image series (shown in figure 7) explains the observed asymmetric screech mode shape (as noted by Gojon et al. (Reference Gojon, Gutmark and Mihaescu2019)). Due to the nature of the shadowgraph image, representing the integration of second-order density gradients over the entire line of sight, the behaviour of neutral waves is not expected to be entirely captured. However, the frequency–wavenumber spectrum allows for relating the fluctuations with possible propagating modes satisfying the dispersion relation. The fluctuations of propagating modes must fall within the frequency limits of the right solution branch to be neutral waves, which is bound by x-symbols in figure 7. Figure 7 shows that the higher harmonics exceed the validity range of propagating wave solutions to the dispersion relation. Thus, the higher harmonic modes are not resonating as neutral waves with the nozzle according to the dispersion relation derived by Tam & Norum (Reference Tam and Norum1992).
Figure 8 demonstrates that the observed and the reported screech tone frequencies in the literature (i.e. Panda, Raman & Zaman (Reference Panda, Raman and Zaman1997), Alkislar, Krothapalli & Lourenco (Reference Alkislar, Krothapalli and Lourenco2003) and Gojon et al. (Reference Gojon, Gutmark and Mihaescu2019)) follow a well-defined trend, although the nozzle contours and aspect ratios are different. However, the screech frequencies exceed the analytically derived frequency ranges for neutral wave feedback. The simplifying assumptions applied in the two-dimensional vortex sheet model by Tam & Norum (Reference Tam and Norum1992) might compromise the agreement. More reliable prediction of the neutral wave feedback limits is required to rule out that higher harmonics are generally not resonant modes.
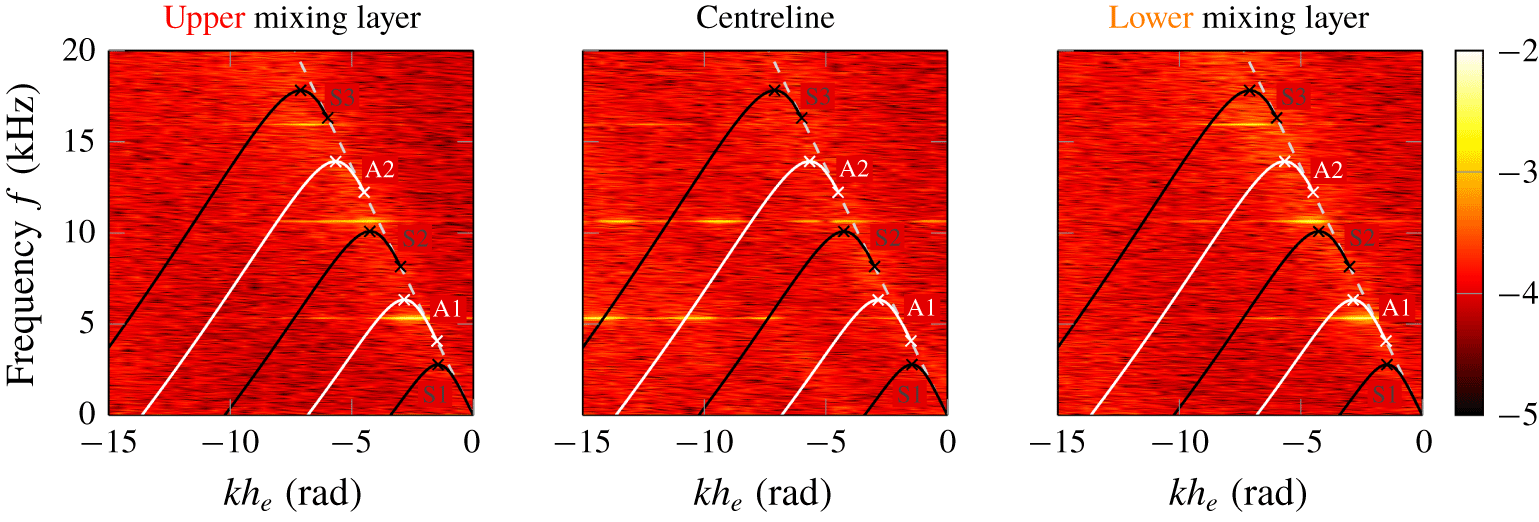
Figure 7. The frequency–wavenumber spectra of the fluctuations on the centreline and lines in the mixing layer are shown for  $p_{0,n}/p_{\infty }=2.75$ (the locations are illustrated in figure 6), where the solutions for neutral waves of the dispersion relation derived by Tam & Norum (Reference Tam and Norum1992) are plotted on top and labelled with an S for symmetric modes and A for asymmetric modes. The wavenumber, $k$, is normalised by the nozzle exit height, $h_{e}$.
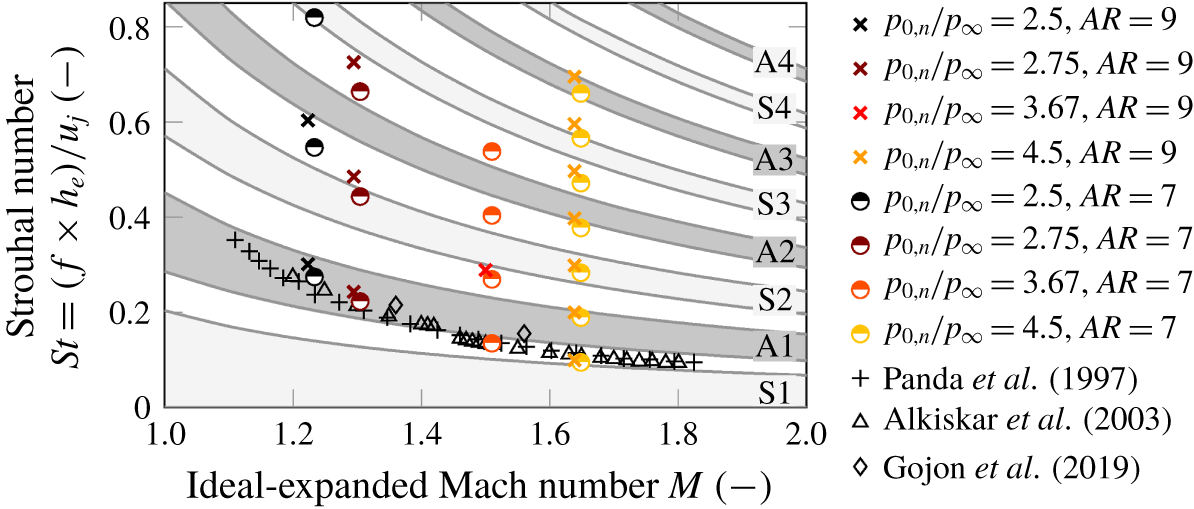
Figure 8. Measured frequencies of screech and its harmonics plotted on top of the permitted frequency bands for neutral waves (as defined by Tam & Norum (Reference Tam and Norum1992)) as function of the ideal-expanded Mach number. The Strouhal number is based on the nozzle exit velocity  $u_{j}$ and height $h_{e}$.
4 Concluding remarks
The generation mechanism of higher harmonic screech tones in supersonic exhausts has been investigated using shadowgraph imaging and acoustic measurements in the far field. Flapping modes dominated the screeching behaviour for all investigated nozzle operating conditions. Higher harmonics of screech have been measured only for large laterally distorted jets, while the change of shock train structure did not influence their occurrence.
Screech-cyclic events of new shock waves forming upstream of the original shock waves and subsequent merging have been observed (similarly to what was described by Suda, Manning & Kaji (Reference Suda, Manning and Kaji1993) and Kaji & Nishijima (Reference Kaji and Nishijima1996)). These so-called shock wave clapping events altered the appearance of the passing flow structures associated with screech. The analysis of the mode evolution in the mixing layer showed that this shape transformation of the perturbation caused the initiation of higher screech harmonics. The dispersion relation for neutral upstream propagating waves derived by Tam & Norum (Reference Tam and Norum1992) showed no solutions for the higher harmonics of screech.
Analysing the modal evolution on axial lines in the mixing layer revealed that the flow structure associated screech and its harmonics convect at the same velocity, which enables mode resonance. The superposition of the screech mode with its higher harmonic modes lead to extreme amplitudes at the origin of the screech tones, and thus mode resonance takes place. The acoustic radiation pattern of screech and its higher harmonics has been extracted from the shadowgraph image series and presented by illustrating the phase angle. The focal lines indicated the origin location of the fundamental screech tones in the exhaust, which coincides with the mode resonance location.
The investigated single expansion ramp nozzle with high aspect ratio is not symmetric in the minor plane and features the non-symmetric appearance of flow phenomena. For the presented operating conditions, shocks leaking through the mixing layer into the ambient have been observed primarily on the side where the nozzle contour is flat and only if harmonics of screech are measured in the far field. Noteworthy is that the shock leakage succeeded immediately shock clapping events originating from the same location. However, the field reconstruction using the dynamic modes of the mean, the screech and its first three harmonics did not feature shock-leaking events. For a particular operating condition, i.e.  $p_{0,n}/p_{\infty }=2.75$, the most upstream appearance of shock wave clapping occurred at the end of the first shock cell on the convergent–divergent contoured side of the nozzle. In contrast, the most upstream shock wave clapping event on the opposite mixing layer occurred one shock cell further downstream. The acoustic radiation pattern extracted from the shadowgraph image series exposed the origin of the higher harmonic tones. The focal lines of the acoustic waves expose the non-symmetrically arranged shock clapping events as sources, whereas tonal emission cannot be traced back to shocks interactions without clapping events.
Declaration of interests
The authors report no conflict of interest.
Supplementary movie
Supplementary movie is available at https://doi.org/10.1017/jfm.2020.233.


 Open access