


Implications
Responsible artificial insemination (AI) organizations strive to ensure that semen sold has the potential to achieve acceptable levels of fertility when used in herds of fertile, adequately-managed cows and heifers. Accordingly, many AI studs implement extensive quality control programs to increase the likelihood of selling highly fertile products. Successful quality control programs use data obtained from a variety of semen bioassays, as well as fertility data, to make data-driven, objective decisions regarding semen processing and sales. The future of semen quality control will be driven by advances in the technology used to analyze semen and our ability to correlate these tests to fertility.
Introduction
The goal of a quality control program is to ensure that a manufactured product adheres to a defined set of quality criteria. These criteria must meet the requirements of a client or customer. Quality control is not the same as quality assurance. Quality assurance programs focus on providing confidence that the aforementioned quality control standards are being met. Artificial insemination organizations have the duty of providing their customers with semen that is of high genetic value, that has been hygienically processed after collection from bulls of known bio-secure health status, and that has passed minimum post-thaw standards of sperm quality that will ensure normal fertility potential when used in well managed herds.
Advancements in semen evaluation techniques have steadily become more technological and robust in their ability to examine varying aspects of sperm cell biology. The incorporation of computer-assisted sperm analysis (CASA) and various assays using fluorescent staining and high sample throughput, such as flow cytometry, have drastically increased our understanding of sperm populations in an ejaculate. Despite having increased our understanding of sperm physiology, correlating in vitro sperm attributes to in vivo fertility can be problematic, and no single in vitro assessment can reliably and consistently predict fertility (Sellem et al., Reference Sellem, Broekhuijse, Chevrier, Caugli, Schmitt, Schilber and Koenen2015; Holden et al., Reference Holden, Fernandez-Fuertes, Murphy, Whelan, O’Gorman, Brennan, Butler, Loergan and Fair2017; Yániz et al., Reference Yániz, Soler, Alquezar-Baeta and Santolaria2017). An important aspect of improving correlative power of in vitro sperm bioassays to field fertility has involved the utilization of statistical modeling and the use of large fertility data sets (Utt, Reference Utt2016). Large AI organizations that regularly process several dozen, if not hundreds, of bull ejaculates per day are poised to have a unique opportunity to collect data from in vitro sperm analyses and fertility data to generate and establish meaningful correlations between the two.
The purpose of a quality control program at a large AI organization is unique in that it must integrate both sperm biology and product sale decisions. A successful program will seek not only to learn about and incorporate the latest advancements in in vitro sperm bioassays, but also to understand the biological significance of the data generated with regards to semen fertility. Lastly and perhaps most importantly, a quality control program must determine how each sperm parameter examined will identify samples to either be discarded or sold. The ever-evolving field of sperm cell biology means that AI organizations must regularly choose and interpret which sperm characteristics are the most impactful to sire fertility. This overview of AI organization semen quality programs seeks to connect the use of sperm in vitro bioassays, the reporting of AI sire fertility, and the management decisions surrounding the implementation of a semen quality control program.
Factors impacting sire fertility
Advancements in biotechnology have greatly increased our ability to examine varying facets of sperm cell biology. Even though the technology is continually changing, a common theme has been to identify characteristics within sperm populations that correlate to actual field fertility. As the ‘toolbox’ of methods continues to increase, certain methods have established themselves as mainstays of analyzing sperm. Such examinations sort into several categories, being those which examine the functionality of sperm (motility or fertilization ability) and those that examine endogenous attributes of sperm such as DNA packaging or surface membrane proteins. A brief overview of well-established and most popular sperm characteristic bioassays will be provided here with a focus on those that can be applied in a commercial setting. In-depth discussions of how these predictors correlate to sire fertility have been examined recently by several others (Sellem et al., Reference Sellem, Broekhuijse, Chevrier, Caugli, Schmitt, Schilber and Koenen2015; Holden et al., Reference Holden, Fernandez-Fuertes, Murphy, Whelan, O’Gorman, Brennan, Butler, Loergan and Fair2017; Yániz et al., Reference Yániz, Soler, Alquezar-Baeta and Santolaria2017).
Motility and morphological assessments
Microscope-assisted visual assessment of sperm motility and morphology are probably the most common tests performed on fresh semen and semen at varying stages post-processing and freezing. Decades of research and observation of sire fertility have demonstrated quantitative associations between ejaculate motility and morphology and field fertility. Essentially anyone with an adequate microscope (phase contrast) can quantify these sperm characteristics without the need for more advanced and expensive equipment.
Reports correlating the frequency of morphological defects in sperm and fertility of the sample from more recent years generally agree with the early studies (Saacke, Reference Saacke1970; Al-Makhzoomi et al., Reference Al-Makhzoomi, Lundeheim, Haard and Rodriguez-Martinez2008). The concept of compensable v. uncompensable traits of semen is crucial when discussing morphology and motility (Saacke, Reference Saacke2008). Morphological defects appear to be associated with uncompensable components of semen quality, meaning that observed fertility cannot be overcome or compensated for by increasing the number of sperm in the insemination dose. In essence, increasing insemination dose does not change the ratio of compensable to uncompensable defects within the sample and thereby would not impact the percentage of oocytes that may be fertilized by a sperm incapable of sustaining embryonic development.
Decades of research has classified the methodologies of visually examining sperm motility and its correlation to fertility (Saacke and White, Reference Saacke and White1972; Saacke et al., Reference Saacke, Vinson, O’Conner, Chandler, Mullins and Amann1980; Berndtson et al., Reference Berndtson, Olar and Pickett1981). However, the use of CASA is becoming a gold standard in semen evaluation due to the removal of subjectivity of the evaluator, the consistency of results, and the diminished need to train personnel with the goal of increasing repeatability of visual motility estimation. Granted, the repeatability of results using CASA is highly dependent upon the preparation of the sample and whether fixed-depth chambered slides are used that are designed to standardize the viewing of samples within a certain range of volume and concentration. The objectivity of CASA is preferable to visual subjective motility for use in a large AI organization where multiple technicians may be analyzing dozens (if not hundreds) of samples daily. In these cases, distinguishing sample variation from technician variation or technician fatigue becomes problematic. Correlations between CASA percent total and percent progressively motile sperm to in vivo heterospermic competitive indices have been reported (Budworth et al., Reference Budworth, Amann and Chapman1988; Kasimanickam et al., Reference Kasimanickam, Nebel, Peeler, Silvia, Wolf, McAllister and Cassell2006).
The implementation of CASA into a quality control program of a commercial AI stud is logical due to its objective determination of motility characteristics. However, expense and correlations between CASA measurements and other quality control assessments such as visual motility and various flow cytometric assays should be considered before CASA replaces tests that are already implemented and proven. Although CASA analyses can produce a wealth of data to more precisely define attributes and characteristic of sperm motion such as speed, linearity and head displacement, controlled studies have yet to conclusively document that these attributes will add value to the quality control decision process over and above what is provided by total motility and (or) progressive motility. However, such attributes certainly remain worthy of consideration for future research efforts. Minimum standards from CASA endpoints can ideally be used as selection criteria, meaning that CASA implementation is simply adding another selection tool to ensure sub-fertile semen is not released to the field. In a production setting, correlations do exist between CASA and other quality control measures such as viability determined using flow cytometry. Figure 1 displays the degree of correlation (R 2=0.51) between CASA motility and sperm viability as determined by plasma membrane integrity using flow cytometry (propidium iodide) for 7137 samples across 724 sires (Select Sires, unpublished data). Artificial insemination companies regularly use visual motility estimates and (or) CASA to make data-driven decisions on whether or not to sell a particular collection of a sire.

Figure 1 (colour online) Comparison of computer-assisted sperm analysis (CASA) total motility and flow cytometric analysis of sperm viability in a semen quality control program. Separate straws from each freeze batch (n=7138 across 724 different sires) were subject to either CASA (IVOS II; Hamilton Thorne, Beverly, MA, USA) or flow cytometric analysis of sperm viability (propidium iodide/Hoechst 33342) using a MACSQuant Analyzer 10 (Miltenyi Biotec, Cologne, Germany).
Flow cytometric analyses
Flow cytometric evaluations have deepened our knowledge of endogenous sperm traits such as sperm plasma membrane integrity, acrosome integrity, DNA structure and surface protein diversity and prevalence (sperm proteome). Before flow cytometry, one of the original tests to assess plasma membrane integrity was the hypoosmotic swelling test (HOST). This test determines a sperm cell’s ability to uptake and hold water within its cytoplasm, indicating a viable cell with an intact membrane (Jeyendran et al., Reference Jeyendran, Vander-Ven, Perez-Pelaez, Crabo and Zanevld1984; Ahmadi and Soon-Chye, Reference Ahmadi and Soon-Chye1992). Results from the submission of bovine semen to the HOST have been correlated to non-return rates (NRR) (Bacinoglu et al., Reference Bacinoglu, Tas, Cirit, Ozdas and Ak2008) and in vitro fertilization (Tartaglione and Ritta, Reference Tartaglione and Ritta2004). Flow cytometric determination of plasma membrane integrity generally relies on fluorescent staining of DNA. A compromised plasmalemma allows stain to penetrate and integrate into the DNA, and fluorescence indicates that the membrane is not intact and that the cell is likely not viable. Flow cytometric membrane integrity correlates positively to visually-determined membrane integrity using the same staining protocols (Graham et al., Reference Graham, Kunze and Hammerstedt1990) and correlates to heterospermic fertility ranking (Kasimanickam et al., Reference Kasimanickam, Nebel, Peeler, Silvia, Wolf, McAllister and Cassell2006). An important validation component of these techniques are alternative stains like SYBR or Hoechst 33342 to ensure the measured fluorescence is truly coming from sperm cells and not from non-specific staining of extender particles or debris.
The relationship of acrosome intactness to fertility potential has been documented. An intact acrosome is necessary to facilitate the acrosome reaction at the correct time to allow for fertilization to occur (Oura and Toshimori, Reference Oura and Toshimori1990). Before the use of flow cytometry, it was established that acrosome intactness of post-thaw semen was correlated to NRR and heterospermic ranking (Saacke and White, Reference Saacke and White1972; Saacke et al., Reference Saacke, Vinson, O’Conner, Chandler, Mullins and Amann1980). These reports were further verified by others when acrosome intactness was assessed using fluorescent stains and flow cytometric analyses (Graham, Reference Graham2001; Purdy and Graham, Reference Purdy and Graham2004).
Research has now begun combining sperm flow cytometric assessment with subsequent proteomic evaluations. Several groups have not only classified sperm surface proteins and seminal plasma proteins, but also characterized their relationship to fertility and cell viability determined using flow cytometry. For example, D’Amours et al. (Reference D’Amours, Frenette, Fortier, Leclerc and Sullivan2010) determined in a proteomic analysis that the proteins T-complex protein 1 subunit epsilon and adenylate kinase isoenzyme 1 explained 64% of the fertility score classification of sires ranked by the Canadian Dairy Network. The group also reported that proteasome subunit α type-6 and binder of sperm 1 (BSP1) is more highly expressed in sperm of low fertility than high fertility bulls, and that abundance of BSP1 and proteasome subunit α type 6 are negatively correlated to the percentage of viable (propidium iodide-negative) sperm as determined using flow cytometry.
Ubiquitination of sperm has also been extensively linked to sperm quality. Sperm are ubiquitinated in the epididymis as a marker for proteolytic destruction. Therefore, ubiquitination is generally associated with poor sperm quality. It has been reported that the degree of ubiquitination is positively correlated to the frequency of morphological defects in the sample (Odhiambo et al., Reference Odhiambo, Sutovsky, DeJarnette, Marshall and Sutovsky2011). In addition, ubiquitination is positively correlated to terminal deoxynucleotidyl transferase-mediated dUTP nick-end labeling (TUNEL) assay-positive cells, which is a sign of compromised DNA integrity and cell apoptosis (Sutovsky et al., Reference Sutovsky, Neuber and Schatten2002).
The status of sperm DNA integrity logically correlates to the spermatozoa’s ability to fertilize and progress through embryonic development because a complete, stable package of DNA must be delivered to the oocyte. The relationship between sperm DNA integrity and fertility of bulls has most notably been studied by Evenson, who developed the Sperm Chromatin Structure Assay (SCSA) test, which is a flow cytometric assessment that determines the percentage of double-stranded v. single-stranded DNA in a sperm population following a thermal- or pH-induced stress on the nucleus. Initial reports correlated DNA fragmentation to subfertility in both men and bulls (Evenson et al., Reference Evenson, Darzynkiewicz and Melamed1980a and Reference Evenson, Darzynkiewicz and Melamed1980b), and the history and use of this assay in research and industry was recently reviewed (Evenson, Reference Evenson2016). A similar test, the TUNEL assay, identifies DNA strand breaks by labeling double-strand breaks with fluorescent probes at certain exposed nucleotides (Gorezyeca et al., Reference Gorezyeca, Traganos, Jesionowska and Darzynkiewicz1993). Although similar, the TUNEL assay requires many assay steps to label the double-strand breaks and is a single-parameter test which will not yield as reliable data as the SCSA test (Evenson, Reference Evenson2016). Several subsequent studies have correlated a high TUNEL index (high prevalence of denatured DNA) with poor fertility in bulls (Anzar et al., Reference Anzar, He, Buhr, Kroetsch and Pauls2002; Takeda et al., Reference Takeda, Uchiyama, Kinukawa, Tagami, Kaneda and Watanabe2015).
The advent of multiparametric flow cytometry will continue to increase our power of sperm attribute detection and has been recently reviewed by Ortega-Ferrusola et al. (Reference Ortega-Ferrusola, Gil, Rodriguez-Martinez, Anel, Pena and Martin-Munoz2017). In an AI production setting, multi-laser flow cytometry that allows for simultaneous multiparametric detection of varying sperm attributes may greatly improve the efficiency of quality control. Furthermore, multiparametric flow cytometry may allow for in-depth quantification and examination of sperm subpopulations, and the associations of these subpopulations to fertility will be the subject of ongoing research.
Observed variation in laboratory quality control parameters
Semen quality evaluations are first and foremost used to make decisions regarding the fertility potential of batches of frozen semen and ultimately of the sire. Any laboratory evaluation produces an estimate of a certain trait that we assume to be representative of the sample. Accuracy and precision of the estimate affect the quality and utility of that estimate. Achieving consistent, accurate and representative results is a balancing act between accuracy and precision. Accuracy refers to how close the laboratory test comes to the actual value or gold standard. Precision refers to the consistency of a test’s results when analyzing the same sample over and over using the same procedures.
Precision and accuracy of motility estimates by laboratory technicians is extremely important to monitor in an AI center. We use a system of short video clips for assessment by individual technicians followed by a group review and discussion of results. Video clips allow for the elimination of field-to-field or sample-to-sample variation so technicians can focus directly on the honing of skills, abilities, accuracy and precision of estimates. Anonymous insertion of duplicate copies of the same video clip allow for a direct measure of technician precision. Accuracy of estimates are still subjective but can be more closely estimated with repeated assessment and ‘counting’ of sperm in each clip if necessary.
Drift of non-motile sperm when using CASA creates artificial sperm movement and can inflate the number of total motile sperm influencing both accuracy and precision. Improper incubation time of certain fluorescent probes may create under- or over-staining, resulting in the artificial grouping of sperm into a subpopulation to which they should not belong during flow cytometric analysis or fluorescent microscopy. Any evaluation procedure that has repeated steps warrants an examination of how consistently those steps actually occur. Also, having the appropriate gold standard to compare with is also crucial. This is not to be confused with the diagnostic accuracy of an evaluation, which will be discussed later. Accuracy and precision are important, and in many cases, can be improved or controlled by adjustment to laboratory procedures.
Understanding sample hierarchy can provide a greater understanding of where reductions in precision can occur. The sample hierarchy for AI studs would generally be sire, ejaculate, straw and then sample of a straw. Conducting 10 measurements using a single sample of a straw of semen would likely result in more precise results compared with taking the same measurement once in each of 10 different straws. Figure 2 depicts variation in percent viable sperm determined using flow cytometry (propidium iodide as the viability stain, 5000 cells from one straw per analysis) within and among three arbitrarily named sires during the year 2016. Each data point represents a single evaluation from a single batch of semen frozen on a given day. Note that the sire named Matt has an overall greater viability than Mel. Although the sire named Bo has similar yearly average sperm viability as Matt, it is easy to observe the negative seasonal effects on viability Bo experienced during certain months (July through October). When looking at the overall variability across the year for these sires, one could conclude that the number of viable sperm vary greatly from freeze to freeze, which may be correct to a certain degree. Is this a consequence of biological variation from the bull or problems related to precision and repeatability of the assay? The precision of a laboratory assay is controlled by the sampling and the procedure itself. Are straws analyzed on a respective day representative of the entire batch? We assume in the examples presented here that all samples were prepared as similarly as possible with regards to homogenization via mixing, fluorescent staining protocol and technician technique. However, differences in sample preparation inevitably contribute to a lack of repeatability. Variation from straw to straw can reduce both the precision and accuracy of the evaluation. Procedural variation in assays is also a potential source of imprecision. This example and the following example are presented in an attempt to showcase the variability observed between lab assays over periods of time.
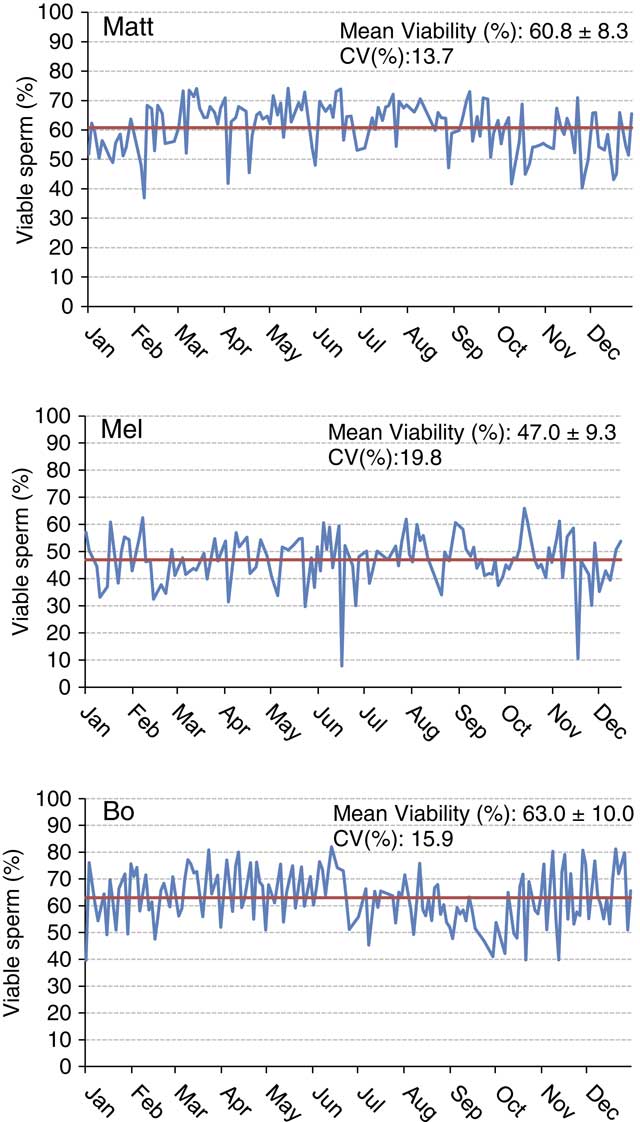
Figure 2 (colour online) Sperm cell viability plotted over a 1-year period for three Holstein sires. The yearly mean is shown by the solid bar. Viability is indicative of an intact plasma membrane as determined using propidium iodide staining and examination of 5000 cells/sample using a MACSQuant Analyzer 10 flow cytometer (Miltenyi Biotech, Cologne, Germany).
Figure 3 presents the result of a trial (Select Sires, unpublished) designed to assess both the precision of flow cytometric assessments of sperm viability within and across evaluation days and to estimate straw-to-straw variation in semen quality. Ten random collections (combined two ejaculates) of semen were selected and evaluated on 3 separate days. On each evaluation day, five individual straws from a collection were thawed, and each straw was evaluated in triplicate. Triplicate evaluations of the same straw on the same day yielded the intra-straw variation, which is the estimate of repeatability of the assay itself. Evaluation of five individual straws from the same collection on the same evaluation day yielded an estimate of inter-straw variation in addition to the assay variation. Comparison of individual assay days within a given collection yielded estimates of inter-straw variation, assay variation and procedural variation or drift across days. The mean intra-straw CV was only 2.9%, indicating the high repeatability and precision of this assay. The mean inter-straw CV was 10.5%. Finally, the CV within freeze batch across all straws and evaluation days was 12.7%. Variation clearly increases as inferences pertaining to precision move from repeated subsamples (intra-straw), between straws within a collection (inter-straw) and ultimately between days. Collectively these results confirm utility and sensitivity of the assay to detect differences in sperm viability as the total CV of assay within and across samples and days was estimated at 5.1%. Examples exist in this data set of extremely high repeatability with minimal straw-to-straw or day-to-day variation (Collections C and D). In other cases, minimal straw-to-straw variation exists on certain days but perhaps not on others (Collections F, I and J). It is impossible to conclude whether this increased variation on certain days was inherent to the collection and only detected on certain days, or perhaps the sample is more consistent and the variation was only induced on certain days as function of inappropriate semen handling procedures, sampling procedures, etc. However, even in those cases where straw-to-straw variation appears to exist, the variation was seldom of sufficient magnitude to influence the quality control decision to keep or not keep the collection in question.

Figure 3 Sperm viability of 10 random collections (combined two ejaculates; A to J) of semen from different bulls evaluated by flow cytometry on three separate days (1 to 3) with five straws thawed and evaluated in triplicate on each evaluation day. Each data point represents the mean of three replicates of a single straw. Vertical dashed lines serve as visual aids to distinguish between samples. Viability was defined as absence of propidium iodide staining after 15 min of incubation and examination of 5000 cells/sample using a Cell Lab Quanta flow cytometer (Beckman Coulter, Indianapolis, IN, USA).
Sperm numbers per dose
The concepts of compensable v. uncompensable traits were previously described, and it has been well established that the effect of the number of sperm inseminated on fertility may vary between bulls. Figures 4 and 5 depict the results of a sperm dose trial that utilized ten Holstein bulls (Select Sires, unpublished). For this experiment, ejaculates from ten Holstein bulls were separately processed and packaged into units containing five different doses (1.5, 3, 6, 12 or 24 million sperm/straw). Each of the dosages for each sire was equally distributed and used to inseminate Holstein cows in a controlled experiment where AI technicians were blind to insemination dose. For each dosage within each sire, 309±8.7 inseminations (range 209 to 378) were recovered as usable records for analysis. Data were analyzed using a statistical model that included dose as a fixed effect and the random variables of sire, sire by dose interaction, herd and parity and service number nested within herd. The mean conception rates (CRs) for each dose are depicted in Figure 4. When the data are graphed for individual sires and examined qualitatively, sires such as sire D (Figure 5a) exhibited comparable CRs in all sperm dosages ranging from 1.5 to 24 million sperm/straw. Sire J (Figure 5b) displays a measurable decline in CR in response to decreased sperm dosage, suggesting his sperm have a higher prevalence of compensable sperm defects than other sires in this study. The remaining eight sires display varying declines in conception potential in response to declining dosages.
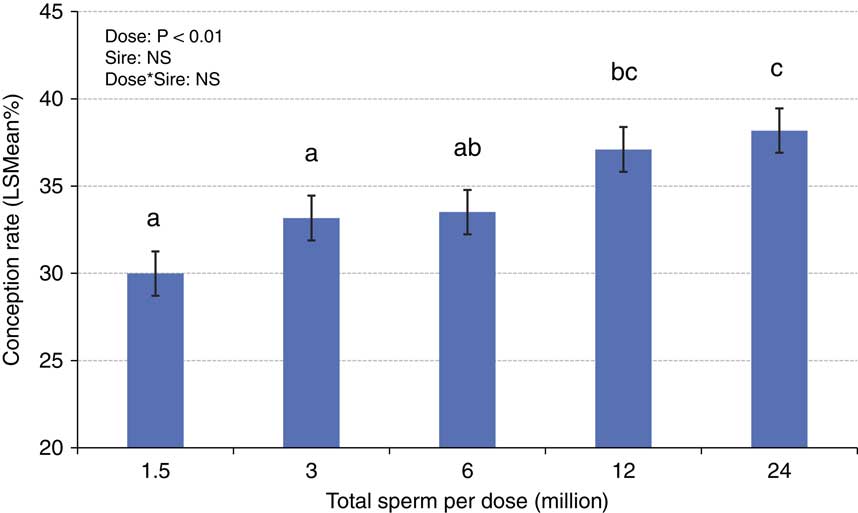
Figure 4 (colour online) Mean (±SE) conception rates ejaculates from ten Holstein bulls that were separately processed and packaged into units containing five different doses (1.5, 3, 6, 12 or 24 million sperm/straw). Each of the dosages for each sire was used to inseminate Holstein cows in a controlled experiment where AI technicians were blind to insemination dose. An average of 309±8.7 inseminations were recovered as usable records for analysis from each dose of each sire.
a,b,cValues not sharing superscript letters differ, P<0.05.
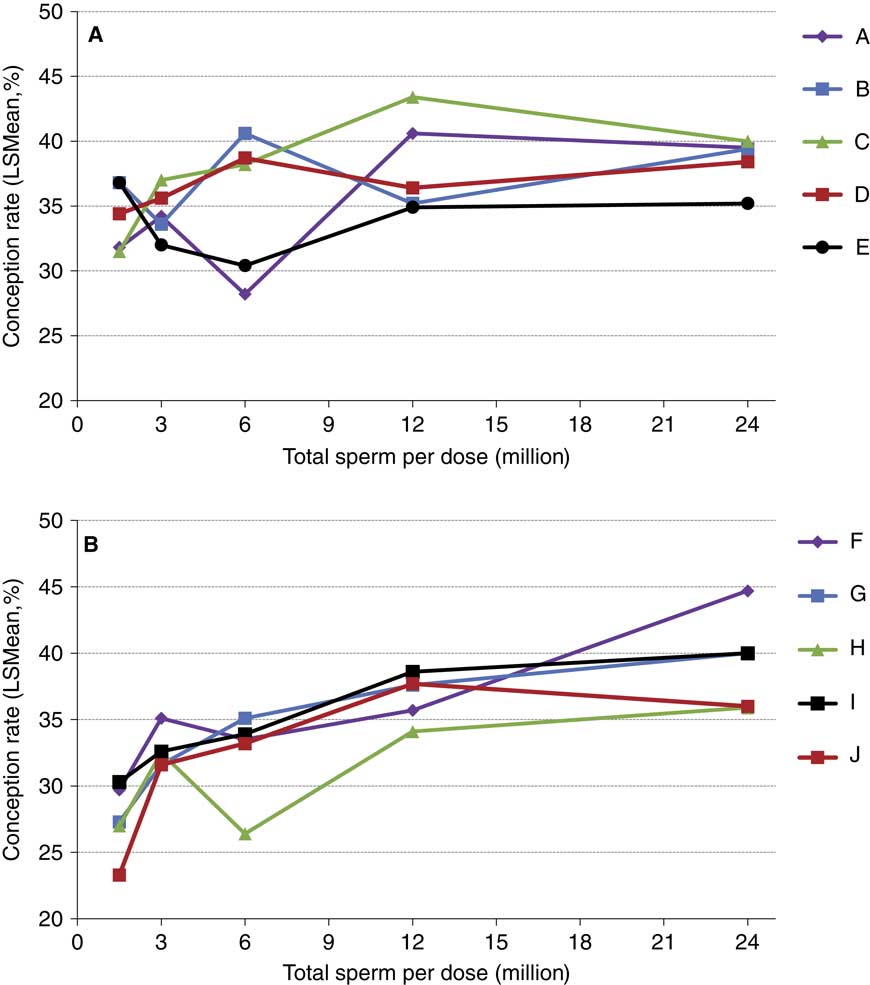
Figure 5 (colour online) Conception rates of Holstein sires whose ejaculates were processed in milk extender and packaged at concentrations of 1.5, 3, 6, 12 and 24 million sperm per straw. For visual clarity, the five (n=10 total) sires that had the highest (a) or lowest (b) numerical conception rate at the 1.5 million sperm per straw concentration are shown separately. Each data point depicted contains between 216 and 378 (mean 309±8.7) inseminations in lactating cows.
The range in straw concentration for commercial AI sires often varies for individual sires based on semen quality, fertility potential and market demand. If a bull can satisfy market demand at 20 to 25 million sperm per dose, there is typically little to no incentive to reduce dosages further. Bulls with marginal semen quality are often extended to high dosages to ensure with greater confidence that sperm numbers are well in excess of minimum thresholds, but this practice typically has no meaningful impact on the fertility of the product. In contrast, bulls that cannot satisfy market demand at standard sperm dosages may be extended to lower dosages provided their current semen quality and fertility estimates support such changes and will not be detrimental to the product quality or conception potential. The challenge for the AI industry in todays’ genomic era is that the highest demand, most valuable sires are among the youngest in the population and produce smaller quantities of semen that possess more age-associated quality issues as compared with the mature, proven sires of yesteryear. Timely access to fertility data of these young sires is becoming increasingly important in order to maximize their utilization while maintaining their fertility potential.
Implementing a quality control program
The sperm quality bioassays mentioned in this review only represent a portion of those available in our ‘toolbox’. The main purpose for conducting these bioassays in a quality control program is to identify subpar samples to prevent their distribution to the field. Subjective evaluation of motility immediately after thawing and routine morphology assessment would likely be considered a minimum staple for an AI quality control program. With each additional evaluation trait added, the efficacy of the program should increase but likely to a marginal degree. This is because most factors known to impact fertility are known to be correlated with each other as was illustrated in Figure 1. This is biologically intuitive with markers of cell health and viability as non-viable cells would likely have problems regulating cell function and integrity. As previously mentioned, recent studies by Sellem et al. (Reference Sellem, Broekhuijse, Chevrier, Caugli, Schmitt, Schilber and Koenen2015) and others have done an admirable job of examining correlations amongst commonly used sperm bioassays and determining these bioassay correlations to in vivo fertility.
An important point of discussion is to highlight that several strategically selected traits may cast a broader net within the quality control program v. the utilization and interpretation of many traits. Samples detected as subfertile by one assay will often be detected as subfertile by another. Agreement across multiple evaluation traits adds confidence for the decision maker to keep or not keep a given sample. Sub-fertile samples missed by one assay have an opportunity to be detected by another, creating checks and balances among assays. Discrepancies among assays presents the quality control team with the opportunity to re-evaluate a sample before making a final decision.
The assays an AI organization chooses to implement, and the level of repeatability for each assay, varies. Obviously, validated research indicating an association with fertility and value to the quality control program are important, but ease of implementation is also crucial. Ultimately, financial resources and the need and (or) desire for greater precision are key factors in the decision process. Well-implemented, low-expense technologies have sufficed many organizations in this industry for many decades. Technologies such as CASA and flow cytometry clearly offer advantages in precision of assigning semen quality values. However, greater precision typically comes at a greater price. Not only are the upfront costs considerable, so too are daily consumables and labor. In some cases, not only are labor needs increased for technology implementation, but they may also require more skilled labor than conventional technologies. For example, if our desire was to simply increase precision in assignment of a motility value to a semen sample, we would likely not settle for one evaluation of one straw by one laboratory technician. Perhaps, instead, we would perform triplicate evaluations on three separate straws by three independent technicians. Although this might be very reasonable to ask for research purposes, it would negatively affect production efficiency at an expense to the organization. This is an extreme example to simply illustrate that precision typically comes with a price tag that may or may not be necessary and (or) offer a return on investment. It is worth mentioning the very real expense known as ‘hassle factor’, which is difficult to quantify. Hassle factors are easily ignored in an academic setting, where low levels of throughput are paired with high numbers of highly trained graduate student labor. However, hassle factors in a commercial setting not only add direct costs but also impact employee efficiency, employee morale and perhaps even employee turnover. All of this adds to the production cost of the product and should be justified by an improvement in product performance (e.g. semen quality or fertility).
Once an array of traits is selected for inclusion in a quality control program, defining minimum thresholds is critically important but as of yet remains a non-exact science. Typically, field fertility trials are conducted using semen samples possessing a range of values for a given trait. Strategic use of low cell number dosages diminishes, but may not eliminate, the masking effect of compensable traits. Precision and accuracy of semen quality estimates are critically important in these trials, and any compromise diminishes the value of the data point for fertility correlations or threshold determinations. This is not considering the potential problems with the use/entry of semen quality traits in the statistical model or some of the inherent problems associated with confidence in the fertility data, which is discussed in a later section. Once data have been used to establish the appropriate thresholds for what is ‘acceptable’ or not, those data should be, for the most part, used in that fashion without over interpretation of absolute values. If lack of precision is a concern, this can be compensated for by simply raising the minimum standard and thereby reducing the probability of an errant estimate resulting in an incorrect decision to keep a given sample. In the end, the most important question of the commercial production laboratory is: are we making the correct ‘yes’ or ‘no’ decision to distribute and use a particular semen sample in the field? If the correct decision was made, the sample should achieve acceptable fertility. Even when incorrect decisions are made though, there are typically still millions of sperm surviving in a sample that will often allow fertilization to occur and cover up those mistakes.
Challenges of semen evaluation by independent laboratories
Independent andrology laboratories are often established or contracted to make well-intentioned diagnostic decisions related to the quality or fertility potential of semen that may have been collected, processed and frozen by a plethora of different AI organizations. Each AI organization may implement differing processing procedures, extenders, freezing rates, cooling rates and quality control techniques or standards. Establishment of minimum standards to apply across such varied semen sources is extremely problematic, and with the exception of the most extreme cases of samples having virtually no living cells post-thaw, results must be interpreted with caution. Examples exist of laboratories attempting to evaluate sperm in opaque (e.g. milk-based) extenders or extenders with non-sperm particulate matter using CASA that has not been calibrated or validated for use in these applications. Light microscopy can also have extremely poor resolution in such applications. Differences in equipment, assay procedures, sample handling and the principles of assay precision discussed previously make sample comparison among laboratories difficult at best.
Industry methods of evaluating and reporting sire fertility
The methods for recording and reporting the fertility of AI sires has undergone several changes in methodology and nomenclature as initial industry efforts in the 1940s. Nevertheless, each system has had a common goal of seeking to identify sires whose fertility deviates significantly from the average of the population. A sire’s deviation from the mean can be positive or negative, and in terms of selection, both ends of the spectrum are considered important. The emphasis a producer places on sire fertility deviations should depend upon the herd’s goals in utilizing AI, the number of cows that will be bred to a particular sire, and the herd’s ability to record, analyze and interpret fertility data to make economic decisions.
It is crucial for producers and scientists to utilize estimates of sire fertility appropriately and to understand the importance of service numbers and semen distribution across herds on the reliability of estimates. Newly released sires commonly only have 300 to 500 services reported, however, and the usefulness of the data is questionable until a sire has well over 1000 services. A producer should first select bulls to use based on the needs of their operation. Genetics of the bull should be a foremost concern, and if all other genetic parameters are equal between two bulls, then selection of the sire with a higher fertility estimate is warranted. This suggestion heavily takes into consideration the confidence that two sires are truly different from one another in regard to fertility. Estimates calculated from less than 500 to 600 services are likely to change, most often toward the average of the population. Overall, it has been recommended that an ‘acceptable’ range of fertility is ± 2 or 3 percentage points from the mean of the population (Amann and DeJarnette, Reference Amann and DeJarnette2012).
It is also important to consider that based on the principles of calculating fertility deviations, approximately half of all sires in a fertility report will fall below the average if the data follow a normal distribution. Furthermore, if/when sires that received a negative fertility deviation (below average) are culled, a recalculated mean fertility of newly selected population will once again classify half of the sires as ‘below average’. Therefore, below average in the highly selected population of fertile AI sires should not be equated to ‘subfertile’ (Amann and DeJarnette, Reference Amann and DeJarnette2012).
Non-return rates
The earliest form of sire fertility analysis was calculated from AI technicians’ breeding receipts. If a technician inseminated an animal in a herd and was not called to re-inseminate her in a specified amount of time, the animal was classified as a ‘non-return’. Traditionally, the range in time for reporting is between 50 and 90 days, and 56 days is most commonly used in literature. Typically, first service NRR data are tabulated separately from repeat services. The NRR assumes that if an animal did not receive a repeat AI she had conceived and remained pregnant through at least days 56 or 60. However, the animal may have been culled from the herd, bred by another technician, or be victim of poor estrus detection. Thus, NRR data are highly prone to error. Even when accurately reported, services early in the service period will have lower conception than those later in the reporting period simply because they have had more time and opportunity to be detected in estrus for re-insemination. In Europe and other countries where there is a mandatory component to centralized data reporting of services, NRR are still regularly used with likely a greater degree of confidence and accuracy.
Sire conception rate
Initially developed and released by United States Department of Agriculture–Animal Improvement Programs Laboratory (USDA-AIPL) in 2008 (Norman et al., Reference Norman, Hutchinson and Wright2008), the Council on Dairy Cattle Breeding provides estimates of US dairy sire fertility known as sire conception rate (SCR). This system is probably the most heavily relied upon report of sire fertility in the industry and incorporates data acquired from all 50 states, Mexico and Puerto Rico. In brief stated, this system is based on confirmed pregnancy status (pregnant or open) after each service. For each sire, the deviation from the average for all sires of that breed is presented as a percentage unit rounded to the nearest 0.1%. For the sake of understanding a within-herd comparison, a sire with a +3 SCR is predicted to achieve a CR of 36% in a herd that is averaging a 33% CR using bulls of average fertility. Rankings are based on a large, nationwide data base allowing up to seven confirmed services per cow (⩾22 months of age) per lactation, and are adjusted for numerous factors (Kuhn et al., Reference Kuhn and Hutchison2006; Kuhn and Hutchison, Reference Kuhn, Hutchison and Wiggans2008; Norman et al., Reference Norman, Hutchinson and Wright2008). For Holsteins, only sires with ⩾300 total services (⩾100 in the last 12 months) in ⩾10 herds are published. Criteria are less stringent for other breeds.
Figure 6 illustrates the December 2017 SCR evaluation for 2062 Holstein sires that possessed a median number of services of 1870. Also illustrated is the expected distribution if all 2062 sires were actually average fertility sires with 1870 services each. The actual distribution only modestly exceeds the predicted range for normal sires and serves as a testament to the efficacy of quality control programs at commercial AI centers. Further, 93% of all Holstein sires evaluated (1916 of 2062) possessed deviations within 3% of the breed average.
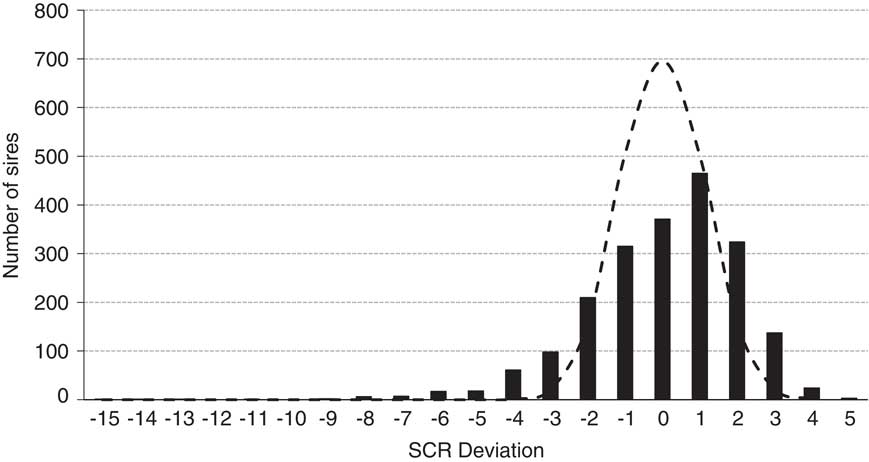
Figure 6 Distribution of December 2017 Holstein sire conception rate (SCR) deviations (black bars; n=2062 sires; median number services=1870) and the predicted distribution (dashed line) if all 2062 sires were of average fertility with 1870 services per estimate and assuming a 35% conception rate of female population adjusted to the zero base of SCR.
AgriTech Analytics Service Sire Fertility Summary
AgriTech Analytics (ATA; Visalia, CA, USA) has been publishing the Western Bull Fertility Analysis since 2003. The system is now referred to as the Service Sire Fertility Summary (SSFS), and the evaluations are based on a cow being confirmed pregnant at 75 days post-insemination. ATA data are also included in the data set used to calculate SCR. The SSFS model allows up to five services per cow per lactation, and like SCR, adjusts for environment and herd management factors including parity, milk production, days in milk, age of sire, service number and herd-month-year. Only sires with ⩾10 services in each of ⩾10 herds receive an SSFS evaluation, reported as a deviation from the current breed average.
Comparing deviations across systems
It is reasonable to question the accuracy and correlations among these reporting systems. A simple comparison can be done by examining sires which have had data reported in more than one system. In the context of this review, Figure 7 compares the fertility deviations of Holstein sires that have both SCR and ATA fertility estimates reported in the December 2017 evaluations. Qualitatively, while these reporting systems are not exact in the cross-reporting of a sire, they do appear to be generally consistent in differentiating bulls of higher or lower fertility. A bull with a positive fertility deviation as reported by ATA often receives a positive deviation from the SCR system as well. However, it is important to note the ATA data are a subset of the SCR calculation with common herds to each. Thus, the reduction in correlation from the data that are not common to each system illustrates the problematic lack of precision and repeatability in any source of field fertility data. However, if the user asks, ‘Does this sire have a normal, acceptable level of fertility (i.e. deviation>−2 or −3)?’ both systems will agree in the vast majority of comparisons.

Figure 7 (colour online) Cross-plotted fertility deviations of Holstein sires (n=919) that have both sire conception rate (SCR) and AgriTech Analytics (ATA) values reported in the December 2017 evaluations.
Role of data collection in sire fertility estimates
‘Big data’ has become a buzzword in animal agriculture. These above-mentioned fertility estimates and other large-scale fertility evaluation systems are susceptible to problems pertaining to data quality. Sire fertility data can certainly fall into this category as it is collected from thousands of farms across the United States. Millions of breeding records are processed and submitted to the models to calculate fertility estimates. Is bigger always better? There is a balancing act between scope, and one must question how representative the data are of the population of dairies and sires in the United States (or elsewhere) and whether there is extraneous ‘noise’ in those data. However, we can control noise to a certain extent by adding structure and design to data collection systems. Having the appropriate scope and a reasonable number of inseminations for each sire typically demands mass data collection. In other words, collect all the data possible, and then deal with problems post-collection. Some issues to consider with this approach include: biases in semen use and reporting, accuracy of animal identification and semen used, and data entry errors to name a few. Many of these cannot be estimated or accounted for during post hoc data cleanup steps and statistical modeling. These can influence the accuracy of a fertility estimate when estimates are calculated from a limited number of inseminations.
Reasonable interpretation of sire fertility estimates
Making good decisions based on sire fertility estimates requires an understanding of the nature of fertility data. A single breeding event results in either a pregnant or non-pregnant animal, which is known as a Bernoulli trial. A reproductive biologist understands the different potential factors that can sway the likelihood of conception either way, but the result of that single breeding (Bernoulli trial) can only have one of two outcomes. Conducting a series of Bernoulli trials, in this case meaning breeding multiple females, will yield results representing a binomial distribution.
Binomial data acquired from pregnancy trials is different than many other biological endpoints that can take on any value within a reasonable range, otherwise known as continuous variables. If we inseminate four cows, the combined percent pregnancy of these trails can only be 0%, 25%, 50%, 75% or 100%. The greater the number of trials, the greater the range in values that can occur. Therefore, there is inherent unexplained variation for a series of Bernoulli trials resulting in uncertainty. The degree of uncertainty is heavily influenced by the number of trials, or in the case of sire fertility, number of inseminations. The degree of uncertainty must be considered when comparing sire fertility estimates and is described by Amann and DeJarnette (Reference Amann and DeJarnette2012). Essentially, the more spread between the estimates and more inseminations, the more confident one can be that the two estimates are likely different and not just due to random chance.
Even if fertility differences are deemed meaningful based on statistical principles, it does not always mean the difference between the values will be biologically or economically meaningful in real-world applications on the farm. One or two percentage point differences among sires in a fertility estimate may be discernable in a large data set, but the principles of uncertainty resulting from a binomial distribution still apply for the dairy that breeds only 100 cows to each bull. The likelihood of the dairy resolving the estimated difference between sires is not likely, and it is possible that even the opposite might occur.
Another aspect of this concept is magnitude of the fertility difference. Note the distribution of the December 2017 SCR data in Figure 6. Approximately 90% of the fertility estimates are in the range from −3 to 3, a difference of only 6 percentage points. Considering a theoretical 40% first service CR in primiparous cows, this SCR range leads to comparing a 37% and 43% CR between sires. A sire yielding a CR of 37% is not a sub-fertile bull. Even when sires are designated an SCR estimate of <−4, questions pertaining to the number of inseminations and the potential bias in semen use amongst herds should be considered.
Sires collected and processed at major AI organizations are a biased population compared with all bulls as they have been selected for semen quality. Only semen from these sires that meets quality control standards is sent into the marketplace. Therefore, it is not surprising that there is not greater variation in fertility estimates among these sires. In addition, using sire fertility as a primary selection criterion may limit herd genetic advancement, and the economic incentive of fertility must be balanced with genetic merit of bulls. As sires within normal fertility ranges (−3 to +3 fertility deviation range) will likely achieve similar fertility in a herd setting, selection should always put emphasis on the genetic value added to the herd.
The future of predicting sire fertility
Artificial insemination organizations have learned over the years, both by trial and by circumstance, which characteristics of semen quality are associated with undesirable fertility results. Much of this knowledge was gleaned from research whereby intentional introduction of variation was used in an effort to intentionally make mistakes we can learn from. Once armed with this knowledge, AI centers go to great effort and expense to minimize variation by discarding collections and eliminating sires possessing poor attributes. Accordingly, the goal of most AI organizations is to provide customers with a consistent, quality product that is highly fertile. The methods applied to achieve this vary greatly by AI organization as does level of precision. Regardless of method(s) selected, utility boils down to efficiently making the correct decision to keep or discard each sample. The fact that all major sire fertility evaluation systems indicate <5% to 8% of all sires evaluated have deviations more than 3.0 points below the mean is a testament to the efficacy of these quality control programs. Furthermore, these results are achieved by AI organizations implementing both high and low levels of technology. Considering the degree of correlation among many semen quality attributes, a primary question of both past and for future research efforts is whether a new technology really gives us new information or simply provides an alternative technique to measure what we already know.
Despite our best efforts, a small portion of the AI bull population escapes detection and generate fertility deviations more than three points below the mean. By in large, these sires will have semen quality characteristics comparable to normal fertility sires making them prime candidates for future research involving novel semen quality tests, endocrine-related research and genomic investigations. As future research efforts focus on this population of sires and identify novel semen quality traits associated with fertility, these techniques will be added to the list of tools used to cull semen collections (or sires) and will further improve an already admirable track record of the AI industry. Unfortunately, such research may occasionally determine that the original estimate of subfertility in certain sires is not repeatable, leaving us to wonder if the transient fertility problem was associated with the sire, semen quality, or simply an artifact of random chance or noise in the data. The greatest pitfall in semen fertility research is failing to recognize the lack of precision in the sire fertility estimates themselves, leading to fruitless and frustrating attempts to explain the unexplainable (i.e. deviations within the normal range binomial probabilities). In reality, the precision of many existing measures of semen quality likely far exceed the precision in our attempts to measure the true fertility potential of any given semen sample or sire.
Looking toward the future, to fully exploit the opportunities of in vitro semen quality analysis, electronic tools and technologies to assist in tracking field fertility at the ejaculate level in the field will be essential. The ability to routinely make the link between a batch of frozen semen and the resulting fertility thereof would be a considerable step in advancement of fertility prediction. Asking humans to voluntarily record freeze codes from straws has been a losing proposition for decades. Bar codes are presently available on straws from some organizations, and microchip straw identification may be possible in the future. Radio-frequency identification for livestock is growing in on-farm popularity. Technologies to bring this information together at cow-side and transfer to on-farm record keeping systems will not only assist in tracking fertility to the ejaculate level but may someday greatly enhance the efficiency and accuracy of all insemination data reporting on-farm. One limitation to the utility of this concept may include the probability of young sires in the genomic era producing sufficient numbers of straws to accurately measure fertility potential from field data.
Nonetheless, converging technologies from in vitro semen quality evaluations, genomics, proteomics and on-farm data management, recovery and use will ensure that the next 10 years in the AI industry will likely realize more gains in knowledge of factors impacting sire subfertility than have been gained in the last 50 years.
Acknowledgments
The authors would like to thank Select Sires, Inc. and any related collaborators for the opportunity to share the data provided in this manuscript.
Declaration of interest
The authors have no conflicts of interest to disclose.
Ethics statement
The authors have no approval of this work by an ethics committee to describe.
Software and data repository resources
The data and models presented in this manuscript are not deposited in an official repository. The data and figures presented in this manuscript are considered the property of Select Sires, Inc., and distribution and alteration should not occur without the prior written permission of Select Sires, Inc.


